Trading journals can be effective tools in changing trading behaviors. They can also be helpful in tracking and working on performance. A while back, I wrote on the topic of formatting journals for trading success. The stimulus for that post was the realization that traders often use journals in ways that are not constructive: simply as tools to vent frustration and recount trading problems.
When I first began learning to trade, I used journals in ways different from the above. Each day I reviewed major turning points in the stock indexes and observed how indicators and correlated indexes behaved. The exercise consisted of identifying--in retrospect--the trading opportunities that were best and the information that might have put me into those trades.
In a sense, I used the journal to reverse engineer markets.
The journals consisted of pages and pages of annotated charts. Although I did not use the term at the time, the goal was pattern recognition.
Sure enough, patterns began to recur in my journal entries. That is how I learned about confirmations/non-confirmations and their roles in continuations and reversals of moves. That's also how I learned about intraday sentiment and NYSE TICK; the role of volume in estimating volatility; and the distinguishing features of breakout trades, range days, and trend days.
In the beginning, I didn't know what to look for. I spent time with many indicators (including many of the common ones included in charting programs, as well as chart patterns and cycles) that added little value to my pattern recognition. It was the patterns that recurred over time that became my focus.
I realized that if I could just find a few stable patterns, I could work on recognizing them in real time and sustaining profitability.
I spent over a year on those journals before I ever placed a trade. The charts are still organized in folders in my cabinet for reference.
One of my goals for 2010 is to repeat that learning process and learn entirely new patterns. As I noted a while back, every day the market teaches us lessons. The challenge is being prepared to learn from them...and then relearn them.
.
Monday, November 30, 2009
Are Traders Showing Risk Appetite or Risk Aversion?

One indicator I like to follow during the trading day is the relative performance of small caps and emerging market stocks (EEM; chart above) relative to the large cap indexes, such as the Dow Jones Industrials and the S&P 500 Index. When traders are operating with a risk appetite, they tend to buy the more speculative small caps and emerging market stocks to take advantage of their beta. When traders are risk averse, they seek the safety of blue chip, large cap stocks.
So far today, small caps and emerging market stocks have been relative underperformers. That has been one factor that has led me to question the vigor of the afternoon bounce in stocks.
.
Midday Briefing for November 30th: Recognizing Range Trade

Today's trade thus far has illustrated many qualities of a range day:
* Oscillation around the volume-weighted average price (VWAP; red line);
* Relatively flat VWAP line;
* Mixed volume transacted at offer vs. bid (bottom histogram);
* Mixed distribution of NYSE TICK;
* Difference between advancing and declining NYSE stocks of fewer than 1000 issues;
* Mixed sector performance (strong financials, weak small caps);
* Inability to sustain prices above or below overnight and/or prior day's range.
Interestingly, trade has not been particularly slow despite being range bound. That has given us greater amplitude of movement around that VWAP line. Good trading opportunities can develop when we have decent volatility during a range trade.
.
Morning Briefing for November 30th: Wide Pre-Market Range


9:33 AM CT - I've added the top chart (100,000 contract bars) to show how we've traded within the overnight range thus far this morning, oscillating around the day's volume-weighted average price (VWAP; red line). The inside bar between 8:59 and 9:22 AM CT set up a nice upside breakout move above the 1093 area resistance. As long as we stay above that level, I expect a test of the overnight highs, especially given U.S. dollar weakness and firmness among commodities.
Here we see the pre-opening trade in the ES futures, with the Market Delta chart denominated in 50,000 contract units. As noted in my recent post on volume bars, I like to see how volatility is coming into and out of markets as the day progresses, without having the day's distribution of volume distorting that relationship.
We're setting up a broad pre-market range going into the open, with relatively equal distribution of volume throughout (right histogram). Volume at bid has exceeded that at the market offer price so far (bottom histogram), as we've had trouble sustaining prices at the 1098 resistance area. We've moved below the day's volume-weighted average price (VWAP) around 1091; failure to sustain buying volume above that price will target the overnight low.
I'll update the volume bar chart later today to illustrate the relationship between volatility and direction in the morning trade.
.
Weekly Stock Market Volatility Continues to Wane

How much price movement can we expect during a trading week? As we can see from the chart above, that measure of volatility has been dropping steadily through 2009. The red line shows the average weekly high-low range, expressed as a percent, over the past 10 weeks. That average range now stands at 3.4%, down from about 10% early in the year.
Adapting to this lower volatility has been one of the great challenges of trading during 2009. As I noted back in May, daily average ranges fell below 2%, down from 4.5%. That level is now about 1.23%.
How far is the market likely to move in your favor? How far should your stop points be set? When are moves ripe for reversal? Knowing how markets are behaving in their volatility is just as important as knowing their directional tendencies.
.
Sunday, November 29, 2009
Indicator Update for November 29th


Here we see a few continued signs of market weakness, despite the rise of large cap indexes to new price highs this month. Note how the number of stocks registering fresh 20-day highs vs. lows has tailed off over the last several months (top chart). After Friday's weakness, we're now once again seeing new 20-day lows outnumbering new highs.
As the two charts from Decision Point illustrate, among the particularly weak sectors are small caps (middle chart) and financial shares (bottom chart). If you look at the bottom panes of those two charts, you'll see how the advance/declines lines specific to small cap issues and financial shares have lagged badly in recent weeks.
The stock market shrugged off the Dubai-related weakness rather well in Friday's session, but I'm going to need to see more strength among small caps and financial stocks to tell me that the market's recent correction is over. I will be tracking new high/low data each morning prior to the market open via Twitter (follow here).
.
Sector Update for November 29th

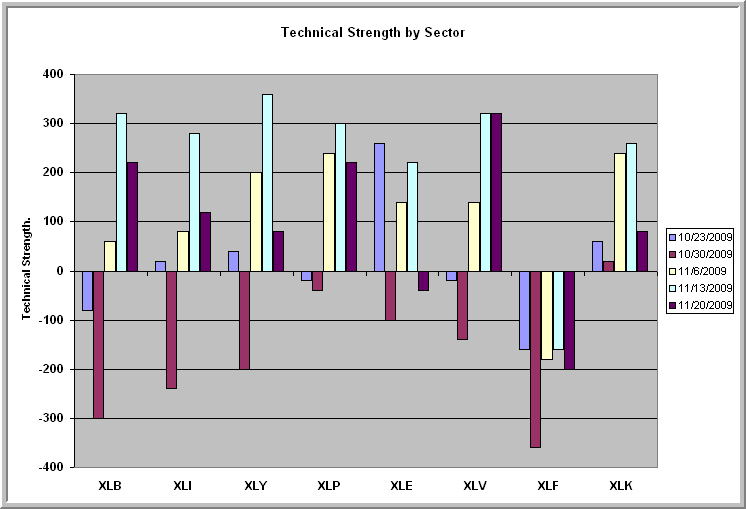
Last week's sector update noted that sector performance had weakened from the prior week, accompanied by relative strength among Health Care shares and relative weakness among Financial issues. On the heels of Friday's weakness and default fears coming out of Dubai, we saw a continuation of the mixed sector performance, with most sectors in non-trending modes. Indeed, as we look at the Technical Strength measure of short-term trending, five of the eight sectors that I track each week are in neutral territory.
Here's how the Technical Strength readings break down sector by sector:
MATERIALS: 40
INDUSTRIAL: 40
CONSUMER DISCRETIONARY: 40
CONSUMER STAPLES: 120
ENERGY: -60
HEALTH CARE: 340
FINANCIAL: -440
TECHNOLOGY: -40
INDUSTRIAL: 40
CONSUMER DISCRETIONARY: 40
CONSUMER STAPLES: 120
ENERGY: -60
HEALTH CARE: 340
FINANCIAL: -440
TECHNOLOGY: -40
We can see that most of the sectors weakened modestly from the prior week. The notable weakness has been among the financial shares, which have been relative weak for six consecutive weeks. My concern is that this appears to be more than mere sector rotation; investors are actively avoiding banking shares, perhaps out of concerns regarding credit default and continued economic weakness.
It is difficult to see the market sustaining a solid uptrend in the absence of a healthy financial sector. I will be watching closely to see if credit fears continue to create weakness among the broad list of shares; as always, daily measures of trending, momentum, and strength will be posted via Twitter prior to each market open (follow here). For now, I'm viewing the current period (which began with a momentum peak in September) as a consolidation of the market's bull gains from March. Failure to stay above the October price and indicator lows would be an indication of a more serious market correction.
.
Fresh Weekend Perspectives
* Thanks to Mike at SMB Capital for this link to a major leaguer who has the right attitude about learning; here's Mike's take on Friday's post-Dubai news trade;
* Removing the self from performance;
* Food stamps now feed 1 in 8 Americans and 1 in 4 children;
* Getting off the performance roller coaster;
* Trading like a sniper;
* A rush for land in Africa;
* Thanks to a sharp reader for this video on China and why it's encouraging citizens to buy gold;
* Will Dubai become a major default?
* Bank stocks look to be affected by Dubai's crisis;
* Ethanol has become a disaster;
* Stocks paying high dividends.
.
Saturday, November 28, 2009
A Tale of Two Housing Markets: No Recovery at the High End
Back in July, 2008, I posted on the topic of variation in housing inventory. I also showed how housing inventory was radically different across cities of similar size. Later, in January, I posted on the lumpiness of housing inventory in my region of Naperville, IL.
So now, after some bounce in the economy, how does that inventory look?
Sad to say, not a lot has changed.
On the surface, it's not too bad a situation: 844 homes are for sale in the Naperville, IL area and 927 have sold year-to-date, according to data gathered by local realtors. The average time on the market of 175 days for the houses that sold suggests that inventory is not moving quickly. The average time on the market for the houses that are currently for sale is 262 days.
At present, 174 contracts are pending on home sales; those have averaged 224 days on the market.
But here's the rub: A total of 132 out of the 844 homes for sale are priced at $1,000,000 or greater. Those have been on the market for an average of well over 500 days. Only 10 of the 174 contracts pending are on homes in the $1,000,000+ range and, year-to-date, only 28 of those expensive homes have sold.
What that means is that, at the upper end, there are many years' worth of housing inventory. Little in the current economic recovery has helped this portion of the market. Indeed, given the continuing credit crunch and difficulty obtaining jumbo mortgages with anything less than 50% down, it is difficult to see what will help the upper end of the real estate market. And, if developers cannot sell these properties--many of them are new construction sitting vacant--that cannot bode well for the local and regional banks that lent money for the projects.
At the upper, upper end of the local housing spectrum, there are 23 homes on the market for $2,000,000 and up. No contracts are pending; only 1 house in this price range has sold to date. Multiply these dynamics across housing markets far more troubled than Naperville--from south Florida to Las Vegas--and you can see how talk of a housing recovery gives only a partial picture of the actual situation.
.
Novelty: A Key to Psychological Change
My first post in this series dealt with the importance of processing market information in novel ways: fresh viewing can lead to new and better ways of doing. (See links included in that first post to assess your own learning styles).
Nowhere is this principle more important than in the process of psychological change. What helps people change in a therapeutic or coaching relationship is novelty: leveraging the power of a positive relationship to help people see themselves and their situations in new ways, so that they can respond differently. (See this post for a more detailed presentation of this idea; see this post for important implications).
In coaching ourselves for trading success, our job is to create new, constructive experiences that disrupt old problem patterns.
So many times, we become locked into behavior patterns. We are afraid to miss market moves, enter markets impulsively, lose money, and then feel even greater needs to participate in moves to make up for what we lost. Round and round we go.
The corrective emotional experience, as therapists call it, is to actually miss a market move and see--first hand--that other moves and other opportunities develop. After all, you can't overcome a fear by avoiding it. The novel experience is to face the fear and find out that the outcomes aren't as bad as you anticipated.
In behaving differently, we experience ourselves in new ways. If I go to the gym for a while, I begin to experience myself as physically fit. That, in turn, influences my energy level, which in turn can enhance my general outlook. Small changes can self-amplify, creating options for thought and action that hadn't been present before.
Suppose I have been haphazard in keeping up with chores at home and in staying in good physical shape. After a while, I begin *feeling* sloppy and undisiciplined, and that carries over into my decision making in markets. If I'm experiencing myself as focused and goal-oriented in my personal life, those same qualities during trading will come naturally.
But I can never talk myself into discipline if most of my life experience is haphazard.
A single new set of experiences can be enough to catalyze change. Becoming more goal-oriented in one sphere of life can provide the energy and optimism to extend that orientation to other life spheres.
If you understand that, you understand that there is no sharp demarcation between working on yourself as a person and working on yourself as a trader. How you experience yourself ultimately shapes how you think, feel, and behave.
Our trading performance always reverts to our personal means. For more on the topic, check out the post on "how to change yourself".
.
Friday, November 27, 2009
Risk Management and Opportunity Maximization in Trading
A while back, I wrote on the topic of how to lose money the right way. If there is a holy grail to successful trading, it probably is risk management.
Risk management isn't just about keeping losses down; it also means taking maximum prudent advantage of opportunities that present themselves. It's taking more risk than reward in one's trades that ultimately can lead to failure.
Here's a quick test that I periodically conduct for my own trading:
Take the 10% of your biggest winning trades for the year and calculate how much you made. Then take the 10% of your biggest losing trades for the year and calculate how much you lost. If you lost more than you made at the tails of your distribution of returns, you know that risk management is a potential problem for you.
When the size of your average winning trade is smaller than the size of your average loser, you can only compensate by having many more winning trades than losing ones. That puts considerable performance pressure on traders, especially during slump periods and occasions when markets shift their direction and/or volatility.
What doesn't show up in risk management reviews are trades not taken. The flip side of big losing trades is the failure to execute trades that would have been large winners. That is why it is important, not only to identify when you would get out of markets (to limit exposure), but also to identify what would get you "all in".
Many traders fail because they cannot limit their risk. Many others fall short because they lack the courage of their convictions. Somewhere between confidence and overconfidence lies the sweet spot for successful traders.
Is the Dubai Debacle a Game Changer?

Here we see the falling yields on 10-year Treasury notes, as the flight to quality in the wake of Dubai default fears has driven those yields back toward October lows.
The effect of falling interest rates is to reduce the rate of return for investors seeking safe investments, as anyone shopping for certificates of deposit or short-term high quality bonds has realized for a while now.
That, in turn, pushes investors further out on the risk spectrum, seeking longer maturities and riskier asset classes. Hence, the recent outperformance of high yield bonds and both debt and equities among emerging market countries.
Most crucially, falling yields speak more to investor concerns over deflation than inflation. As long as headline inflation cannot provide political cover for the Fed, it is unlikely that there will be a change in monetary policy. That, over time, will support a managed decline in the value of the U.S. dollar, which in turn supports a transition from a consumption-based economy to an export-driven one.
At some point, that weakened dollar will exert inflationary pressures and we will have to reckon with the prospect of higher rates and a changed Fed policy. It's difficult at this moment to see that point on the immediate horizon: all of which will continue to support the dollar carry trade and the flight to risk assets despite stiff risk aversion shakeouts (such as the one we're seeing now) along the way.
.
Thursday, November 26, 2009
Midday Briefing for November 26th: Thanksgiving Day Massacre?


The S&P 500 e-mini (ES) futures (top chart) and the NASDAQ 100 (NQ) futures (bottom chart) have moved back into their October ranges, on the heels of reports concerning a delay in debt payments by Dubai World. On the heels of multiple non-confirmations that accompanied recent price highs in November, I will be watching closely to see if we take out the late October lows in such indicators as new highs/lows and advance/decline line. Also worth watching is the U.S. dollar, which may become a relative safe haven in the event of concerns regarding emerging market debt.
.
Thanksgiving Day Readings
I hope you have a great Thanksgiving vacation and, more than that, hope you have much in your life to give thanks for. Gratitude does wonders for one's attitude!
* Six questions I draw upon to prepare for the trading day;
* Excellent interview with Rob Hanna of Quantifiable Edges;
* A new site for rating trading and investment services;
* Coping with trading stresses and where coping goes wrong;
* Banks remain in bad shape despite rising income;
* Worthwhile Thanksgiving thoughts;
* Hope you get some time this holiday to recharge your emotional batteries;
* Charting the economic crisis.
.
Wednesday, November 25, 2009
Midday Briefing for November 25th: Cross-Currents


Many cross-currents in the markets lately: yields on 10-year Treasury notes continue to decline (top chart) in the wake of continued Fed ease. That has given the green light for USD selling and strong performances today in the euro and Aussie dollar; it has also supported the commodities, with gold registering yet another fresh high.
All of that is supportive of stock prices, and the ES futures are knocking at the door of their recent bull highs. Still, small cap issues lag and financial stocks (bottom chart) are notably weak. GS, for example, has been making day over day lows with consistency. Today we see fewer than 1000 stocks making fresh 20-day highs across the NYSE, NASDAQ, and ASE thus far. With such a narrow base to stock strength and glaring weakness among banking issues, it's difficult to get too excited about today's strength, in spite of the supportive macro picture.
.
Morning Briefing for November 25th: On Breakout Watch


While stocks (ES futures, top chart) remain in their multiweek range, we can see that the euro has broken to the upside vs. the U.S. dollar (bottom chart), with continued strength in gold, but weakness in oil. Both the NASDAQ 100 and Russell 2000 indexes are off their multiweek highs, suggesting we'll need to see solid breadth to create a valid upside breakout. With the holiday looming, it may be difficult to muster the volume for such a push up. The distribution of the NYSE TICK early in the day will give a good indication as to whether we can sustain a directional push.
.
Goal Setting and Well-Being: Antidotes to Frustration
Note: Previous posts in this series are:
* How to Overcome Frustration in Trading
* The Well-Being Hypothesis: A Framework for Addressing Frustration in Trading
* How to Overcome Frustration in Trading
* The Well-Being Hypothesis: A Framework for Addressing Frustration in Trading
In the most recent post in this series, we saw that frustration generally only disrupts thought and behavior when it occurs against a backdrop of diminished well-being. If people don't feel fulfilled, happy, and satisfied with their lives, they're more prone to react--and overreact--to the normal frustrations of daily life.
What is well-being? A previous post outlined four pillars of positive psychological experience. That post concluded: "The wise trader structures his or her day to maximize experiences of well-being: that is what sustains motivation, concentration, and the ongoing learning needed to adapt to ever-changing markets."
This is an important principle: how we structure our trading determines the level of well-being we are likely to experience.
Consider the recent article that I linked about basketball superstar Kobe Bryant. At 31 years of age--and after 14 years in the NBA--he can no longer sustain his old feats of athleticism. Surely that would have to be a source of considerable frustration to such a competitor.
The article makes clear, however, that Kobe is not beset with frustration in the least. Rather, he has focused on developing new aspects of his game that compensate for his lost abilities. This positive focus is what sustains his well-being, balancing any frustrations that he encounters from game to game.
Check out the linkfest on goal-setting; it makes clear that goals cement learning and development in trading. When we have goals, we have tangible yardsticks for measuring our progress. Those yardsticks, when properly chosen, provide the basis for joy, satisfaction, and energy: they move us forward, even as we encounter day-to-day and trade-by-trade frustrations.
My experience is that the vast majority of traders do not set daily, weekly, and longer-term goals. Even fewer concretely track their progress toward those goals and make needed adjustments. In short, they are not pursuing their careers the way that a Kobe Bryant or Tiger Woods might.
This absence of goals and structured development not only prevents a trader from excelling: it robs the trader of potential positive experience. Every bodybuilder knows that specific goals--whether they be goals to lift particular weights or goals to improve the definition of certain parts of the body--are what sustain competitors through grueling training. Without the opportunity to achieve goals, physical training (like training in trading) is mere drudgery.
Few traders make the link between discipline problems and the absence of performance-oriented goals. You can do all the psychological exercises in the world, but if you're not structuring your development process to yield well-being, you'll miss out on the optimism, drive, and determination that propel elite performers.
.
Tuesday, November 24, 2009
Quick Tuesday Reads
* Here's a questionnaire to assess your mood during trading;
* High frequency trading would get a lot less frequent if Congress passes a .25% trading tax;
* Two qualities we find among successful traders;
* Feeding government and starving private enterprise;
* 23% of mortgage borrowers are in trouble;
* Looking for a resolution of a triangle pattern;
* What happens when you buy new 10-day lows in the S&P 500 Index?
* What happens after extreme earnings reports and other good reading.
.
Midday Briefing for November 24th: Slow, Range Trade

Stocks (ES futures, above) have settled into a range, as trade has become quite slow. We broke below the 1100 area mentioned this morning, but since have consolidated just above that . Small cap stocks are once again underperforming large caps, and we're seeing weakness in oil; the dollar vs. euro is also range bound. The multi-week range outlined this morning is the important big picture across markets: the break from that range should be significant. I continue to focus on how we trade around that 1100 area as an important tell as to the direction of that break.
.
Information Processing, Learning Styles, and Trading
One frequent experience I've had as a writer is to begin writing about a topic and then discovering new ideas about the topic that I hadn't intended to include in my article or book. It's as if the writing became a kind of brainstorming, helping me arrive at insights that otherwise would have never emerged in day to day thought.
Similarly, I have seen fresh ideas emerge among traders as a result of discussion. Each trader will bring a novel perspective to the dialogue, sparking a new look at markets. In such cases, the whole ends up becoming larger than the sum of the parts: out of new pieces of information can emerge an entirely new and promising trade idea.
All of us process information in a variety of ways. We learn in different ways (see this post for more details and a link to an online questionnaire; see also this self-assessment post), but often don't make use of our different styles of processing data.
One way around that problem is to make sure you process your trading plans in at least two modalities. For example, you might write down your market ideas and plans, but also talk them aloud. You might plot your buy and sell points on a chart, but also write down your reasoning in a blog.
The idea is that processing your ideas in multiple ways will provide you with multiple perspectives on markets. It is different to see your ideas, think them, and hear them spoken aloud. Many times, what makes sense when we're thinking an idea does not make sense when we flesh it out on paper or share it with someone else.
Creating multiple modes of information processing can provide us with the experience that I've had as a writer: in elaborating our ideas, we can often generate new ones.
And it is much more difficult to act impulsively if we have to not only think through our ideas, but spell them out for others to see or hear.
More on generating novel perspectives in my next post in this series.
.
Morning Briefing for November 24th: Continuing in the Range

Pre-opening GDP and housing numbers did not move the market significantly, and we remain in the multi-week range (ES futures, above). The area around ES 1100 level has been important support this morning and has been a significant level during the multi-week range. We need to hold above that level to test the range and bull market highs. If we can hold that level with corroboration from other risk assets, we could get a nice upside breakout move. Failure to hold 1100 would target the range lows.
.
The Well-Being Hypothesis: A Framework for Addressing Frustration and Lapses in Trading Discipline
The first post in this series highlighted the link between frustration and loss of discipline in trading. Stated in a different way, lapses of discipline tend to be state-dependent: we enter a frustrated, angry, confused, or discouraged state and that colors how we process and act upon information. A major way in which these states disrupt decision-making is by interfering with the cues that provide an experienced trader with his or her "feel" for the market. One of my best posts details how this happens.
There are many psychological techniques for quelling frustration, from cognitive techniques to change our thinking to behavioral, relaxation methods. Ideally, however, a trader's goal should be to prevent frustration in the first place.
This brings us to what I will call "the well-being hypothesis". (See this post for a detailed presentation of emotional well-being and its components). The hypothesis is that frustration tends to occur against a backdrop of diminished well-being. That is, if we are generally happy and satisfied in life, normal events that interfere with our goals will not be experienced as overwhelming frustrations. It is only when such well-being is relatively absent that the frustrations of normal life become emotional focal points.
Relationships are a good example. A happy marriage can weather the frustration of an occasional disagreement or conflict. I can think of plenty of disagreements in my own marriage, but I can't recall a time of yelling, arguing, or fighting. The disagreements occur against a backdrop of general goodwill and connectedness. If we lacked the well-being that comes from common values, shared experiences, and an emotional bond, it would be easy for those frustrations to accumulate and fester.
Similarly, when I'm having a good day and everything seems to be going my way, getting caught in traffic is but a minor annoyance. I turn on the music in the car and make the most of my wait. If it's been a day without gratification, however, the traffic jam just might be the straw that breaks my emotional back, causing me to fuss and fume throughout the wait.
Happy, satisfied people, on average, don't experience frustration to such a degree that it will dominate thought and behavior. Indeed, for a reasonably fulfilled person, stresses can actually contribute to well-being over time.
If the well-being hypothesis is correct, then an important way to prevent frustration--and hence its disruptions of trading--is to maximize positive emotional experience. Said in another way, the problem with discipline may be as much about a lack of positive experience in trading as the presence of overwhelming negatives. Instead of working to eliminate frustrations--probably an impossible task--we need to find ways to sustain well-being during the most challenging market periods.
The next post in this series will address this challenge.
.
Monday, November 23, 2009
Monday Perspectives and Observations
* Important post on making adjustments to changing market conditions;
* Disgust as an important element in the psychological change process;
* Which days are bullish around Thanksgiving?
* Good look at health care stocks and other ETFs;
* Put/call ratio got pretty low during the market's morning rise today;
* PIMCO buying government debt, avoiding mortgage debt;
* Expectations that bond yields will hit 5.5% in 2010;
* Continued concerns over asset bubbles in emerging economies;
* Excellent overview of economic indicators.
.
A Look at a Trading Range Across Markets


Here we can see a broad trading range in the S&P 500 e-mini (ES) futures (top chart) and in the euro (bottom chart). A look at commodities (DBC, for example) shows similar rangebound action.
I noticed that we made a little over 1000 new 20-day highs across the NYSE, NASDAQ, and ASE; that's down from over 1400 at last week's peak. We're also off last week's peak in the advance-decline line specific to NYSE common stocks. I will be watching the breadth and new highs carefully this week to gauge the odds of breaking out of this range to the upside vs. falling back into the range and possibly retesting the lows.
Keep an eye on the Twitter posts; I'll be using them to update indicators (follow the Twitter stream here).
.
Midday Briefing for November 23rd: Reversal


What started out looking like a trend day to the upside in stocks (top chart) faded out, as the dollar strengthened vs the euro (bottom chart) and Aussie dollar and commodities beat a hasty retreat.
Interestingly, however, we still have over 1500 more advancing stocks than decliners, as we remain above Friday's close. The reversal sets us up in a wide range between today's high and Friday's lows: a range that may hold if trading slows down during this holiday week.
.
How to Overcome Frustration in Trading: Part One
A while back, I wrote on the topic of steps to take to break patterns of frustration in trading and suggested resources for traders who find that frustration is interfering with their trading.
Much of what is viewed as a loss of discipline is actually the result of impulsive decision-making under conditions of frustration.
What that means is that you can best work on mastering frustration when you are actually in a frustrated state. It is difficult to prepare for making decisions in the heat of battle when you're in a cool and collected state.
This is where guided imagery is particularly helpful. By mentally rehearsing frustrating scenarios (such as missing a trade or getting stopped out) and including in the rehearsal a mental walk-through of what you want to be doing to handle the frustration, you can prepare yourself for adverse scenarios. This is very helpful in avoiding impulsivity, as you gravitate toward the positive coping that you've been rehearsing each day.
There are a range of brief therapy techniques that are effective in combating frustration. Check out this earlier post on short-term change methods, as well as Chapter 7 of The Daily Trading Coach, which describes behavioral techniques for overcoming stress.
In my next post on the topic, I'll address frustration from a different angle.
.
Morning Briefing for November 23rd: Staying Above Key Levels

The purple horizontal lines show some of the price levels I'm focused on this morning in the S&P 500 e-mini (ES) futures. We broke above the 1095 resistance area overnight on good volume and momentum, supported by a weaker U.S. dollar and stronger commodity prices. After some consolidation, which held the area just below 1100, we broke higher still and have so far held above that consolidation high around 1102. As long as we continue to see dollar weakness and firm commodities and ES prices holding above that 1100 area, the bulls should control the session and have us making a stab at the highs from early last week.
Failure to hold above that 1100 consolidation low would signal a reversal and keep us in the trading range defined by last week's highs and lows. Volume at the market offer has so far exceeded that at the bid, supporting the bulls.
.
Think Like a Price Maker, Not a Price Taker
Adam Warner has an excellent post up illustrating the volatility assumptions of $VIX and $VXX. To summarize in Adam's words: "longer term volatility assumptions just keep eroding."
With a holiday period around the corner, followed by a holiday period next month, traders begin to pack it in for the year.
I notice that Friday's volume in SPY was the lowest in over a month. The next lowest volumes? Tuesday and Wednesday of this past week.
With contracting volume comes contracting volatility. Tuesday was an inside day. Friday traded within its overnight range.
As portfolio managers pack it in and take their volume with them, that leaves market makers--including those infamous algorithmic programs that operate close to the market--as the dominant players. If you don't understand how they trade, you're likely to be on the other side of their trades.
Look for places where bears and bulls are loaded up, but can't push prices lower or higher. They are the ones that will have to flee their positions, giving good prices to those market makers. That means picking your spots in slow, range markets; it also means thinking like a price maker, not a price taker.
It is possible to make money in slow markets *if* you can slow yourself down and become the sniper. Thinking like a price maker, you will take money from those that play for expanding volatility in a contracting environment.
.
Sunday, November 22, 2009
Trading Views: Volume Two
After posting some big picture viewpoints yesterday, I thought I'd add a second collection of trading-related posts from around the Web. Lots of good stuff out there!
* Questions to ask when you're trading in a range; see also VWAP and range trading;
* An indicator that shows backtested promise, with lots of good links for background;
* Excellent post on adapting to changes in the market created by algorithmic programs;
* Nice video (click on video and maximize You Tube screen) illustrating prop trading of CL;
* Three trading lessons from baseball great Ted Williams;
* A look at professional portfolios, updated from SEC filings;
* Linkfest on the difficult topic of trading addictions.
.
Waning Momentum and Strength: A Look at Two Indicators


After once again topping out ahead of price--a common pattern--my short-term measure of market momentum (bottom chart) has moved to neutral territory, but is above the levels that have been recently associated with market bottoms.
We're also seeing new 20-day lows among NYSE, NASDAQ, and ASE stocks running ahead of new highs. Note how new highs vs. lows lagged significantly at the recent price highs. As long as new 20-day lows exceed new highs and short-term momentum is weakening, my stance on the market is defensive.
.
Sector Update for November 22nd
Last week's sector review noted strength among large cap stocks, but weakness within specific sectors and among small caps. This past week failed to see a broadening of the market rally, and we moved lower as the week progressed. That left the eight sectors that I track weekly (above) in a mixed Technical Strength status.
(Recall that Technical Strength is a proprietary short-term measure of trending and varies from a very bullish +500 to a very bearish -500, with scores between -100 and +100 indicating no significant directional tendency).
What we see is that Health Care stocks are the only group in a strong uptrend; Financial shares remain in a downtrend. Other sectors are either non-trending or weakly trending higher. The greatest week-over-week decline in strength occurred among Consumer Discretionary and Energy stocks, as economically-sensitive sectors weakened overall.
Here is how the sectors looked as of Friday's close:
MATERIALS: 220
INDUSTRIAL: 120
CONSUMER DISCRETIONARY: 80
CONSUMER STAPLES: 220
ENERGY: -40
HEALTH CARE: 320
FINANCIAL: -200
TECHNOLOGY: 80
INDUSTRIAL: 120
CONSUMER DISCRETIONARY: 80
CONSUMER STAPLES: 220
ENERGY: -40
HEALTH CARE: 320
FINANCIAL: -200
TECHNOLOGY: 80
We can see from the chart above that Financial stocks have been in a negative strength mode for several weeks running. This bears watching: it is unusual for a sector to not show greater rotation during a period of generally firm index prices. Such persistent weakness suggests that investors may be anticipating further bad news from this key sector.
Overall, however, the sector readings are neither meaningfully overbought or oversold. They're consistent with a consolidating/correcting market that has moved significantly higher since late October, but are not at levels that have been seen at recent intermediate-term bottoms. As always, I will be tracking market trending via my basket of stocks each morning prior to the market open via Twitter (follow here). For a listing of the stocks that go into my sector-based baskets, check out this post.
.
Intraday Put/Call Ratios as Short-Term Sentiment Measures

If you take a look at my recent post on the CBOE equity put/call ratio, you'll get a sense for what an average ratio has looked like lately.
Those ratios, however, can also be informative on an intraday basis.
Here we see Friday's trade in the S&P 500 Index (SPY; blue line) plotted against the CBOE equity put/call ratio for each 30-minute period of the day. Note how a very high level of bearishness accompanied the early market action, as we held above the overnight market high and then rebounded in the afternoon. Note also how the ratio turned bullish as we leveled off late in the trading day.
While there isn't a one-to-one correspondence between tops and bottoms in the put/call ratio and bottoms and tops in stocks, the ratio does do a nice job of telling us when the bull or bear sides are becoming crowded. Those are occasions where we're most likely to see short-term reversals.
.
Saturday, November 21, 2009
Learning to Shift Emotional Gears as a Trader
A worthwhile blog post written by Richard Friesen describes what happens to traders when their brains downshift into flight or fight responses. In the post, he suggests a breathing and visualization exercise to achieve control of both body and mind. As I noted a while back, an effective way to prevent yourself from going on tilt in your thinking and trading is to exercise physical self-control.
Still another way to exercise self-control after a difficult trading period is to strictly control your trading size and the risk taken per trade. Large increases in position sizing magnifies the variability of profit/loss swings, which in turn magnify our emotional responses. The drama created by the increased risk creates potential trauma emotionally; once we're scarred from negative experiences, we end up trading scared.
A little while ago, I hit a high water mark in my yearly P/L and then took a full-sized position in a longer-term trade idea. Now, of course, we can increase the risk of trading not only through position sizing, but also through holding periods: the longer we hold a position, the greater the variability in returns. After all, the market moves up and down more in a week than in a day; more in a day than in a 20-minute period.
By trading full size over a much larger time frame (my average bread and butter intraday trade lasts less than 30 minutes; this one was a hold for several days), I increased my risk significantly. I felt justified in doing so, because I was confident in the trade idea.
Was I emotionally prepared, however, for a possible 20 point ES futures swing against me? Not at all. Instead of thoroughly thinking through that scenario and making sure I could live with it, I allowed my confidence to blind me to the possibility of being wrong.
And wrong I was. I took my largest loss of the year in a couple of days, erasing the gains of the prior two weeks.
Worse still, the experience left me frustrated and wanting to get back to my high water mark. The next day, eager to get back into the market, I forced myself to sit and watch. When I returned to the market, I limited myself to a single trading setup (a variation of my trusty transition pattern) and my short-term (intraday, under one hour holding time) framework. My trading size was kept moderate, so that potential losses would be entirely manageable.
Within a week, I recouped the loss and returned to my high water mark. I did so by chipping away at the drawdown, focusing only on my highest probability trades. The key was turning the frustration of the bad trade into a doubling-down of my determination to trade well. To accomplish that doubling-down, however, I needed to shift gears emotionally. Hitting the sidelines for a day and lowering my risk per trade were central to that effort. Had I tried to trade while I was hot, using size to recoup my losses all at once, I surely would have dug myself a deep hole.
Even though I've traded since the late 1970s, and even though I'm a psychologist who works with traders and all too familiar with trading pitfalls, I make the same mistakes--and am subject to the same biases and faulty decision making--as everyone else. No psychological techniques eliminate bias and bad trading. The best we can do is learn to shift gears, control risk, stay emotionally intelligent, and play to our strengths. That's what builds a trading job into a long term career.
.
Weekend Views: Volume One
* Traders often don't succeed, because their processing of market information does not play to their strengths;
* A good look at the dollar carry trade;
* The correlation between equities and gold and other good reading;
* Interview with Jim Rogers on his success; see also this post on the dynamics of success;
* How much has stimulus helped the economy?
* Signs of risk aversion at the short end of the Treasury curve;
* Is the business model for broadcasting broken?
* Hysteria over government debt and its consequences.
.
Friday, November 20, 2009
Handling the Stress of Trading
One of the most common questions I get from traders is how to deal with the stress of work. Here are some posts that might get you started; I'll follow up with a post on the topic this weekend:
.
.
Two Reasons I Like Volume Bars in Market Charts

Here is the day's trade in the ES futures, with each bar representing 50,000 contracts traded. I find this to be a useful perspective on markets for several reasons:
1) The bars draw faster in busy market periods and slower in low volume periods. Because I look for trade ideas by comparing successive bars on the chart, this has the natural effect of slowing me down when markets are thin and keeping me involved when markets are moving.
2) The bars separate the effects of volume on volatility. Because each bar represents the same volume traded, we can see markets gain and lose volatility through the day and readily identify when volatility is correlated with market direction. I'll post more on this topic later; it's quite important.
In general, I find it helpful to view charts in different ways over different time periods. Many times, a hypothesis will jump out from one perspective that could not be seen with a different view. The idea is to stay fertile and flexible in thinking and adapt to shifting market conditions.
.
Midday Briefing for November 20th: Range Trading Near the Lows

Here's an update to this morning's chart. You can see that we've neither taken out the overnight lows nor sustained an upmove into yesterday's range. Rather, we're trading within the overnight range as trade slows down ahead of a holiday. A nice tell that we'd have trouble sustaining the downside has been firmness of major currencies against USD and firmness among commodities. Once again, this appears to be a stock market correction, but not necessarily a revaluation of risk assets more broadly.
.
Morning Briefing for November 20th: Watching Price Levels


In overnight trade we've broken below yesterday's lows in both the ES (top chart) and euro (bottom chart) futures. In a valid breakout, we should not re-enter the prior trading range with any meaningful volume. This morning, I'm watching to see if yesterday's support becomes resistance for today's trade. Thus far, as I write, we are back in yesterday's range in ES, but not in the euro. Failure to sustain trade below yesterday's ES low around 1086 would target yesterday's pivot level (see recent Twitter post for pivot and other price targets) to the upside.
.
Simulation and Making Sound Trading Decisions

My recent post described how traders can use information within the bars of Market Delta footprint charts to make short-term trading decisions. I notice that the newest version of Market Delta supports trade entry and management from the chart itself; it also includes a simulation module that enables traders to practice making trading decisions from the chart data.
Let's go back to the chart from yesterday morning's post. If you look at the last three bars of that chart, you'll see that we've consolidated in a tightening range after having moved steadily lower through the early morning hours. Your job as a short-term trader would be to profit from a break out of that several hour range. You would begin with a bigger picture view: How is the morning trade comparing with the trade from the prior day?
You would see that we've broken below two-day support and are now hovering near Monday's day session lows. You'd also see, within the morning session, that the volume-weighted average price (VWAP) is moving steadily lower and that we are building value steadily lower (side histogram). That tells us that, on the chart's timeframe, we're looking at a downtrend--but that it is also the start of a potential breakout move and longer-timeframe downtrend.
Now we look within the bars. Note at the top of each of the three most recent bars how trade has shut off as we've approached the 1100 level. Note also how trade has shut down around the 1098 level. At the time of the chart snap shot, we were trading at 1099.75. If you did not see volume building and lifting offers at 1099.75 and above, what would your trading decision be? Clearly, you'd be a seller, expecting at least a rotation back down to the 1098 level.
If volume dried up as you approached 1098, what might you think of doing? If you saw volume accelerate as you approached 1098, what would you want to do? The information within the bar would be key to deciding whether to fold the trade or hold (and maybe add to) it. Such decisions are based on real demand and supply data provided by the marketplace; not by untested assumptions regarding chart patterns or mystical numerological sequences. All those decisions can be practiced in simulation mode, scanning incoming data, processing the data, pausing the flow of volume, and rehearsing your reasoning.
One value of simulation is ensuring that decision making is coming from the executive centers of the brain; see the link below.
But, of course, there is more that goes into making good trading decisions. We'll take a look at some of those elements in the next posts in this series.
.
Subscribe to:
Posts (Atom)


