
A recent pilot study addresses the interesting topic of how a trader's personality affects his or her trading performance. The researchers focused on six personality traits and their impact upon trading:
* Locus of control - The degree to which a trader believes that the ability to be successful is within his or her control;
* Maximizing tendency - The degree to which individuals seek optimum outcomes from their decisions, not just outcomes that meet or exceed expectations;
* Regret susceptibility - The tendency to look back on outcomes of decisions and focus on negative aspects, creating regret;
* Self-monitoring - People's tendency to track and control their own thoughts, feelings, and behaviors;
* Sensation seeking - The degree to which people seek varied and stimulating experience;
* Type A behavior - The degree to which individuals are driven to achieve.
The researchers set up a simulated trading exercise with real money payouts. Because data from only 32 subjects were collected, results must be considered preliminary.
Examining the personality profiles of the participants, the researchers found that the first two traits--locus of control and maximizing tendency--were not related to trading performance. Among the remaining traits, three clusters or personality types emerged:
1) Relaxed, risk-averse traders who avoid regret, dislike sensation-seeking, and show type-B (non achievement oriented) behavior;
2) Traders who were controlled risk takers: high in both self-monitoring and sensation seeking;
3) Achievement-driven traders who showed high Type-A personality traits.
Of the three groups, number three performed the worst. These highly competitive traders were also the most impatient in their decision making, reducing their effectiveness. The first two groups performed similarly--no significant difference. What this suggests is that a relaxed attitude toward performance may be more helpful than a driven one: the highly achievement-driven trader may create his or her own internal noise, interfering with sound decision-making.
Although this is a small study and needs to be followed up with more extensive work, the findings are consistent with other research related to personality and trading performance. In my own study with Andrew Lo and Dmitry Repin of M.I.T., we found that highly emotional reactions to trading outcomes--positive *and* negative--are associated with worse trading performance. The highly driven trader may generate more positive and negative emotional experiences in his or her approach to trading, interfering with clear, calm decisions under conditions of risk and uncertainty. This would fit with research mentioned in my Psychology of Trading book (p. 276), which links stimulation-seeking to high states of emotional arousal. (One of the rationales for the Philip Glass techniques mentioned in that book is the creation of internal states in which stimulation--and hence arousal--are reduced).
The conundrum is that successful traders do tend to be an aggressive, achievement-oriented lot. Up to a certain point, that Type-A tendency works for them, especially if they are able to combine self-monitoring and self-control (the personality trait of conscientiousness) with the desire to take risks. At very high levels of aggressiveness and need-for-achievement, however, the frustrations inherent in working in a setting of high uncertainty may prove overwhelming. I would expect that highly achievement-oriented traders who also have a strong tendency toward negative emotional experience (guilt, anger, depression, anxiety) might experience the worst trading outcomes of all.
The interesting finding of the pilot research summarized above is that group one--the relaxed, risk-averse traders--performed as well as the conscientious risk takers. It may well be the case that clarity of mind--not personality per se--is the most important psychological determinant of good decision making and trading profitability.
Friday, January 19, 2007
Thursday, January 18, 2007
Thursday, January 18th: Morning Comments
10:09 AM CT - We continue to see a positive shift in the TICK. Volume is above average for this time of day, so I expect decent movement. Remember that we have Philly Fed coming up at 11 AM CT. I like to cement a lesson from each trading day. Perhaps the takeaway for today is that 85% of all days in ES are *not* inside days. That ratio is well over 90% when we have above avg volume. Once you know that, it's a matter of handicapping the odds of taking out either the prior day's high or low. Once we saw selling in those leading sectors and breaks to new lows, and once the TICK turned down and we got sellers hitting bids in size, we had a nice trade in ES toward Wednesday's lows and S2. Once selling began drying up in ER2, we saw a shift in the TICK and bounces in the other averages. As I write, we're getting fresh buying (lifting of offers), supporting the bottoming process mentioned earlier. Update tonite on the Weblog. Have a great day.
9:42 AM CT - Got a conference call with a trading firm coming up; gotta scoot. I'll post a summary after I'm off that call. I'm watching for a sign of an upward shift in the TICK distribution that would correspond with putting in a bottom in the recent area of lows. Also watching ER2 closely for indication of that.
9:32 AM CT - Notice how we got lows in ES at 9:16 AM, but Russells held up above their recent lows. Whenever I see a divergence like that, I like to take profits. If there are multiple divergences, I might even consider a short-covering, short-term trade. Anyway, we broke the previous day's lows and all 3 averages are in sync to the downside. We need to stay below the recent trading range in ES to sustain that downside trend. In general, absent a shift toward buying in the TICK and ES volume distribution, that means I'd be looking to sell rallies for tests of recent lows.
9:12 AM CT - Note how volume really picked up on that decline with large traders hitting bids. Very often, after a first bounce from such a high momentum decline, the lows will be subsequently tested. I'm watching those weak sectors ER2 and Semis carefully; if they start showing relative strength, I'd be careful chasing the downside.
9:06 AM CT - Nice illustration here how looking at leading sectors (Russell, Semis) identified early selling, taking us toward a test of the prior day's lows in ES. Also shows how important flexible thinking is. I went into the session looking for the possibility of holding above the preopen lows, which we had rejected. When ER2 flew through those lows, my outlook changed; then NQ broke the lows; that made ES a pretty easy short.
8:41 AM CT - Weakness in semiconductors and Russell has me leaning to the sell side, but so far this is like yesterday AM, with absence of buyers but so far no major selling in the TICK. That created range bound conditions yesterday. Under those conditions it makes sense to not get caught in the middle of the range, but to wait for failed moves or breakouts at range extremes.
8:31 AM CT - Keep an eye on Russell. Weak out of the gate.
8:25 AM CT - Note that we got initial selling in the equity indices on the release of CPI and housing data, but quickly bounced back from the 1437.75 low. What that tells us is that market participants rejected value at that level (which, BTW, is above Wednesday's lows). Recall that value is defined as the region in which the lion's share of volume trades. If we break below that pre-opening low, especially on increased selling volume, that tells us that market participants are repricing equities and re-evaluating value. On the other hand, if we get selling early in the AM and stay above the pre-opening low, then it suggests we may be setting value today higher than Wednesday, which should lead us to take out S1 and Wednesday's highs, with a shot at S2 (those levels are updated daily on the Weblog). I will be watching carefully for the early balance of buying and selling and will be a buyer if we can hold those preopening lows. I'm noting that interest rates have backed off and the dollar has sold off in the last few minutes; overall, we're not getting any fundamental revaluations in those assets due to the CPI, unemployment, and housing data. That once again has me questioning whether we'll see a major revaluation in stocks. Back after the open.
8:10 AM CT - Well, today is a big day for economic releases, but if you were looking for numbers to break us out of the recent trading range in the large caps (Dow, ES), so far that hasn't happened. Core CPI came in a bit higher than expected and, as a result, we're seeing yet further rises in interest rates, with the 10-year approaching 4.82% before backing off a bit. The dollar also strengthened vs. the Euro, but has since given up some of those gains. Still, we're seeing strength in the ES, NQ, and ER2 prior to the open and, if we can hold above Wednesday lows, I'd expect a test of the bull highs in the large cap indices. (See the Weblog for my complete trading outlook and pivot numbers for the day). Note that we'll still have further reports coming out: crude inventories at 9:30 AM CT and the Philly Fed at 11:00 AM CT. If you look at the ES vs. ER2 and NQ, you'll see that any new highs in ES are likely to be accompanied by divergences in the other averages. I will need to see an expansion of volume and strong lifting of offers/strong NYSE TICK on any breakout move to chase highs; until the market shows me otherwise, I see this as a topping market in which momentum and participation have been waning. Back after the open.
9:42 AM CT - Got a conference call with a trading firm coming up; gotta scoot. I'll post a summary after I'm off that call. I'm watching for a sign of an upward shift in the TICK distribution that would correspond with putting in a bottom in the recent area of lows. Also watching ER2 closely for indication of that.
9:32 AM CT - Notice how we got lows in ES at 9:16 AM, but Russells held up above their recent lows. Whenever I see a divergence like that, I like to take profits. If there are multiple divergences, I might even consider a short-covering, short-term trade. Anyway, we broke the previous day's lows and all 3 averages are in sync to the downside. We need to stay below the recent trading range in ES to sustain that downside trend. In general, absent a shift toward buying in the TICK and ES volume distribution, that means I'd be looking to sell rallies for tests of recent lows.
9:12 AM CT - Note how volume really picked up on that decline with large traders hitting bids. Very often, after a first bounce from such a high momentum decline, the lows will be subsequently tested. I'm watching those weak sectors ER2 and Semis carefully; if they start showing relative strength, I'd be careful chasing the downside.
9:06 AM CT - Nice illustration here how looking at leading sectors (Russell, Semis) identified early selling, taking us toward a test of the prior day's lows in ES. Also shows how important flexible thinking is. I went into the session looking for the possibility of holding above the preopen lows, which we had rejected. When ER2 flew through those lows, my outlook changed; then NQ broke the lows; that made ES a pretty easy short.
8:41 AM CT - Weakness in semiconductors and Russell has me leaning to the sell side, but so far this is like yesterday AM, with absence of buyers but so far no major selling in the TICK. That created range bound conditions yesterday. Under those conditions it makes sense to not get caught in the middle of the range, but to wait for failed moves or breakouts at range extremes.
8:31 AM CT - Keep an eye on Russell. Weak out of the gate.
8:25 AM CT - Note that we got initial selling in the equity indices on the release of CPI and housing data, but quickly bounced back from the 1437.75 low. What that tells us is that market participants rejected value at that level (which, BTW, is above Wednesday's lows). Recall that value is defined as the region in which the lion's share of volume trades. If we break below that pre-opening low, especially on increased selling volume, that tells us that market participants are repricing equities and re-evaluating value. On the other hand, if we get selling early in the AM and stay above the pre-opening low, then it suggests we may be setting value today higher than Wednesday, which should lead us to take out S1 and Wednesday's highs, with a shot at S2 (those levels are updated daily on the Weblog). I will be watching carefully for the early balance of buying and selling and will be a buyer if we can hold those preopening lows. I'm noting that interest rates have backed off and the dollar has sold off in the last few minutes; overall, we're not getting any fundamental revaluations in those assets due to the CPI, unemployment, and housing data. That once again has me questioning whether we'll see a major revaluation in stocks. Back after the open.
8:10 AM CT - Well, today is a big day for economic releases, but if you were looking for numbers to break us out of the recent trading range in the large caps (Dow, ES), so far that hasn't happened. Core CPI came in a bit higher than expected and, as a result, we're seeing yet further rises in interest rates, with the 10-year approaching 4.82% before backing off a bit. The dollar also strengthened vs. the Euro, but has since given up some of those gains. Still, we're seeing strength in the ES, NQ, and ER2 prior to the open and, if we can hold above Wednesday lows, I'd expect a test of the bull highs in the large cap indices. (See the Weblog for my complete trading outlook and pivot numbers for the day). Note that we'll still have further reports coming out: crude inventories at 9:30 AM CT and the Philly Fed at 11:00 AM CT. If you look at the ES vs. ER2 and NQ, you'll see that any new highs in ES are likely to be accompanied by divergences in the other averages. I will need to see an expansion of volume and strong lifting of offers/strong NYSE TICK on any breakout move to chase highs; until the market shows me otherwise, I see this as a topping market in which momentum and participation have been waning. Back after the open.


PBW: Clean Energy as a Sentiment Gauge
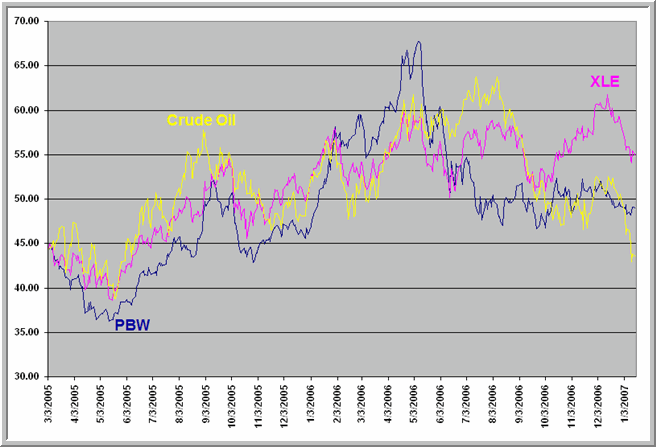 Back in November, I took a look at PBW, the clean energy ETF from PowerShares that tracks the WilderHill Clean Energy Portfolio. The fund holds positions in a variety of firms that are involved in alternative energy plays, from solar to fuel cell to wind. Above we can see how PBW has traded relative to energy firms (the XLE ETF) and to cash West Texas Intermediate crude oil itself. I have equalized the prices as of the start of March, 2005 to illustrate the different paths each has taken.
While PBW may represent alternative energy, it is not a complete alternative as an investment vehicle. Since 2005, daily price changes in PBW have correlated .61 with the S&P 500 Index (SPY) and .53 with the XLE energy stocks, but only .16 with WTI crude. In other words, PBW seems to be more influenced by movements in the stock market than those in the crude oil markets.
A look at the chart, however, suggests an interesting relationship among these three. During the runup in crude oil prices, PBW sharply outperformed XLE, reflecting concerns over rising energy costs in the wake of expanding consumption among emerging nations. Indeed, PBW has traded very similarly to the emerging markets, with a speculative runup in the March-May, 2006 period and sharp decline thereafter. Unlike the emerging markets, however, PBW has not bounced since that decline. With the recent drop in crude oil, PBW has markedly underperformed XLE, suggesting a waning concern with energy alternatives.
In other words, in the relationship betweeen PBW and XLE we may have a nice sentiment gauge regarding worry over the price levels in the energy market and investors' speculative appetites. As an alternative investment, PBW is, by its very nature, a speculative vehicle. When investors are complacent about energy and favoring value/large caps over growth/smaller caps, we would expect PBW to not attract a great deal of interest. Conversely, when energy prices are soaring and money is flowing into small caps and emerging markets, investors would be likely to turn to PBW as an attractive theme. Within a "normal" level of crude oil prices, daily variations in crude would not greatly affect PBW. Once crude oil hits a pain threshold, however, we would expect enhanced interest in PBW, especially in a high liquidity environment that encourages speculation.
Clearly, that pain has been missing in the past several months. Absent political initiatives that would alter the fundamentals of the alternative energy sectors, it looks as though it may take a Pickens-esque scenario of $70+ crude to keep PBW on investors' radar.
Wednesday, January 17, 2007
Wednesday, January 17th: Morning Comments
10:04 AM CT - Volume has tailed off considerably, providing little follow through to moves. Meanwhile, we're operating with a bit less than a 5 pt range since the open in ES. Once again, the big takeaway is to understand as early in trading as possible what kind of market you're in and how much opportunity there is likely to be. When buying and selling pressure are moderate and volume is low, we tend to get this slow rangebound action. We're seeing a bit of life in the ER2 and NYSE TICK and I'd be watching for that TICK distribution to shift positively if we get higher TICK lows on pullbacks. Hope you have a great rest of your trading day; summary this evening on the Weblog.
9:37 AM CT - The TICK distribution--and especially the Dow TICK distribution--have turned downward and that's brought us back toward the S1 level. I see this more as a relative absence of buyers than presence of large sellers and, unless volume picks up, I don't expect a big day here. Very rangebound and choppy action; not a lot of direction or edge from institutions. I'm content to leave this kind of market to its own devices and not overtrade and get chopped up. I'll post at least one more time before calling it a morning.
9:12 AM CT - Got some selling when ES couldn't hold that pivot level, but overall the selling is not convincing, esp. in the large caps. We're seeing a bit more volume at offer than bid, but nothing to suggest solid buying by large participants. I'm content to be on the sidelines here; it is one of those morning periods where I'm not seeing a lot of edge or conviction in the market. Advancing and declining stocks about even so far. Very mixed early AM.
8:45 AM CT - Volume is moderate; not impressive, but the main thing is that there is very little follow through selling so far either in the TICK or in the volume at bid vs. offer in the ES. That has kept me on the sidelines, although if I get a sense that buying can't keep us above that VWAP/pivot level, I'll probably be short ES.
8:15 AM CT - The PPI came in a notch higher than expected, sending interest rates a bit higher and leading to selling in the stock index futures. The Weblog pretty much sums up my early AM strategy and gives the day's pivots that I'm following. Given the inability of the indices to hold above their Tuesday lows and the mediocre performance of the market following narrow range days (per my recent post), I'm looking to S1 and S2 as potential price targets early in trading, particularly if early bounces in the TICK cannot sustain a move above the VWAP/pivot level. Note the long-term trading range in the ER2 futures, going back to mid-November. We're heading toward the midpoint of that range, given the recent inability to make new highs. I'll be watching volume levels closely on early weakness to see if we get fresh supply hitting the market. We're not seeing a fundamental repricing of fixed income or currencies in the wake of the PPI number, which leads me to question whether we'll see a major shift in stocks. Back after the open.
9:37 AM CT - The TICK distribution--and especially the Dow TICK distribution--have turned downward and that's brought us back toward the S1 level. I see this more as a relative absence of buyers than presence of large sellers and, unless volume picks up, I don't expect a big day here. Very rangebound and choppy action; not a lot of direction or edge from institutions. I'm content to leave this kind of market to its own devices and not overtrade and get chopped up. I'll post at least one more time before calling it a morning.
9:12 AM CT - Got some selling when ES couldn't hold that pivot level, but overall the selling is not convincing, esp. in the large caps. We're seeing a bit more volume at offer than bid, but nothing to suggest solid buying by large participants. I'm content to be on the sidelines here; it is one of those morning periods where I'm not seeing a lot of edge or conviction in the market. Advancing and declining stocks about even so far. Very mixed early AM.
8:45 AM CT - Volume is moderate; not impressive, but the main thing is that there is very little follow through selling so far either in the TICK or in the volume at bid vs. offer in the ES. That has kept me on the sidelines, although if I get a sense that buying can't keep us above that VWAP/pivot level, I'll probably be short ES.
8:15 AM CT - The PPI came in a notch higher than expected, sending interest rates a bit higher and leading to selling in the stock index futures. The Weblog pretty much sums up my early AM strategy and gives the day's pivots that I'm following. Given the inability of the indices to hold above their Tuesday lows and the mediocre performance of the market following narrow range days (per my recent post), I'm looking to S1 and S2 as potential price targets early in trading, particularly if early bounces in the TICK cannot sustain a move above the VWAP/pivot level. Note the long-term trading range in the ER2 futures, going back to mid-November. We're heading toward the midpoint of that range, given the recent inability to make new highs. I'll be watching volume levels closely on early weakness to see if we get fresh supply hitting the market. We're not seeing a fundamental repricing of fixed income or currencies in the wake of the PPI number, which leads me to question whether we'll see a major shift in stocks. Back after the open.
Narrow Range Days: What Comes Next?
A while back, I mentioned that I use a measure called the relative range to assess the market's daily volatility. The relative range represents the current day's high-low range relative to the average high-low range for the prior 20 trading sessions. In general, when we've had large declines on expanded relative ranges, we've seen bullish market behavior going forward. On Tuesday, however, we saw a particularly narrow range day in the S&P 500 Index (SPY), with a relative range of about 64% (Tuesday's range was 64% of the prior 20-day's average range). Moreover, Tuesday's was the narrowest range in the past five trading sessions.
Going back to 2004 (N = 759 trading sessions), we've had 152 NR5 days: days in which the current range was the narrowest in the last five trading sessions. When the NR5 days also were days in which the relative range was below 70% (N = 102), the next day in SPY averaged a loss of -.11% (46 up, 56 down). Conversely, when the NR5 day was a day with a relative range of 70% or greater (N = 50), the next day in SPY averaged a gain of .17% (29 up, 21 down). Overall, for the entire sample, the one-day average price change in SPY has been .03% (415 up, 344 down). Narrow ranges with respect to the past five and twenty trading sessions have been associated with subnormal near-term returns.
In general, returns after low relative range days have not been impressive. Since 2004, we've had 187 occasions in which the relative range has been below 70%. The next day in SPY has averaged a loss of -.03% (92 up, 95 down). For the remainder of the sample, the next day in SPY has averaged a gain of .06% (323 up, 249 down). When we've had a small relative range and SPY has been down for the day (N = 65)--as was the case Tuesday--the next day in SPY has averaged a loss of -.06% (28 up, 37 down).
These numbers are not so dramatic as to suggest selling on narrow ranges, but they certainly show that there is no bullish edge to a narrow day in the S&P 500 Index. Pretty consistently, narrow days have yielded below average returns in the short run since 2004.
Going back to 2004 (N = 759 trading sessions), we've had 152 NR5 days: days in which the current range was the narrowest in the last five trading sessions. When the NR5 days also were days in which the relative range was below 70% (N = 102), the next day in SPY averaged a loss of -.11% (46 up, 56 down). Conversely, when the NR5 day was a day with a relative range of 70% or greater (N = 50), the next day in SPY averaged a gain of .17% (29 up, 21 down). Overall, for the entire sample, the one-day average price change in SPY has been .03% (415 up, 344 down). Narrow ranges with respect to the past five and twenty trading sessions have been associated with subnormal near-term returns.
In general, returns after low relative range days have not been impressive. Since 2004, we've had 187 occasions in which the relative range has been below 70%. The next day in SPY has averaged a loss of -.03% (92 up, 95 down). For the remainder of the sample, the next day in SPY has averaged a gain of .06% (323 up, 249 down). When we've had a small relative range and SPY has been down for the day (N = 65)--as was the case Tuesday--the next day in SPY has averaged a loss of -.06% (28 up, 37 down).
These numbers are not so dramatic as to suggest selling on narrow ranges, but they certainly show that there is no bullish edge to a narrow day in the S&P 500 Index. Pretty consistently, narrow days have yielded below average returns in the short run since 2004.
Tuesday, January 16, 2007
Tuesday, January 16th: Morning Comments
12:09 PM CT - Finally got back from my meeting and wanted to wrap up with a few concluding ideas. We started the morning by noting that the market had been strong during the holiday hours on Monday, but retraced much of this gain in the premarket trade on Tuesday. We got some solid buying (NYSE TICK) in very early trade, but none of the major averages were able to sustain a move above those preopening highs. Meanwhile we saw selling in the semiconductors, often a leading sector, and volume was mediocre compared to average volume for that time of day. What that suggested was that we weren't likely to take out the R1 level around 1445 and instead were likely to retest the market pivot from Friday of 1436. Because volume has remained tepid, I am not counting on a move to the S1 and S2 levels. Notice that measures such as TICK and volume at bid/offer tell us about supply and demand, but volume levels relative to average for the time of day tell us about volatility: how much movement we can expect from given supply or demand. Because we don't have strong buying or selling in the TICK (the Adjusted TICK is negative on the day, but not at extreme levels) and we don't have above average volume, I don't expect a large move on the day and, indeed, anticipate more of a rangebound market. The key is monitoring these variables in real time to identify as early as possible what type of market we're likely to be in and which price levels we're likely to hit. Hope that's helpful in structuring your thinking and trading. Have a great one. I'll summarize the market stats and strategy for Wednesday tonite on the Weblog.
9:05 AM CT - Notice how the semiconductor weakness nicely tipped us off to the pull back in ER2, making a nice trade. Volume did not expand as we got buying in the TICK and we could not surmount the Monday highs. So that led me to fade strength, with the overnite highs a logical stop. Unfortunately, I've just been called away to a meeting so will have to end the AM comments. We'll need to see fresh strength to be buyers in the market. Otherwise, I'm sticking with the scenario of pull back toward the Friday pivot midpt. Have a great day.
8:52 AM CT - Watching here to see if buying wanes after the pullback in the TICK; small short position in ER2. The TICK has been strong; not the Dow TICK. And so far the buying has been unable to breach the preopening highs.
8:40 AM CT - Volume is moderate; not a lot of institutional interest so far. Note some early weakness in semiconductors, which often lead. TICK opens positive, and advancing stocks lead nicely over decliners by over 800 issues as I write. I would not fade the buying interest as long as Russells are showing relative strength, but I'm keeping a close eye on them as the next possible sector to weaken.
8:23 AM CT - Just a little note re: my personal site and how it might be of help for traders. Some of my favorite articles on trading techniques and trading psychology are archived on the Articles page; they're also arranged in chronological order so that it's easy to read the most recent pieces. The Trader Performance page is a weekly blog that is really my personal journal of thoughts regarding ways of improving trading performance. Some of my favorite blogs, sites, and services are linked on the Trader Development page; it's a good start to find sources of information that might help your trading. Finally, the Trading Psychology Weblog digs up interesting blog links from around the Web each day, summarizes indicator data on the recent market, and outlines my basic trading strategy. It's a way to track what I'm looking at prior to each market open. TraderFeed will be summarizing my most recent market research and trading psychology ideas, with morning market updates to help readers track the equity index markets in real time. Taken together, these are, to my knowledge, one of the most extensive free collections of trading and trading psychology resources available on the Web. Another fine collection of free resources can be found on Woodie's site. The idea behind my work (and Woodie's also) is to model different ways of thinking about markets--and thinking about yourself--that will aid your trading performance, so that you can become your own market guru and trading coach. Specific mentorship resources can be found among my Trader Development links. See you after the open.
8:05 AM CT - Good morning. Monday saw abbreviated trading in the stock index futures, with a bit of a continued rise, but we've pulled back in pre-opening trading this morning. See the Monday, Jan. 15th entry of the Weblog for the basic trading strategy and pivot levels I'm looking at. My latest post shows bullish expectations during periods when energy stocks are falling and technology shares are rising, but I'm going to need to see evidence of buying early in trading to enter the long side for a move to the 1445 R1 region, which also happens to be close to the bull market high. If we fail to see that buying materialize, I'll be looking to sell on bounces for a move to the 1436 pivot level. I'm watching 6746 resistance in the DAX (cash), and I'm watching to see if NQ sustains a return to its Friday trading range. As the Weblog noted, Friday's market, despite rising prices, showed a loss of upside momentum relative to Thursday and this is frequently followed by a pullback that creates a trading range. If we move back into Friday's trading range in NQ and ER2, I'll be much more likely to fade bounces in ES early in trade. I'll also watch carefully for any test of the R1 level to see if volume expands by lifting offers or if sellers use the opportunity to take profits. In short, the rally looks a bit tired to me and I'm sensitive to the possibility of pullback to a trading range. As always, mentally playing out the what-if scenarios prior to the open is helpful. Call me a quite cautious bull going into the open. I'll post updates in the early AM when I see important developments.
9:05 AM CT - Notice how the semiconductor weakness nicely tipped us off to the pull back in ER2, making a nice trade. Volume did not expand as we got buying in the TICK and we could not surmount the Monday highs. So that led me to fade strength, with the overnite highs a logical stop. Unfortunately, I've just been called away to a meeting so will have to end the AM comments. We'll need to see fresh strength to be buyers in the market. Otherwise, I'm sticking with the scenario of pull back toward the Friday pivot midpt. Have a great day.
8:52 AM CT - Watching here to see if buying wanes after the pullback in the TICK; small short position in ER2. The TICK has been strong; not the Dow TICK. And so far the buying has been unable to breach the preopening highs.
8:40 AM CT - Volume is moderate; not a lot of institutional interest so far. Note some early weakness in semiconductors, which often lead. TICK opens positive, and advancing stocks lead nicely over decliners by over 800 issues as I write. I would not fade the buying interest as long as Russells are showing relative strength, but I'm keeping a close eye on them as the next possible sector to weaken.
8:23 AM CT - Just a little note re: my personal site and how it might be of help for traders. Some of my favorite articles on trading techniques and trading psychology are archived on the Articles page; they're also arranged in chronological order so that it's easy to read the most recent pieces. The Trader Performance page is a weekly blog that is really my personal journal of thoughts regarding ways of improving trading performance. Some of my favorite blogs, sites, and services are linked on the Trader Development page; it's a good start to find sources of information that might help your trading. Finally, the Trading Psychology Weblog digs up interesting blog links from around the Web each day, summarizes indicator data on the recent market, and outlines my basic trading strategy. It's a way to track what I'm looking at prior to each market open. TraderFeed will be summarizing my most recent market research and trading psychology ideas, with morning market updates to help readers track the equity index markets in real time. Taken together, these are, to my knowledge, one of the most extensive free collections of trading and trading psychology resources available on the Web. Another fine collection of free resources can be found on Woodie's site. The idea behind my work (and Woodie's also) is to model different ways of thinking about markets--and thinking about yourself--that will aid your trading performance, so that you can become your own market guru and trading coach. Specific mentorship resources can be found among my Trader Development links. See you after the open.
8:05 AM CT - Good morning. Monday saw abbreviated trading in the stock index futures, with a bit of a continued rise, but we've pulled back in pre-opening trading this morning. See the Monday, Jan. 15th entry of the Weblog for the basic trading strategy and pivot levels I'm looking at. My latest post shows bullish expectations during periods when energy stocks are falling and technology shares are rising, but I'm going to need to see evidence of buying early in trading to enter the long side for a move to the 1445 R1 region, which also happens to be close to the bull market high. If we fail to see that buying materialize, I'll be looking to sell on bounces for a move to the 1436 pivot level. I'm watching 6746 resistance in the DAX (cash), and I'm watching to see if NQ sustains a return to its Friday trading range. As the Weblog noted, Friday's market, despite rising prices, showed a loss of upside momentum relative to Thursday and this is frequently followed by a pullback that creates a trading range. If we move back into Friday's trading range in NQ and ER2, I'll be much more likely to fade bounces in ES early in trade. I'll also watch carefully for any test of the R1 level to see if volume expands by lifting offers or if sellers use the opportunity to take profits. In short, the rally looks a bit tired to me and I'm sensitive to the possibility of pullback to a trading range. As always, mentally playing out the what-if scenarios prior to the open is helpful. Call me a quite cautious bull going into the open. I'll post updates in the early AM when I see important developments.
XLE and XLK: When Energy and Technology Move in Different Directions
Over the past month, we've seen the energy sector, represented by the XLE Spyder ETF, and the technology sector, represented by the XLK Spyder ETF, move in different directions, with technology strong and energy weak, due to falling oil prices. On the surface, this would seem to be a bullish sign, as money is pouring into growth areas as the costs of energy are declining for businesses and consumers.
Actually, since 2004, the correlation of daily price changes between XLE and XLK has only been .26. XLE is sensitive to oil and other energy futures prices and only correlates .51 with the S&P 500 Index (SPY). XLK trades more like a traditional stock sector and correlates .81 with SPY on a daily basis. Because only about 7% of the variance in daily price movement is shared between XLE and XLK, it is not unusual to find time periods in which--as present--XLK is strong, but XLE is weak.
Since 2004 (N = 743 trading days), we have had 123 occasions in which XLK has been up over a five day period, but XLE has been down. Over the next ten days, SPY has averaged a gain of 1.0% (93 up, 30 down). Across the remainder of the sample, SPY has averaged a ten-day gain of .20% (360 up, 260 down). It thus appears that short-term returns have been superior when money has been flowing into technology and out of energy.
When we look over a 20-day horizon, we see similar results. When XLE has been down over 20 days, but XLK has been up (N = 94), the next 20 days in SPY average a gain of 1.80% (82 up, 12 down), quite a bullish edge. Conversely, for the remainder of the sample, SPY averages a 20-day gain of .46% (397 up, 252 down). Once again, money flowing into tech and out of energy has been quite bullish for the S&P large caps going forward.
My best take on this situation is that the flow of funds within the sectors captures short-term sentiment among portfolio managers. When energy prices are falling, this is deemed positive for the market and--when sentiment is positive--some money leaves the energy sector and seeks a home in more growth-oriented vehicles. When XLE is falling and XLK is rising, market participants are more bullish on growth--and this sentiment appears to carry forward in the short run. That has been a bullish indication for the present market.
Actually, since 2004, the correlation of daily price changes between XLE and XLK has only been .26. XLE is sensitive to oil and other energy futures prices and only correlates .51 with the S&P 500 Index (SPY). XLK trades more like a traditional stock sector and correlates .81 with SPY on a daily basis. Because only about 7% of the variance in daily price movement is shared between XLE and XLK, it is not unusual to find time periods in which--as present--XLK is strong, but XLE is weak.
Since 2004 (N = 743 trading days), we have had 123 occasions in which XLK has been up over a five day period, but XLE has been down. Over the next ten days, SPY has averaged a gain of 1.0% (93 up, 30 down). Across the remainder of the sample, SPY has averaged a ten-day gain of .20% (360 up, 260 down). It thus appears that short-term returns have been superior when money has been flowing into technology and out of energy.
When we look over a 20-day horizon, we see similar results. When XLE has been down over 20 days, but XLK has been up (N = 94), the next 20 days in SPY average a gain of 1.80% (82 up, 12 down), quite a bullish edge. Conversely, for the remainder of the sample, SPY averages a 20-day gain of .46% (397 up, 252 down). Once again, money flowing into tech and out of energy has been quite bullish for the S&P large caps going forward.
My best take on this situation is that the flow of funds within the sectors captures short-term sentiment among portfolio managers. When energy prices are falling, this is deemed positive for the market and--when sentiment is positive--some money leaves the energy sector and seeks a home in more growth-oriented vehicles. When XLE is falling and XLK is rising, market participants are more bullish on growth--and this sentiment appears to carry forward in the short run. That has been a bullish indication for the present market.
Monday, January 15, 2007
Monday, January 15th: Morning Comments
9:15 AM - It's not unusual to see a breakout move begin in one of the more volatile indices before strong buying shows up in the Dow or the S&P 500. I've found that helpful on occasions for timing. I also like to follow the DAX as a potential leader of the S&P 500 early in the AM. Most helpful of all is filtering the Market Delta charts so that they only post trades of a certain size or greater. You then can see how many large traders are in the market and whether they're predominantly buying or selling. That is *very* useful in handicapping the odds of reaching a pivot support or resistance level.
I'll post full morning comments tomorrow, when we get back to regular trading. I'm gradually reshaping my personal site to make it a single-stop resource for preparing for the next day's trading; more on that also in the next posting shortly on the Trader Performance page. Have a great day.
8:57 AM - A little pop here in the Russell futures. All in all, I look for the most volatile market sectors and averages to lead the big caps, so often we can get an early clue as to market strength or weakness by watching the Russells, semiconductors, etc. Doesn't really matter on a day like today with extremely thin holiday trade in the futures, but is a worthwhile guide in the opening minutes of trade on normal trading days. The other thing I like to keep an eye on is the overnight range. When we break above or below that range early in trading, that represents fresh demand or supply. The question is then whether or not we can *sustain* that demand or supply. If we see volume pick up as we break above or below the overnight range, we then can look to our previous day's highs/lows and pivot-based resistance/support for next targets. It's a very structured way of thinking about market movement. Wrap up in a few...
8:40 AM - With stocks not trading and futures closing early, we aren't likely to have much happening. I won't be trading until Tuesday. But the break gives me a chance to elaborate on a few things. Incidentally, I just got an email from an excellent system developer who took the pivot idea and turned it into a mechanical system that backtests very profitably (and statistically significantly) without curve-fitting. I don't expect him to be giving his system away, but you can learn a ton from his site. A natural extension of the pivot research would be to the NASDAQ and Russell stock indices, but I think it would be fascinating to apply it to individual stocks as well. More on that topic shortly on the Trader Performance page of my personal site. More in a few...
8:23 AM - Holiday trading today, so my comments will likely be abbreviated. The lower the volume, the more likely the trade is to be range bound. It can also be quite jerky, as locals load the book up with impunity, knowing they won't get their resting orders grabbed by paper. When they pulling those orders from the book and start buying or selling, it can create rapid moves of several ticks, scaring traders out of their positions. Not my favorite trading environment. In any event, note that the Weblog is now posting pivot levels for the day; I've also posted a new article on using pivots and previous day's high/low/VWAP as profit targets. We have overnight support at 1440.5 and have been trading above Friday's high. Interestingly, the bull high of 1445 is also very close to our R1 pivot. That's a natural target if we see signs of early buying. The overnight support and then Friday pivot represent downside targets is we get early selling. As my Weblog commentary noted, I am going to be careful chasing highs if we don't have broad participation in early strength, given some loss of momentum on Friday.
I'll post full morning comments tomorrow, when we get back to regular trading. I'm gradually reshaping my personal site to make it a single-stop resource for preparing for the next day's trading; more on that also in the next posting shortly on the Trader Performance page. Have a great day.
8:57 AM - A little pop here in the Russell futures. All in all, I look for the most volatile market sectors and averages to lead the big caps, so often we can get an early clue as to market strength or weakness by watching the Russells, semiconductors, etc. Doesn't really matter on a day like today with extremely thin holiday trade in the futures, but is a worthwhile guide in the opening minutes of trade on normal trading days. The other thing I like to keep an eye on is the overnight range. When we break above or below that range early in trading, that represents fresh demand or supply. The question is then whether or not we can *sustain* that demand or supply. If we see volume pick up as we break above or below the overnight range, we then can look to our previous day's highs/lows and pivot-based resistance/support for next targets. It's a very structured way of thinking about market movement. Wrap up in a few...
8:40 AM - With stocks not trading and futures closing early, we aren't likely to have much happening. I won't be trading until Tuesday. But the break gives me a chance to elaborate on a few things. Incidentally, I just got an email from an excellent system developer who took the pivot idea and turned it into a mechanical system that backtests very profitably (and statistically significantly) without curve-fitting. I don't expect him to be giving his system away, but you can learn a ton from his site. A natural extension of the pivot research would be to the NASDAQ and Russell stock indices, but I think it would be fascinating to apply it to individual stocks as well. More on that topic shortly on the Trader Performance page of my personal site. More in a few...
8:23 AM - Holiday trading today, so my comments will likely be abbreviated. The lower the volume, the more likely the trade is to be range bound. It can also be quite jerky, as locals load the book up with impunity, knowing they won't get their resting orders grabbed by paper. When they pulling those orders from the book and start buying or selling, it can create rapid moves of several ticks, scaring traders out of their positions. Not my favorite trading environment. In any event, note that the Weblog is now posting pivot levels for the day; I've also posted a new article on using pivots and previous day's high/low/VWAP as profit targets. We have overnight support at 1440.5 and have been trading above Friday's high. Interestingly, the bull high of 1445 is also very close to our R1 pivot. That's a natural target if we see signs of early buying. The overnight support and then Friday pivot represent downside targets is we get early selling. As my Weblog commentary noted, I am going to be careful chasing highs if we don't have broad participation in early strength, given some loss of momentum on Friday.
Price Targets for Short-Term Trades
My recent post explained how to measure pivot points and utilize these as intraday price targets. Response to that post was very positive, so I have begun to summarize pivot levels for the ES futures on the Weblog. If there is interest in having me post pivots for the NASDAQ and Russell futures or ETFs, just let me know.
My two most common sets of price targets are:
1) The previous day's highs, lows, and volume-weighted average price (VWAP);
2) The R1, S1, and pivot levels from the previous day's data.
Volume-weighted average price and the day's pivot are also published daily on the Weblog. The VWAP is the average trading price for the day weighted by the number of contracts trading at each price. The day's pivot is simply the average of the high, low, and closing prices.
Early in the session, I am using data such as the NYSE TICK, distribution of volume at the bid vs. offer, total volume traded relative to the usual volume at that time of day, advancing vs. declining stocks, and the relative movements of various sectors to anticipate market direction and volatility.
If direction is mixed and volatility is average or below, I will expect a range bound market and look to fade moves at the range extremes back toward the VWAP and day's pivot.
If direction is strong and volatility is average or below, I will expect a test of the previous day's high/low and a test of R1/S1.
If direction is strong and volatility is above average, I will expect a test of R2/S2.
The key is making updated assessments as the market is trading relative to direction and volatility.
Most days, I am looking for tests of the previous day's high/low and tests of R1/S1. Going back to 2004 in the S&P 500 Index (SPY; N = 762 trading days), 660 of those sessions have either surpassed the previous day's high *or* the previous day's low. In other words, about 87% of market days are *not* inside days. The 13% of days that are inside days are almost always low volume days. If we see average or greater volume for the day, the odds are overwhelming that we'll take out at least one of the previous day's extremes.
Similarly, 611 out of the 762 days--about 80%--have surpassed either R1 *or* S1. Once again, this ratio is even higher on above-average volume days. This makes R1/S1 and the previous day's high/low very reliable targets if you can get an early read on direction and volatility.
Of course, if you can identify some historical patterns associated with market direction--one of the goals of this blog--that helps even more in terms of getting on board early with a move to one of the high-odds price levels.
Note that this way of looking at markets can supplement almost any pre-existing trading approach. It is a way to focus on exits and targets, not just entries. The clearer you are about your targets, the easier it will be to ride your profitable positions.
My two most common sets of price targets are:
1) The previous day's highs, lows, and volume-weighted average price (VWAP);
2) The R1, S1, and pivot levels from the previous day's data.
Volume-weighted average price and the day's pivot are also published daily on the Weblog. The VWAP is the average trading price for the day weighted by the number of contracts trading at each price. The day's pivot is simply the average of the high, low, and closing prices.
Early in the session, I am using data such as the NYSE TICK, distribution of volume at the bid vs. offer, total volume traded relative to the usual volume at that time of day, advancing vs. declining stocks, and the relative movements of various sectors to anticipate market direction and volatility.
If direction is mixed and volatility is average or below, I will expect a range bound market and look to fade moves at the range extremes back toward the VWAP and day's pivot.
If direction is strong and volatility is average or below, I will expect a test of the previous day's high/low and a test of R1/S1.
If direction is strong and volatility is above average, I will expect a test of R2/S2.
The key is making updated assessments as the market is trading relative to direction and volatility.
Most days, I am looking for tests of the previous day's high/low and tests of R1/S1. Going back to 2004 in the S&P 500 Index (SPY; N = 762 trading days), 660 of those sessions have either surpassed the previous day's high *or* the previous day's low. In other words, about 87% of market days are *not* inside days. The 13% of days that are inside days are almost always low volume days. If we see average or greater volume for the day, the odds are overwhelming that we'll take out at least one of the previous day's extremes.
Similarly, 611 out of the 762 days--about 80%--have surpassed either R1 *or* S1. Once again, this ratio is even higher on above-average volume days. This makes R1/S1 and the previous day's high/low very reliable targets if you can get an early read on direction and volatility.
Of course, if you can identify some historical patterns associated with market direction--one of the goals of this blog--that helps even more in terms of getting on board early with a move to one of the high-odds price levels.
Note that this way of looking at markets can supplement almost any pre-existing trading approach. It is a way to focus on exits and targets, not just entries. The clearer you are about your targets, the easier it will be to ride your profitable positions.
Sunday, January 14, 2007
Letting Profits Run: A Guide to Becoming Your Own Trading Coach
My most recent post emphasized many of the basics that enable people to become their own trading coaches. For this last post in the series, let's apply those basics to one of the most common trading problems that people describe to me: the difficulty of letting profits run.
From the previous post, it should be clear why this is such a difficulty: We set our profit targets and trade strategy while we are in one state of mind but then, as the trade progresses, we enter an entirely new state. That new state very often involves worried thoughts about losing unrealized profits or having gains turn into losses. It generally brings an elevated heart rate, increased muscle tension, and more rapid and shallow breathing. As we become aware of the nervous feelings, that helps to perpetuate the negative thoughts and altered physical state, which in turn can amplify the anxiety. Very often, cutting positions short before profits can run is simply a coping device to manage this anxious state. We exit the position for emotional relief, not for reasons of sound strategy and money management.
The solution focused approach calls on us to review those occasions in which we have been able, in some measure, to let profits run--even just a bit. What did we do differently on those occasions? Those exceptions from our problem patterns are what we have to build upon: they are our potential solutions.
In my case as a trader, there are several things I've done differently when I've been successful in letting profits run:
* I have planned the trade well in advance with research; it is not a spontaneous trade, so I've had time to think clearly about what I want to do.
* I have a clear profit target in mind based on research and refuse to waver from that target unless the market takes me out with a predefined stop. I consider myself a person of integrity, so I tell myself that I have to show integrity and loyalty to my trade idea and target;
* I don't follow the position tick for tick. Either the trade will hit my target or it will hit my stop. I make a conscious effort to let go and not micromanage the trade;
* I keep myself calm and clearly focused by purposely getting up from my chair, doing some stretches, breathing deeply, and getting away from the screen. I keep myself in a state that is incompatible with anxiety;
* I rehearse constructive self-talk during the trade. I tell myself that I've done my preparation and established my edge. Any individual trade can go against me, but if I take all the good trades I can, eventually I'll benefit from good odds and a good risk-reward ratio. If I lose money on the trade, I'll figure out why and what that might be telling me about the current market.
All of these steps, taken together, form a template for how I manage to hold onto positions to maximize profits. Now the key is to turn this template into a habit pattern. I want it to become automatic--an internalized part of me.
To accomplish this, I wear my heart monitor and go out for a morning jog prior to the market open. I use the monitor to ensure that I maintain an elevated heart rate and a good jogging pace. While I'm running, I'm mentally rehearsing each aspect of my template. I'm imagining my trades, and I'm imagining what I'll do if they move in my favor. I rehearse the proper self-talk, and I imagine getting away from the screen and staying loose. I also imagine, with plenty of emotion, how happy I'll be sticking to my ideas and reaping enhanced profits. In short, I'm getting physically *and* emotionally pumped up during the jog.
This becomes a routine every morning. Repetition and powerful emotion are the keys to turning patterns into routines and setting new spots on our radio dial of consciousness. After a while, those thoughts, images, and feelings from my jogs begin to appear on their own, as they increasingly become familiar parts of me. Then, during my break from the screen while I'm letting a trade run, I go on my treadmill for a few minutes or simply jog in place. I get myself back into the pumped up state and recruit everything I've rehearsed. Instead of feeling anxious while riding the trade, I'm feeling energized.
Again and again, during each trading day.
Notice that you could substitute any desired behavior for the holding onto trades and make this technique work for you. It does take practice and repetition, but once you have a positive habit pattern, you have it potentially for life. The key is focusing on your strengths and turning those into patterns that can be triggered when you enter into associated states of mind and body. In my example, I used jogging to create the unique state. I could have just as easily chosen meditation or self-hypnosis.
Once you grasp this method and become good at it, there are many positive patterns you can program--in your work, relationships, and trading. There is no need to become bogged down in problems when you can build upon your own solutions.
From the previous post, it should be clear why this is such a difficulty: We set our profit targets and trade strategy while we are in one state of mind but then, as the trade progresses, we enter an entirely new state. That new state very often involves worried thoughts about losing unrealized profits or having gains turn into losses. It generally brings an elevated heart rate, increased muscle tension, and more rapid and shallow breathing. As we become aware of the nervous feelings, that helps to perpetuate the negative thoughts and altered physical state, which in turn can amplify the anxiety. Very often, cutting positions short before profits can run is simply a coping device to manage this anxious state. We exit the position for emotional relief, not for reasons of sound strategy and money management.
The solution focused approach calls on us to review those occasions in which we have been able, in some measure, to let profits run--even just a bit. What did we do differently on those occasions? Those exceptions from our problem patterns are what we have to build upon: they are our potential solutions.
In my case as a trader, there are several things I've done differently when I've been successful in letting profits run:
* I have planned the trade well in advance with research; it is not a spontaneous trade, so I've had time to think clearly about what I want to do.
* I have a clear profit target in mind based on research and refuse to waver from that target unless the market takes me out with a predefined stop. I consider myself a person of integrity, so I tell myself that I have to show integrity and loyalty to my trade idea and target;
* I don't follow the position tick for tick. Either the trade will hit my target or it will hit my stop. I make a conscious effort to let go and not micromanage the trade;
* I keep myself calm and clearly focused by purposely getting up from my chair, doing some stretches, breathing deeply, and getting away from the screen. I keep myself in a state that is incompatible with anxiety;
* I rehearse constructive self-talk during the trade. I tell myself that I've done my preparation and established my edge. Any individual trade can go against me, but if I take all the good trades I can, eventually I'll benefit from good odds and a good risk-reward ratio. If I lose money on the trade, I'll figure out why and what that might be telling me about the current market.
All of these steps, taken together, form a template for how I manage to hold onto positions to maximize profits. Now the key is to turn this template into a habit pattern. I want it to become automatic--an internalized part of me.
To accomplish this, I wear my heart monitor and go out for a morning jog prior to the market open. I use the monitor to ensure that I maintain an elevated heart rate and a good jogging pace. While I'm running, I'm mentally rehearsing each aspect of my template. I'm imagining my trades, and I'm imagining what I'll do if they move in my favor. I rehearse the proper self-talk, and I imagine getting away from the screen and staying loose. I also imagine, with plenty of emotion, how happy I'll be sticking to my ideas and reaping enhanced profits. In short, I'm getting physically *and* emotionally pumped up during the jog.
This becomes a routine every morning. Repetition and powerful emotion are the keys to turning patterns into routines and setting new spots on our radio dial of consciousness. After a while, those thoughts, images, and feelings from my jogs begin to appear on their own, as they increasingly become familiar parts of me. Then, during my break from the screen while I'm letting a trade run, I go on my treadmill for a few minutes or simply jog in place. I get myself back into the pumped up state and recruit everything I've rehearsed. Instead of feeling anxious while riding the trade, I'm feeling energized.
Again and again, during each trading day.
Notice that you could substitute any desired behavior for the holding onto trades and make this technique work for you. It does take practice and repetition, but once you have a positive habit pattern, you have it potentially for life. The key is focusing on your strengths and turning those into patterns that can be triggered when you enter into associated states of mind and body. In my example, I used jogging to create the unique state. I could have just as easily chosen meditation or self-hypnosis.
Once you grasp this method and become good at it, there are many positive patterns you can program--in your work, relationships, and trading. There is no need to become bogged down in problems when you can build upon your own solutions.
Saturday, January 13, 2007
Brief Therapy for the Mentally Well: Programming Our Own Experience
A bit over a week ago, I described short-term applications of psychology as "therapy for the mentally well". The goal of such work is to make positive changes, not necessarily eradicate pre-existing deficits. For that reason, the first step in the change process is having a vision of the changes you wish to make. By linking these positive changes to distinctive emotional, physical, and cognitive states, we are able to become the play-actors of our ideals.
Allow me to expand on a metaphor I used in the Psychology of Trading book. Consciousness is like a radio dial, and we operate on many frequencies. Each spot on the radio dial is a particular state: a blending of our experience of our bodies and minds. The test anxious student has a spot on their dial that combines negative thinking, increased arousal, shallow and rapid breathing, and diminished access to retained information. Other spots on the dial may combine much more positive thinking, alert concentration, erect posture, and fuller breathing. When operating at those frequencies, the student has full access to the information studied and performance on the test is excellent. What we know and who we are is relative to the frequencies of consciousness at which we're operating.
The problem is not that some of the spots on our personal radio dials are programmed with negativity. Rather, the problem is that we lack full, intentional control over the dial itself. We change stations, so to speak, without intending to. What the brief therapies accomplish is a greater control over selecting our own frequencies: they give us a hand to turn our dials. The idea, after all, is to become our own trading coach: to develop our own ability to reach our goals.
What creates the "radio stations" that make up our dial of consciousness? Two things: repeated experience that becomes habit patterns and powerful emotional experience that is processed as a trauma. Just as some radio stations on our car radio dials are faint and others generate a powerful signal, some of our states are weak and some dominate the dial. The more repeated the experience--and the more powerful the experience--the more it becomes part of your spectrum of consciousness.
As I emphasized in the Enhancing Trader Performance book, one reason so many traders fail is that they create repeated, negative emotional experiences for themselves. Indeed, this is why I included self-help manuals for cognitive and behavioral change techniques as two chapters within the book. Quite simply, traders can find themselves operating on frequencies that they don't want to be experiencing: their dials change without their consent or control. And all it takes to shift our frequencies of consciousness, very often, is a simple shift in one element of our frequency: a few negative thoughts, a change in our patterns of posture or breathing, a fleeting emotion. Those become triggers that diminish our control over our own experience.
While the aforementioned cognitive and behavioral techniques are extremely valuable, it is also important to be able to program our own new, enhanced spots on our dials of consciousness. The way to do this is to rehearse positive patterns of thought and behavior while you are in a distinctive emotional and physical state. This is one of the quickest and most reliable ways to generate change.
For instance, let's say your desired behavior is to hold onto winning trades longer. You might mentally rehearse market scenarios of holding onto trades--emphasizing how excited, happy, and profitable you'll be by achieving this goal--while you are pushing yourself during a strenuous treadmill exercise. By setting the treadmill at an incline and a good speed, you will be jogging at a brisk pace and elevating your heart rate. With repetition, you will begin to associate the goal--and its emotional benefits--with your body's pumped up state. It will become an increasingly powerful signal on your radio dial. Then, before trading and during trading breaks, all you have to do is get back on the treadmill. Triggering your body's shift in state will trigger the desired shift on your dial of consciousness. You will access the behavior you desire by intentionally triggering the cues associated with the behavior.
Making changes entails far more than simply engaging in positive thinking or getting positive images in your head. If you don't change your state of consciousness--and your ability to shift your own consciousness--you'll be listening to the same programming day after day. Learning how to shift out of negative states is a huge achievement. Where dramatic growth occurs, however, is in learning how to create new, positive states: in becoming the programmers of our own experience.
Allow me to expand on a metaphor I used in the Psychology of Trading book. Consciousness is like a radio dial, and we operate on many frequencies. Each spot on the radio dial is a particular state: a blending of our experience of our bodies and minds. The test anxious student has a spot on their dial that combines negative thinking, increased arousal, shallow and rapid breathing, and diminished access to retained information. Other spots on the dial may combine much more positive thinking, alert concentration, erect posture, and fuller breathing. When operating at those frequencies, the student has full access to the information studied and performance on the test is excellent. What we know and who we are is relative to the frequencies of consciousness at which we're operating.
The problem is not that some of the spots on our personal radio dials are programmed with negativity. Rather, the problem is that we lack full, intentional control over the dial itself. We change stations, so to speak, without intending to. What the brief therapies accomplish is a greater control over selecting our own frequencies: they give us a hand to turn our dials. The idea, after all, is to become our own trading coach: to develop our own ability to reach our goals.
What creates the "radio stations" that make up our dial of consciousness? Two things: repeated experience that becomes habit patterns and powerful emotional experience that is processed as a trauma. Just as some radio stations on our car radio dials are faint and others generate a powerful signal, some of our states are weak and some dominate the dial. The more repeated the experience--and the more powerful the experience--the more it becomes part of your spectrum of consciousness.
As I emphasized in the Enhancing Trader Performance book, one reason so many traders fail is that they create repeated, negative emotional experiences for themselves. Indeed, this is why I included self-help manuals for cognitive and behavioral change techniques as two chapters within the book. Quite simply, traders can find themselves operating on frequencies that they don't want to be experiencing: their dials change without their consent or control. And all it takes to shift our frequencies of consciousness, very often, is a simple shift in one element of our frequency: a few negative thoughts, a change in our patterns of posture or breathing, a fleeting emotion. Those become triggers that diminish our control over our own experience.
While the aforementioned cognitive and behavioral techniques are extremely valuable, it is also important to be able to program our own new, enhanced spots on our dials of consciousness. The way to do this is to rehearse positive patterns of thought and behavior while you are in a distinctive emotional and physical state. This is one of the quickest and most reliable ways to generate change.
For instance, let's say your desired behavior is to hold onto winning trades longer. You might mentally rehearse market scenarios of holding onto trades--emphasizing how excited, happy, and profitable you'll be by achieving this goal--while you are pushing yourself during a strenuous treadmill exercise. By setting the treadmill at an incline and a good speed, you will be jogging at a brisk pace and elevating your heart rate. With repetition, you will begin to associate the goal--and its emotional benefits--with your body's pumped up state. It will become an increasingly powerful signal on your radio dial. Then, before trading and during trading breaks, all you have to do is get back on the treadmill. Triggering your body's shift in state will trigger the desired shift on your dial of consciousness. You will access the behavior you desire by intentionally triggering the cues associated with the behavior.
Making changes entails far more than simply engaging in positive thinking or getting positive images in your head. If you don't change your state of consciousness--and your ability to shift your own consciousness--you'll be listening to the same programming day after day. Learning how to shift out of negative states is a huge achievement. Where dramatic growth occurs, however, is in learning how to create new, positive states: in becoming the programmers of our own experience.
Friday, January 12, 2007
How I Trade: Handicapping the Odds of Hitting Pivot Points
Pivot points are prices that have been used to identify potential spots of support and resistance. Can we use information generated during the day to help us identify when we're likely to hit pivot points? For this study, I calculated the market pivot as simply the average of the previous day's high, low, and close. The first resistance level (R1) was (Pivot x 2) - Yesterday's Low. The second resistance level (R2) was Pivot + (Yesterday's High - Yesterday's Low). The support levels were the reverse: first support (S1) at (Pivot x 2) - Yesterday's High; second support (S2) at Pivot - (Yesterday's High - Yesterday's Low).
Since 2004 (N = 762 trading days), we've had 387 occasions in which today's market hit R1 and 339 occasions of hitting S1. We hit R2 151 times and hit S2 156 times. Now let's look at whether today's NYSE TICK is greater than the average TICK level for the previous 20 trading sessions. This is the Adjusted TICK measure reported daily in the Weblog.
When the TICK has been greater than its 20-day MA (N = 385), we have hit R1 on 271 of those occasions: a bit over 70% of the time. We have also hit R2 on 131 of those occasions: around a third of the time. At those times, we've hit S1 on only 89 of the days (less than 25% of the time), and we've hit S2 on only 20 occasions (less than 6%).
When the TICK has been less than its 20-day MA (N = 377), we have hit R1 on 116 occasions--a little less than a third of the time. We've hit R2 only 20 times. On those occasions, however, we've hit S1 250 times (about 70% of the time) and hit S2 136 times (a little over a third of the time).
When the Adjusted TICK was in the top quarter of its values (i.e., very much stronger than the 20 day average), we hit R1 on 159 out of 190 days. We hit S1 on only 24 of those days.
When the Adjusted TICK was in the bottom quarter of its values (i.e., very much weaker than the 20 day average), we hit R1 on only 49 out of 190 days, but we hit S1 on 153 occasions.
When TICK was very strong (weak), we hit R2 (S2) a little over half the time.
Now imagine that we add volume at the market bid and volume at the offer as a handicapping tool (a la Market Delta) and imagine that we use the pivots as price targets for exits, leaving a piece of a position on when we have signs of extreme buying or selling. Imagine using historical market patterns to identify likelihood of heavy buying or selling.
That, folks, is pretty much a summary of how I trade.
Since 2004 (N = 762 trading days), we've had 387 occasions in which today's market hit R1 and 339 occasions of hitting S1. We hit R2 151 times and hit S2 156 times. Now let's look at whether today's NYSE TICK is greater than the average TICK level for the previous 20 trading sessions. This is the Adjusted TICK measure reported daily in the Weblog.
When the TICK has been greater than its 20-day MA (N = 385), we have hit R1 on 271 of those occasions: a bit over 70% of the time. We have also hit R2 on 131 of those occasions: around a third of the time. At those times, we've hit S1 on only 89 of the days (less than 25% of the time), and we've hit S2 on only 20 occasions (less than 6%).
When the TICK has been less than its 20-day MA (N = 377), we have hit R1 on 116 occasions--a little less than a third of the time. We've hit R2 only 20 times. On those occasions, however, we've hit S1 250 times (about 70% of the time) and hit S2 136 times (a little over a third of the time).
When the Adjusted TICK was in the top quarter of its values (i.e., very much stronger than the 20 day average), we hit R1 on 159 out of 190 days. We hit S1 on only 24 of those days.
When the Adjusted TICK was in the bottom quarter of its values (i.e., very much weaker than the 20 day average), we hit R1 on only 49 out of 190 days, but we hit S1 on 153 occasions.
When TICK was very strong (weak), we hit R2 (S2) a little over half the time.
Now imagine that we add volume at the market bid and volume at the offer as a handicapping tool (a la Market Delta) and imagine that we use the pivots as price targets for exits, leaving a piece of a position on when we have signs of extreme buying or selling. Imagine using historical market patterns to identify likelihood of heavy buying or selling.
That, folks, is pretty much a summary of how I trade.
Thursday, January 11, 2007
Four Overlooked Qualities of Successful Traders
One of the things I most enjoy about working with traders in various settings--prop firms, hedge funds, and investment banks--is the opportunity to see how successful traders actually succeed. I'm constantly amazed at the variety of strategies and skills that can be joined to create profitable approaches to trading and investing.
During this most recent road trip, four characteristics of successful traders--ones that are commonly overlooked--have jumped out at me, and I thought I'd pass along:
1) The Constant Desire to Improve - I met with a group of traders who have been successful over a period of many years. Nevertheless, they were participating in day-long meetings, including a seminar with me, to build on their success for the coming year. It was very clear that they are continually searching for new opportunities and strategies. They also value continuing education, keeping up to date with what's happening in their areas. They track their performance and, individually as well as a group, are setting very specific goals for improvement.
2) The Ability to Press Their Advantage - The really good traders are aggressive; no doubt about it. When they're seeing the market well and have good ideas, they aren't shy about using their size and pressing their advantage. Lesser traders are very quick to take profits and are risk averse re: losing those profits. The very successful traders keep their risk management, but don't hesitate to become more aggressive when they see opportunity. They remind me of boxers who, seeing opponents hurt, will go for the kill. The less successful traders seem to lack that killer instinct.
3) Emotional Resilience - The very successful traders have a great attitude about losing. They know it's going to happen. They don't take it personally. If anything, they try to find learning experiences from losses. Elsewhere I have written about how good traders view a losing trade as "paying for information". A trade with an edge that doesn't go their way either tells them something important about the market, or it tells them something about their execution. Either way, it's a potential learning experience. Resilience means that the excellent traders trade well out of a hole. They can be down money for day, week, or quarter and continue to make the same good trades they would normally make.
4) Creativity - We normally think of creativity as a trait that belongs to artists, but it also is quite noticeable among traders who have been successful over many years. They find edges in the most unlikely places. They look at interesting relationships within the market they're trading, and they find unique relationships from one market to another. One trader very recently told me of a strategy that exploited the way one market was priced related to a similar market at certain time periods. I would have never thought of that idea in a million years. He was making consistent money from the concept.
As I write about these four qualities, I'm struck by how they also can be found among very successful athletes, entrepreneurs, and performing artists. When you're a career trader, you truly are an entrepreneur, running your own business. Many of the same enterprising qualities we find in the business world are present in spades among excellent traders.
During this most recent road trip, four characteristics of successful traders--ones that are commonly overlooked--have jumped out at me, and I thought I'd pass along:
1) The Constant Desire to Improve - I met with a group of traders who have been successful over a period of many years. Nevertheless, they were participating in day-long meetings, including a seminar with me, to build on their success for the coming year. It was very clear that they are continually searching for new opportunities and strategies. They also value continuing education, keeping up to date with what's happening in their areas. They track their performance and, individually as well as a group, are setting very specific goals for improvement.
2) The Ability to Press Their Advantage - The really good traders are aggressive; no doubt about it. When they're seeing the market well and have good ideas, they aren't shy about using their size and pressing their advantage. Lesser traders are very quick to take profits and are risk averse re: losing those profits. The very successful traders keep their risk management, but don't hesitate to become more aggressive when they see opportunity. They remind me of boxers who, seeing opponents hurt, will go for the kill. The less successful traders seem to lack that killer instinct.
3) Emotional Resilience - The very successful traders have a great attitude about losing. They know it's going to happen. They don't take it personally. If anything, they try to find learning experiences from losses. Elsewhere I have written about how good traders view a losing trade as "paying for information". A trade with an edge that doesn't go their way either tells them something important about the market, or it tells them something about their execution. Either way, it's a potential learning experience. Resilience means that the excellent traders trade well out of a hole. They can be down money for day, week, or quarter and continue to make the same good trades they would normally make.
4) Creativity - We normally think of creativity as a trait that belongs to artists, but it also is quite noticeable among traders who have been successful over many years. They find edges in the most unlikely places. They look at interesting relationships within the market they're trading, and they find unique relationships from one market to another. One trader very recently told me of a strategy that exploited the way one market was priced related to a similar market at certain time periods. I would have never thought of that idea in a million years. He was making consistent money from the concept.
As I write about these four qualities, I'm struck by how they also can be found among very successful athletes, entrepreneurs, and performing artists. When you're a career trader, you truly are an entrepreneur, running your own business. Many of the same enterprising qualities we find in the business world are present in spades among excellent traders.
Wednesday, January 10, 2007
Becoming the Play-Actor of Your Ideals
I was sitting in a waiting room reading a popular magazine, when I came across an interesting quote from actor/director Mel Gibson. The interviewer pointed out that many of the actors in his latest film, Apocalypto, had no acting experience. Was it difficult, the interviewer asked, to work with them as a director?
Gibson's response was that it wasn't all that hard. To teach someone to act, he insisted, what you need to do is show them how to breathe the emotions they are trying to portray. If actors can shift their breathing, Gibson implied, they can enter into the emotional states demanded by their roles.
To be sure, I haven't agreed with all of Gibson's comments of late, but this one struck me as particularly perceptive. There are approaches to short-term therapy that purposely increase a client's anxiety, by confronting patterns of avoidance, resistance to change, and defensiveness. Under conditions of heightened emotion--particularly anxiety--individuals gain access to memories, insights, and perspectives that they didn't have when they first walked in the door. By shifting a person's state of mind and body, the psychologist also shifts their awareness.
Think about the phenomenon of test anxiety. A student can study hard for a test and know the material cold. Under conditions of performance anxiety, the student tenses up. Muscle tension increases, negative thoughts intrude, and breathing becomes more shallow. In Gibson's terms, the student is literally enacting a panicked mode by adopting the mindset and physical state of the anxious person. Once the state has shifted, the student no longer has access to what he or she already knows.
This illustrates that the state we're in either facilitates or blocks access to what we know. Stated otherwise, what we know is relative to the state we're in. Without realizing it, we are like actors, altering our breathing, our posture, our movement patterns, and our thought processes to create a convincing enactment. Actors and actresses, however, shift their states intentionally to generate their portrayals. When we shift states, it is most often without our conscious awareness.
I submit that access to our implicit knowledge about markets and trading patterns is mediated by the states we're in during our decision making. If our bodies are relatively immobile, our breathing is shallow, and our thoughts are worried, we are hardly creating the conditions by which we would normally experience ourselves as powerful, confident, and controlled. We fail because, unwittingly, we enact the role of the ineffective individual.
What if we tracked the states of mind and body that we're in when we're trading effectively and then consciously made efforts to access those states through the trading day? What if we followed Gibson's dictum and enacted the mental and physical processes associated with success? Quite a while ago, a social psychologist named Kelly invented a therapy in which he encouraged people to act out their ideals: to play-act the person they wanted to be. He even had them make up a name, personality, and history of the role that they were to portray.
What he found was that, as people played out their ideal roles, they began to get positive feedback. This, in turn, encouraged them to continue the role enactments, which in turn provided more good feedback. After a while, the roles became more natural: Kelly's clients internalized the roles that they were playing.
We often think that we have to change ourselves internally (our thoughts and feelings) in order to change our behavior. But what if we adopted very different behavior and *then* generated new sets of thoughts, feelings, and experiences? What if, to paraphrase Nietzsche, we became the play-actors of our ideals--and thereby moved closer to those ideals?
For those who have developed trading skills, perhaps success is just a matter of finding the mental, physical, and emotional state in which access to those skills can be maximized. There is much room for self-experimentation for traders inclined to work on themselves.
Gibson's response was that it wasn't all that hard. To teach someone to act, he insisted, what you need to do is show them how to breathe the emotions they are trying to portray. If actors can shift their breathing, Gibson implied, they can enter into the emotional states demanded by their roles.
To be sure, I haven't agreed with all of Gibson's comments of late, but this one struck me as particularly perceptive. There are approaches to short-term therapy that purposely increase a client's anxiety, by confronting patterns of avoidance, resistance to change, and defensiveness. Under conditions of heightened emotion--particularly anxiety--individuals gain access to memories, insights, and perspectives that they didn't have when they first walked in the door. By shifting a person's state of mind and body, the psychologist also shifts their awareness.
Think about the phenomenon of test anxiety. A student can study hard for a test and know the material cold. Under conditions of performance anxiety, the student tenses up. Muscle tension increases, negative thoughts intrude, and breathing becomes more shallow. In Gibson's terms, the student is literally enacting a panicked mode by adopting the mindset and physical state of the anxious person. Once the state has shifted, the student no longer has access to what he or she already knows.
This illustrates that the state we're in either facilitates or blocks access to what we know. Stated otherwise, what we know is relative to the state we're in. Without realizing it, we are like actors, altering our breathing, our posture, our movement patterns, and our thought processes to create a convincing enactment. Actors and actresses, however, shift their states intentionally to generate their portrayals. When we shift states, it is most often without our conscious awareness.
I submit that access to our implicit knowledge about markets and trading patterns is mediated by the states we're in during our decision making. If our bodies are relatively immobile, our breathing is shallow, and our thoughts are worried, we are hardly creating the conditions by which we would normally experience ourselves as powerful, confident, and controlled. We fail because, unwittingly, we enact the role of the ineffective individual.
What if we tracked the states of mind and body that we're in when we're trading effectively and then consciously made efforts to access those states through the trading day? What if we followed Gibson's dictum and enacted the mental and physical processes associated with success? Quite a while ago, a social psychologist named Kelly invented a therapy in which he encouraged people to act out their ideals: to play-act the person they wanted to be. He even had them make up a name, personality, and history of the role that they were to portray.
What he found was that, as people played out their ideal roles, they began to get positive feedback. This, in turn, encouraged them to continue the role enactments, which in turn provided more good feedback. After a while, the roles became more natural: Kelly's clients internalized the roles that they were playing.
We often think that we have to change ourselves internally (our thoughts and feelings) in order to change our behavior. But what if we adopted very different behavior and *then* generated new sets of thoughts, feelings, and experiences? What if, to paraphrase Nietzsche, we became the play-actors of our ideals--and thereby moved closer to those ideals?
For those who have developed trading skills, perhaps success is just a matter of finding the mental, physical, and emotional state in which access to those skills can be maximized. There is much room for self-experimentation for traders inclined to work on themselves.
Trading Range Market: Returns After a Short-Term Consensus
In the Weblog, I recently noted that the average trading price for the ES futures has been in a narrow range over the past three trading sessions. Specifically, we've had average prices of 1419, 1418.5, and 1420. When we see successive average trading prices that are so similar, this suggests that we're in a trading range, in which prices are oscillating around their average. Such markets can be quite profitable for short-term trader who can identify the range and average price as they are setting up. I recently illustrated the notion of framing trade ideas as "returns to the average price" in a morning session tracking the market.
So what tends to happen after a three-day trading range with a tight array of average prices? Going back to 2004 (N = 755 trading days), I calculated the average trading price for each day in the S&P 500 Index (SPY) simply as the average of the day's open, high, low, and close prices. I then calculated the three-day high-low range of these average prices.
When we've had a narrow range of average prices of less than .30% (as at present, indicating a three-day trading range; N = 144), the next five days in SPY have averaged a loss of -.02% (76 up, 68 down). By contrast, when we've had a wide range of average prices of greater than 1.0% (N = 151), the next five days in SPY have averaged a gain of .24% (90 up, 61 down). For the entire sample, the average five-day change in SPY has been .16% (431 up, 324 down).
It thus appears that returns have been subnormal following a three-day trading range. Such a range represents a short-term consensus regarding value in the market. When we have widely spread average prices, such consensus is missing. In general, markets tend to reward holding stocks through uncertainty, not through consensus.
So what tends to happen after a three-day trading range with a tight array of average prices? Going back to 2004 (N = 755 trading days), I calculated the average trading price for each day in the S&P 500 Index (SPY) simply as the average of the day's open, high, low, and close prices. I then calculated the three-day high-low range of these average prices.
When we've had a narrow range of average prices of less than .30% (as at present, indicating a three-day trading range; N = 144), the next five days in SPY have averaged a loss of -.02% (76 up, 68 down). By contrast, when we've had a wide range of average prices of greater than 1.0% (N = 151), the next five days in SPY have averaged a gain of .24% (90 up, 61 down). For the entire sample, the average five-day change in SPY has been .16% (431 up, 324 down).
It thus appears that returns have been subnormal following a three-day trading range. Such a range represents a short-term consensus regarding value in the market. When we have widely spread average prices, such consensus is missing. In general, markets tend to reward holding stocks through uncertainty, not through consensus.
Tuesday, January 09, 2007
Tuesday, January 9th: Morning Comments
9:30 AM - Nice little pop in the NASDAQ and ES. I had added the little comment to my last post when I saw the NQ hold up well under selling. That's a good lesson for the day: when you see the TICK hitting negative values, but the index can't make new price lows, it's generally an early sign that sellers can't move the market any further: that buyers are finding value at those levels. That doesn't necessarily mean that buyers will enter the market in force, but it's usually a good bet that you'll get enough buying to move the index back toward a prior high for a short term trade. Blogger will shut down soon, so I'm signing off. Have a great day! Back with these comments on Monday; regular posts will continue daily.
9:13 AM - Selling strikes me as relatively unconvincing, and I'm looking to see if we stay above yesterday's lows, which should propel us back toward the middle of the trading range and perhaps toward the top. We have only 281 more declining issues than advancers and, unless, we see a downward shift in the TICK and increasing volume hitting bids, I'd look for rangebound trade today. 9: 14 AM I note the NASDAQ is holding up well under selling.
8:49 AM - One of my favorite early trade ideas is to wait for a few minutes and see if the market can break above its overnight high and/or previous day's high. If buying comes in and we can't break above that high, I look to sell on the buying for a move back toward the previous day's average price. My stats work shows a very nice edge to that trade, and it worked out this AM in the ER2. A similar trade applies to markets that can't break their previous day's (or overnight) low. One good trade like that per day with a little size can make your day. It would be worth researching with individual equities as well.
8:08 AM - Good morning. My comments will be abbreviated this AM, as Blogger is scheduled for an outage at 9:45 AM CT. I'll also be on the road working with traders the remainder of this week, so my next morning comments are scheduled for Monday. While on the road, I'll post to TraderFeed on a daily basis. As preparation for today's trade, I've summarized my market thoughts on the Weblog. Also check out the Weblog chart detailing the anatomy of a breakout move. We're trading above yesterday's highs in ES, and I'm closely watching the three-day DAX resistance around 6665 (cash) and the 1816 resistance of the last few days in the NQ futures. I note that, in the overnight session, only the ES has taken out Monday's high. So far, we're not above Monday's high in ER2 or NQ. That's something I'll be watching. If those latter contracts can't get above their previous day's highs, I'll be looking to sell early for a move back toward Monday's average trading price. I'll be following the distribution of the NYSE TICK and the volume trading at bid vs. offer per the aforementioned chart to gauge early strength in those two indices. Next update after the open. Have a great trading day.
9:13 AM - Selling strikes me as relatively unconvincing, and I'm looking to see if we stay above yesterday's lows, which should propel us back toward the middle of the trading range and perhaps toward the top. We have only 281 more declining issues than advancers and, unless, we see a downward shift in the TICK and increasing volume hitting bids, I'd look for rangebound trade today. 9: 14 AM I note the NASDAQ is holding up well under selling.
8:49 AM - One of my favorite early trade ideas is to wait for a few minutes and see if the market can break above its overnight high and/or previous day's high. If buying comes in and we can't break above that high, I look to sell on the buying for a move back toward the previous day's average price. My stats work shows a very nice edge to that trade, and it worked out this AM in the ER2. A similar trade applies to markets that can't break their previous day's (or overnight) low. One good trade like that per day with a little size can make your day. It would be worth researching with individual equities as well.
8:08 AM - Good morning. My comments will be abbreviated this AM, as Blogger is scheduled for an outage at 9:45 AM CT. I'll also be on the road working with traders the remainder of this week, so my next morning comments are scheduled for Monday. While on the road, I'll post to TraderFeed on a daily basis. As preparation for today's trade, I've summarized my market thoughts on the Weblog. Also check out the Weblog chart detailing the anatomy of a breakout move. We're trading above yesterday's highs in ES, and I'm closely watching the three-day DAX resistance around 6665 (cash) and the 1816 resistance of the last few days in the NQ futures. I note that, in the overnight session, only the ES has taken out Monday's high. So far, we're not above Monday's high in ER2 or NQ. That's something I'll be watching. If those latter contracts can't get above their previous day's highs, I'll be looking to sell early for a move back toward Monday's average trading price. I'll be following the distribution of the NYSE TICK and the volume trading at bid vs. offer per the aforementioned chart to gauge early strength in those two indices. Next update after the open. Have a great trading day.
Bull and Bear Days: A Simple Coding System and What It Tells Us
Let's create a very simple definition of bullish and bearish days in the market and see where that takes us. A bull day, at the very least, must meet three criteria:
* Its high must be greater than the high of the previous day;
* Its low must be above the low of the previous day;
* It must show a positive change from open to close.
A bear day, conversely, must display the reverse qualities:
* Its high must be below the high of the previous day;
* Its low must be below the low of the prior day;
* It must show a negative change from open to close.
Let's give one point for each of the bullish criteria. A bull day, therefore, earns a score of +3. A bear day is given a score of 0. If a day meets two of the three bull criteria, we'll call it a "near bull day" and give it a score of +2. A "near bear day", on the other hand will have met two of the three bearish criteria and will receive a score of +1.
So there we have it: A very simple coding system based on price action alone. Note that it can be used for any trading instrument for which we have open, high, low, and close prices. It can also be applied to any time frame, including intraday.
When we examine the daily data in the S&P 500 Index (SPY) going back to 2004 (N = 754 trading days), we see that we have had 409 bull and near-bull days and 345 bear and near-bear days. The day after a bull or near-bull day, SPY averages a loss of -.04% (207 up, 202 down). The day after a bear or near-bear day, however, SPY averages a gain of .13% (206 up, 139 down). Interestingly, on a next-day basis, we don't see a significant difference between bull and near-bull days or between bear and near-bear days. We can see, however, that bull and near-bull days are followed by subnormal next day returns and bear and near-bear days are followed by superior next day returns. Indeed, if we only bought the market following a bull or near-bull day and sold at the next market close, we would have lost money during the last three years of bull market!
Let's now look on a five-day basis. We'll consider a five-day period to be bullish if the sum of its daily scores is 10 or greater (meaning that the daily average is a near-bull day or stronger). Conversely, we'll consider a five-day period to be bearish if the sum of its daily scores is 5 or less (meaning that the daily average is a near-bear day or weaker). Five days following a bullish five-day period in SPY (N = 250), the market was up by an average of only .01% (135 up, 115 down). Five days following a bearish five-day period in SPY (N = 139), SPY averaged a gain of .29% (81 up, 58 down). Once again we find superior short-term returns following periods of weakness.
Finally, when we have a bull day during a bullish five-day period (N = 125), the next two days in SPY average a loss of -.03% (60 up, 65 down). However, when we have a bear day during a bearish five-day period (N = 62)--as was the case going into Monday's trade--the next two days in SPY have averaged a gain of .41% (42 up, 20 down). Clearly, we've had the best short-term returns during the bull market following bear days during short-term bearish periods.
In future posts, I'll be looking at other time frames, including weekly data, and other indices, including some of the ETFs. The simple coding system does not tell us how strong or weak a market is; only its directionality. Adding codings for strength or weakness may improve its ability to detect historical trading patterns--yet another topic for future investigation.
* Its high must be greater than the high of the previous day;
* Its low must be above the low of the previous day;
* It must show a positive change from open to close.
A bear day, conversely, must display the reverse qualities:
* Its high must be below the high of the previous day;
* Its low must be below the low of the prior day;
* It must show a negative change from open to close.
Let's give one point for each of the bullish criteria. A bull day, therefore, earns a score of +3. A bear day is given a score of 0. If a day meets two of the three bull criteria, we'll call it a "near bull day" and give it a score of +2. A "near bear day", on the other hand will have met two of the three bearish criteria and will receive a score of +1.
So there we have it: A very simple coding system based on price action alone. Note that it can be used for any trading instrument for which we have open, high, low, and close prices. It can also be applied to any time frame, including intraday.
When we examine the daily data in the S&P 500 Index (SPY) going back to 2004 (N = 754 trading days), we see that we have had 409 bull and near-bull days and 345 bear and near-bear days. The day after a bull or near-bull day, SPY averages a loss of -.04% (207 up, 202 down). The day after a bear or near-bear day, however, SPY averages a gain of .13% (206 up, 139 down). Interestingly, on a next-day basis, we don't see a significant difference between bull and near-bull days or between bear and near-bear days. We can see, however, that bull and near-bull days are followed by subnormal next day returns and bear and near-bear days are followed by superior next day returns. Indeed, if we only bought the market following a bull or near-bull day and sold at the next market close, we would have lost money during the last three years of bull market!
Let's now look on a five-day basis. We'll consider a five-day period to be bullish if the sum of its daily scores is 10 or greater (meaning that the daily average is a near-bull day or stronger). Conversely, we'll consider a five-day period to be bearish if the sum of its daily scores is 5 or less (meaning that the daily average is a near-bear day or weaker). Five days following a bullish five-day period in SPY (N = 250), the market was up by an average of only .01% (135 up, 115 down). Five days following a bearish five-day period in SPY (N = 139), SPY averaged a gain of .29% (81 up, 58 down). Once again we find superior short-term returns following periods of weakness.
Finally, when we have a bull day during a bullish five-day period (N = 125), the next two days in SPY average a loss of -.03% (60 up, 65 down). However, when we have a bear day during a bearish five-day period (N = 62)--as was the case going into Monday's trade--the next two days in SPY have averaged a gain of .41% (42 up, 20 down). Clearly, we've had the best short-term returns during the bull market following bear days during short-term bearish periods.
In future posts, I'll be looking at other time frames, including weekly data, and other indices, including some of the ETFs. The simple coding system does not tell us how strong or weak a market is; only its directionality. Adding codings for strength or weakness may improve its ability to detect historical trading patterns--yet another topic for future investigation.
Monday, January 08, 2007
Monday, January 8th: Morning Comments
10:38 AM - The main thing to take away from the AM trading session is the importance of flexible thinking. We started off with some research that suggested we were likely to take out the Friday lows. As the selling progressed early in the morning, however, it was apparent that many sectors were not participating. That suggested that it would be a mistake to chase those lows and, indeed, made sense to watch for reversals. Perhaps the most important mental shift was from "downtrend" thinking to "rangebound" thinking, with the AM lows and the 1420 resistance area forming the range. Having that range in mind enabled me to get on board to the long side when heavy selling could not bring us to new daily lows, but the range also alerted me to be aggressive in taking profits when the buying ran into a wall of sellers. Unless we see fresh buying enter this market, I anticipate the range to continue, which might set up some selling opportunities to test the lower end of the range. Have a great day!
10:29 AM - It was one of those "take what the market gives you" situations: we got nice buying up to the 1419 area and then sellers entered in force. I waited for the first bounce in the TICK and took profits. Now we'll see if we can regroup for another assault at 1420--or if sellers hold the lid and eventually have us retracing the trading range. One last comment shortly...
10:16 AM - The rangebound trade has continued, as volume is slowing down. We're not seeing the selling so far able to push stocks below the AM lows, but neither is buying expanding as we approach that 1420 resistance. That remains the tug of war. We need to see more than selling in the TICK terminating at higher lows: we need evidence of expanded buying as we move toward that 1420 area. I'm long some ES here when the heavy TICK selling couldn't push us to price lows, but will bail out if good buying is not sustained.
9:45 AM - In a good downtrend (or uptrend), you'll see the sectors moving in relative unison. That hasn't happened today. We had early weakness in the Russell, but note that commodities were not falling (as they have been) and we never saw a break of Friday lows in the emerging markets (EEM), as well as the NQ, semis, etc. That's helping us form a trading range between the 1420 resistance area and the AM lows, and now the job of the trader is to see areas where buying or selling dry up without getting through that range. That would heighten the odds of reversal. The positive shift in the TICK distribution and the very recent relative strength in ER2 raise the scenario that we've put in a low for the day. That will have me looking for spots where selling enters and dries up above those lows for a test (and possible break) of the resistance highs.
9:22 AM - Here you can see where the scenarios and flexible thinking are helpful. I was looking for evidence of selling drying up, but instead we've seen a continued negative TICK distribution and new lows first in the ER2 and then in the ES. Think of a downtrend as a situation in which successive rallies in the TICK occur at progressively lower price highs; an uptrend is the reverse. Once we get a bounce in the TICK at a lower high and then see the positive TICK eroding, the next short-term trade idea would be a test of the prior lows. It's when we see TICK selling hold up at higher or equal lows that we think about a downtrend reversing. So far that hasn't occurred. By staying grounded in the bid and offer volume and how the market is *actually* trading, we can entertain hypotheses about the market without becoming wedded to those.
9:05 AM - That 1420 resistance area held the first rally attempt, as buying dried up without us taking out that level and, sure enough, we were back to testing Friday lows. But only about 500 more stocks were declining than advancing, and the TICK distribution has not been as negative as on Friday. All that has me looking for signs of selling drying up so that I can buy this market, take advantage of a possible short squeeze, and a push through that 1420 resistance. Once again, it's a scenario I'm keeping topmost of my mind--not a fixed opinion. I need to see higher lows in the TICK and the weakest of the indices, the ER2, stop making new price lows.
8:42 AM - Hopefully you were able to see the weak TICK distribution and volume hitting bids in ES from the very start of the session, propelling us toward Friday lows. As noted, however, we're vulnerable to non-confirmations and snap back rallies: some sectors are showing some residual strength here, including semiconductors.
8:21 AM - We're seeing some rebound buying in the commodities (oil, gold) and some rebound buying overnight in the major U.S. equities futures markets. I'm watching the resistance area in the ES of 1420-1421; inability to break and sustain a rise above that level will have me selling the market this AM in anticipation of a test of Friday's lows. The equivalent levels in the Russell futures (ER2) and NASDAQ futures (NQ) are 782-783 and 1803-1804, respectively, and 6628 in the cash DAX. I will be watching the NYSE TICK and the distribution of volume at the bid and offer in the ES futures very carefully in early trade to handicap the odds of breaking and staying above those levels vs. testing Friday's lows. Should we test the lows, I will be looking at participation in the move very closely. If we see non-confirmations among sectors and relative strength in the TICK compared to Friday, the odds of a snap-back, short-covering rally would be increased. What I'm doing this AM, as every morning, is creating what-if scenarios to prepare for a variety of possible market outcomes, even though my primary scenario calls for a test of Friday's lows. The what-if scenarios keep you flexible; not locked into a single expectation. I'll post further if and when I see something of note. As mentioned earlier, I won't be posting every few minutes--only if there's something in the larger picture worth mentioning.
10:29 AM - It was one of those "take what the market gives you" situations: we got nice buying up to the 1419 area and then sellers entered in force. I waited for the first bounce in the TICK and took profits. Now we'll see if we can regroup for another assault at 1420--or if sellers hold the lid and eventually have us retracing the trading range. One last comment shortly...
10:16 AM - The rangebound trade has continued, as volume is slowing down. We're not seeing the selling so far able to push stocks below the AM lows, but neither is buying expanding as we approach that 1420 resistance. That remains the tug of war. We need to see more than selling in the TICK terminating at higher lows: we need evidence of expanded buying as we move toward that 1420 area. I'm long some ES here when the heavy TICK selling couldn't push us to price lows, but will bail out if good buying is not sustained.
9:45 AM - In a good downtrend (or uptrend), you'll see the sectors moving in relative unison. That hasn't happened today. We had early weakness in the Russell, but note that commodities were not falling (as they have been) and we never saw a break of Friday lows in the emerging markets (EEM), as well as the NQ, semis, etc. That's helping us form a trading range between the 1420 resistance area and the AM lows, and now the job of the trader is to see areas where buying or selling dry up without getting through that range. That would heighten the odds of reversal. The positive shift in the TICK distribution and the very recent relative strength in ER2 raise the scenario that we've put in a low for the day. That will have me looking for spots where selling enters and dries up above those lows for a test (and possible break) of the resistance highs.
9:22 AM - Here you can see where the scenarios and flexible thinking are helpful. I was looking for evidence of selling drying up, but instead we've seen a continued negative TICK distribution and new lows first in the ER2 and then in the ES. Think of a downtrend as a situation in which successive rallies in the TICK occur at progressively lower price highs; an uptrend is the reverse. Once we get a bounce in the TICK at a lower high and then see the positive TICK eroding, the next short-term trade idea would be a test of the prior lows. It's when we see TICK selling hold up at higher or equal lows that we think about a downtrend reversing. So far that hasn't occurred. By staying grounded in the bid and offer volume and how the market is *actually* trading, we can entertain hypotheses about the market without becoming wedded to those.
9:05 AM - That 1420 resistance area held the first rally attempt, as buying dried up without us taking out that level and, sure enough, we were back to testing Friday lows. But only about 500 more stocks were declining than advancing, and the TICK distribution has not been as negative as on Friday. All that has me looking for signs of selling drying up so that I can buy this market, take advantage of a possible short squeeze, and a push through that 1420 resistance. Once again, it's a scenario I'm keeping topmost of my mind--not a fixed opinion. I need to see higher lows in the TICK and the weakest of the indices, the ER2, stop making new price lows.
8:42 AM - Hopefully you were able to see the weak TICK distribution and volume hitting bids in ES from the very start of the session, propelling us toward Friday lows. As noted, however, we're vulnerable to non-confirmations and snap back rallies: some sectors are showing some residual strength here, including semiconductors.
8:21 AM - We're seeing some rebound buying in the commodities (oil, gold) and some rebound buying overnight in the major U.S. equities futures markets. I'm watching the resistance area in the ES of 1420-1421; inability to break and sustain a rise above that level will have me selling the market this AM in anticipation of a test of Friday's lows. The equivalent levels in the Russell futures (ER2) and NASDAQ futures (NQ) are 782-783 and 1803-1804, respectively, and 6628 in the cash DAX. I will be watching the NYSE TICK and the distribution of volume at the bid and offer in the ES futures very carefully in early trade to handicap the odds of breaking and staying above those levels vs. testing Friday's lows. Should we test the lows, I will be looking at participation in the move very closely. If we see non-confirmations among sectors and relative strength in the TICK compared to Friday, the odds of a snap-back, short-covering rally would be increased. What I'm doing this AM, as every morning, is creating what-if scenarios to prepare for a variety of possible market outcomes, even though my primary scenario calls for a test of Friday's lows. The what-if scenarios keep you flexible; not locked into a single expectation. I'll post further if and when I see something of note. As mentioned earlier, I won't be posting every few minutes--only if there's something in the larger picture worth mentioning.
EEM and FXI: The Split Personality of Emerging Market ETFs
In an earlier post, I observed that the emerging markets ETF (EEM) traded very similarly to the S&P 500 ETF (SPY). Both, for example, displayed an upward trend during the period from the market close to the next market open, but actually lost ground during the U.S. day trading session, from open to close. Let's take a closer look at this pattern and bring in a third market, the iShares FTSE/Xinhua China 25 Index Fund (FXI).
Going back to 2005, we see that SPY has gained 25.31 points due to U.S. overnight change (close to open), but has lost 5.64 points during its day sessions (open to close). The pattern is even more pronounced in FXI: from close to open, the ETF gained 70.13 points, but during the U.S. day session (open to close) it lost 19.65 points. And with EEM, the contrast is even more stark: from close to open, it gained 73.31 points, but from open to close, it has lost 30.36 points.
All of this makes me wonder how traders are pricing emerging markets during U.S. trading hours when the bourses for those emerging nations are, for the most part, closed. Going back to 2005 (N = 506 trading days), the correlation between day session change in SPY (open to close) and day session change in FXI has been .69. The correlation between SPY and EEM during the day session has been .75. This suggests that, during the U.S. day session, traders are pricing the ETFs for emerging markets by the only benchmark they have available: U.S. stocks. That raises the possibility that, in a relative information vacuum--when the exchanges in those emerging countries are closed--ETFs could be mispriced due to U.S. daytrading. Such mispricing could lead to exaggerated selling during the day session, which is corrected in subsequent U.S. overnight trade.
Could a trader exploit such an inefficiency? I went back to the start of my data in FXI (October, 2004) and note that, when the day session in FXI has been up (N = 268), the next day in FXI (close to close) has been up by an average of only .04% (138 up, 130 down). When the day session in FXI has been down (N = 295), the next day in FXI (close to close) has been up by an average of .21% (169 up, 126 down). This suggests that the emerging markets may be reversing selling that occurs during the U.S. day session.
Clearly this is but an opening step in ongoing research into these patterns. What seems clear is that the emerging markets ETFs are performing very differently during the U.S. day session (open to close) than during the U.S. overnight period (close to open). It also appears that the price changes in the emerging markets ETFs during U.S. trading hours are highly correlated with the price changes in U.S. shares.
In short, perhaps we're trading those derivatives as if they're American stocks, even though their underlying assets are not American. It is not clear to me why events that impact U.S. stocks, from trendline breaks to news reports to company earnings to economic releases, should exert a similar--and even exaggerated--reaction from ETFs that hold emerging country and Chinese assets. The result has been a split personality in emerging market ETFs: a bullish performance from close to open and a bearish one from open to close.
Going back to 2005, we see that SPY has gained 25.31 points due to U.S. overnight change (close to open), but has lost 5.64 points during its day sessions (open to close). The pattern is even more pronounced in FXI: from close to open, the ETF gained 70.13 points, but during the U.S. day session (open to close) it lost 19.65 points. And with EEM, the contrast is even more stark: from close to open, it gained 73.31 points, but from open to close, it has lost 30.36 points.
All of this makes me wonder how traders are pricing emerging markets during U.S. trading hours when the bourses for those emerging nations are, for the most part, closed. Going back to 2005 (N = 506 trading days), the correlation between day session change in SPY (open to close) and day session change in FXI has been .69. The correlation between SPY and EEM during the day session has been .75. This suggests that, during the U.S. day session, traders are pricing the ETFs for emerging markets by the only benchmark they have available: U.S. stocks. That raises the possibility that, in a relative information vacuum--when the exchanges in those emerging countries are closed--ETFs could be mispriced due to U.S. daytrading. Such mispricing could lead to exaggerated selling during the day session, which is corrected in subsequent U.S. overnight trade.
Could a trader exploit such an inefficiency? I went back to the start of my data in FXI (October, 2004) and note that, when the day session in FXI has been up (N = 268), the next day in FXI (close to close) has been up by an average of only .04% (138 up, 130 down). When the day session in FXI has been down (N = 295), the next day in FXI (close to close) has been up by an average of .21% (169 up, 126 down). This suggests that the emerging markets may be reversing selling that occurs during the U.S. day session.
Clearly this is but an opening step in ongoing research into these patterns. What seems clear is that the emerging markets ETFs are performing very differently during the U.S. day session (open to close) than during the U.S. overnight period (close to open). It also appears that the price changes in the emerging markets ETFs during U.S. trading hours are highly correlated with the price changes in U.S. shares.
In short, perhaps we're trading those derivatives as if they're American stocks, even though their underlying assets are not American. It is not clear to me why events that impact U.S. stocks, from trendline breaks to news reports to company earnings to economic releases, should exert a similar--and even exaggerated--reaction from ETFs that hold emerging country and Chinese assets. The result has been a split personality in emerging market ETFs: a bullish performance from close to open and a bearish one from open to close.
Sunday, January 07, 2007
Morning Comments From the Doc: Putting It All Together in Trading
I've recently received a large number of emails asking me about training and education in the area of short-term trading. It appears that there are a number of services out there offering mentoring and education services for thousands of dollars. Because these services have no real track record, traders are understandably reluctant to pony up those sums.
In my personal site, I try to summarize the market data I'm looking at each day and how I'm putting the data together into an initial framework to start the day. This site summarizes some of the research I conduct to identify possible trading edges, mostly from 1-5 days out.
The reality of trading, however, is that such preparation only gives you initial hypotheses and plans. The real skill of trading comes in when markets open and you have to analyze shifting patterns of supply and demand as they emerge. In my own trading, I follow several variables very closely (one-minute data):
* Whether volume is higher, lower, or equal to average volume for that time of day;
* How the most volatile market sectors (small caps, NASDAQ, semiconductors) are trading relative to the large cap indices;
* How interest rates, currencies, gold, and oil are trading during equity trading hours;
* NYSE TICK (number of stocks trading at offer vs. bid) and shifts in the distribution of the TICK;
* Volume of contracts executed at the market bid vs. ask for the ES futures;
* Whether a majority of sectors are participating in moves in the ES futures (I look at Spyder sector ETFs for much of this info);
* Value area (Market Profile) from the previous day's trade and how volume expands or contracts as we trade outside that area;
* Levels of support and resistance from the previous day as well as the current day, to identify potential trading ranges and levels we're likely to test.
If you were to watch me trade, you'd see me continuously shifting from one window/screen to another, monitoring these variables. At some point a pattern becomes clear and I get an idea of shifting demand/supply that will lead us to test a particular market level. That becomes the basis for a trade idea, particularly if it is in line with my prior research. I average 2 trades per day, mostly in the AM, and averaging 20 minutes in holding time.
In the next couple of trading sessions, I will try to post occasional market impressions as they occur. I won't be posting every few minutes as I have during the "Morning With the Doc" sessions. Rather, I'll wait for situations in which I perceive a larger pattern and will try to illustrate that. My hope is that this can help model a big picture way of thinking about short-term trading without being unduly distracting to you--or to me!
At the very least, it will illustrate a way to track markets that won't set you back thousands of dollars. I don't claim to be a Market Wizard, but--knock on wood--I've stayed profitable in my trading and have grown as a trader through long and sometimes hard experience. If sharing any of that experience can help others with their learning curves, that would be great. The idea, however, is to take away from my posts what makes sense to you, reject the rest, and integrate everything into your own trading style. Let's try it out Monday and see how it goes.
In my personal site, I try to summarize the market data I'm looking at each day and how I'm putting the data together into an initial framework to start the day. This site summarizes some of the research I conduct to identify possible trading edges, mostly from 1-5 days out.
The reality of trading, however, is that such preparation only gives you initial hypotheses and plans. The real skill of trading comes in when markets open and you have to analyze shifting patterns of supply and demand as they emerge. In my own trading, I follow several variables very closely (one-minute data):
* Whether volume is higher, lower, or equal to average volume for that time of day;
* How the most volatile market sectors (small caps, NASDAQ, semiconductors) are trading relative to the large cap indices;
* How interest rates, currencies, gold, and oil are trading during equity trading hours;
* NYSE TICK (number of stocks trading at offer vs. bid) and shifts in the distribution of the TICK;
* Volume of contracts executed at the market bid vs. ask for the ES futures;
* Whether a majority of sectors are participating in moves in the ES futures (I look at Spyder sector ETFs for much of this info);
* Value area (Market Profile) from the previous day's trade and how volume expands or contracts as we trade outside that area;
* Levels of support and resistance from the previous day as well as the current day, to identify potential trading ranges and levels we're likely to test.
If you were to watch me trade, you'd see me continuously shifting from one window/screen to another, monitoring these variables. At some point a pattern becomes clear and I get an idea of shifting demand/supply that will lead us to test a particular market level. That becomes the basis for a trade idea, particularly if it is in line with my prior research. I average 2 trades per day, mostly in the AM, and averaging 20 minutes in holding time.
In the next couple of trading sessions, I will try to post occasional market impressions as they occur. I won't be posting every few minutes as I have during the "Morning With the Doc" sessions. Rather, I'll wait for situations in which I perceive a larger pattern and will try to illustrate that. My hope is that this can help model a big picture way of thinking about short-term trading without being unduly distracting to you--or to me!
At the very least, it will illustrate a way to track markets that won't set you back thousands of dollars. I don't claim to be a Market Wizard, but--knock on wood--I've stayed profitable in my trading and have grown as a trader through long and sometimes hard experience. If sharing any of that experience can help others with their learning curves, that would be great. The idea, however, is to take away from my posts what makes sense to you, reject the rest, and integrate everything into your own trading style. Let's try it out Monday and see how it goes.
Subscribe to:
Posts (Atom)


 Posts
Posts


