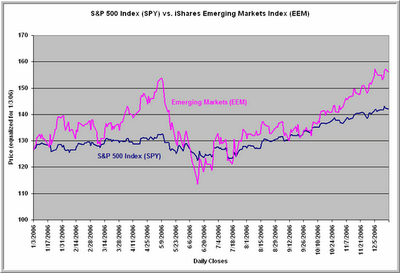
The emerging markets have been stellar performers during the 2003-2006 bull market. A harrowing drop in May and June of 2006 notwithstanding, the iShares Emerging Markets Index ETF (EEM) has tripled in value since its debut in May, 2003. By contrast, the S&P 500 Index of large cap U.S. stocks has risen by about 49% during that same time.
What constitutes emerging markets? As the ETF Connect site summarizes, EEM has a relatively even distribution of exposure to various industry groups, with about 17% of the fund in energy; 15% in banks; 13% in materials; 12% in semiconductors; and 12% in telecommunications. South Korea accounts for about 16% of assets; Taiwan for 11%; Brazil, Russia, and China for 10% each; South Africa for 9%; Mexico for 8%; and India for 5%.
The above chart shows that EEM has traded like a very volatile version of the American market. Since 2004, the day to day correlation between EEM and SPY has been .74, but the average daily percentage size move in EEM has been twice that of SPY (1.08% vs. .52%). Even the pattern of changes in EEM has mirrored that in SPY. Since 2004, SPY has gained about 31 index points. 30-1/2 of these points have come during the period between the previous day's close and the next day's open (overnight gap). During the day trading session, SPY has gained only half a point since 2004.
EEM has displayed an even more exaggerated version of this disparity. EEM has gained about 58 index points since 2004. Of those, 104 have come between the previous day's close and the next day's open. During the U.S. daytrading session, EEM has actually lost 46 index points!
All of this has led me to wonder if EEM might be a speculative version of SPY from a trading standpoint. When EEM is outperforming SPY, traders and investors are bullish on this most speculative segment of the world markets. Conversely, when EEM underperforms, traders and investors are avoiding such speculation.
Going back to 2004 (N = 727 trading days), I split the data in half based upon the 20 day relative performance of EEM to SPY. When EEM strongly outperformed SPY (N = 364), the next ten days in SPY averaged a gain of .12% (199 up, 165 down). But when EEM was in the bottom half of its performance relative to SPY (N = 363), the next ten days in SPY averaged a gain of .52% (240 up, 123 down).
What this suggests is that the relative performance of EEM and SPY might be capturing the degree of speculative sentiment in the market. When traders are at their most speculative, the U.S. market tends to underperform compared to those occasions when traders are less risk-taking. Notice that, as during the March-May period, the relative performance of EEM to SPY has been ramping up since October--perhaps a bit of caution for this market.


