Monday, March 24, 2014

Positive Divergences Amidst the Negative Ones

Saturday's post looked at divergences in the new high/low data among U.S. stocks.  When hundreds of shares are posting fresh one-month lows despite market averages hovering near their highs, you know there's weakness under the surface.

With today's drop in stocks, we touched a five-day intraday low in the major U.S. indexes.  I can't help but notice, however, that we failed to print five-day lows in many emerging markets (EEM), including China (FXI), Brazil (EWZ), and India (PIN).  Until recently, EM equities have been downside leaders.  Should that dynamic change, we could see some fresh growth stories--and asset reallocations--on the horizon.

And, speaking of divergences, we've seen net redemptions in the shares of many U.S. equity ETFs since the start of the year, including SPY.  During the most recent weakness, however, we have not seen net redemptions.  What would it take to get institutional investors back to gobbling up equity ETFs?  Perhaps a global growth story, sparked by fresh EM interest, would do the trick.

On the radar for now--

Further Reading:  Five Ways to Improve Your Trading

Facing the Execution Gap: Running Your Trading Business

It is common for portfolio managers and traders to refer to their work as their business.  And, after all, why manage money if we're not in the business of achieving superior risk-adjusted returns?

It's interesting, therefore, that market participants don't make greater use of organizational psychology in maximizing their businesses.

It is easy for a trader to imagine that psychological issues are interfering with best trading practices.  Less commonly acknowledged is that one's trading is not well organized as a business.

What the graphic refers to as "execution gap"--the difference between what you intend to do and what you actually accomplish--is often a function of disorganization.  This is not necessarily the result of personality problems and emotional upheaval.  Rather, it is the understandable consequence of trying to keep one's eye on markets and opportunities and at the same time on one's trading business.

What if what you needed to best improve your trading was an improvement in the running of your trading business?

Here's a little exercise:

Think of yourself as a business organization.  There is you the trader, but there are also a number of others within your organization who you manage.  Those include the people you talk with about markets, the sources of information that you access, and even the people in your personal life who impact your energy and focus.  Every person and every resource that can influence your trading performance is part of your organization, your trading business.

Now, with that organizational mindset firmly implanted, read the article on 4 Disciplines of Business Execution.  In that article, Sean Covey summarizes ideas from his book of that name and explains four ways in which successful organizations narrow their execution gaps.  Ask yourself how you would score if you were to grade yourself on each of these disciplines.

As Covey notes:  "...if you want to achieve goals you've never achieved before, you have to do things you've never done before."

If you're looking inside yourself for your answers, you may be neglecting the running of your business.  It's great to work on discipline and trading your plans, but your plans are apt to be suboptimal if you're not properly harnessing and managing the resources of your business.

Imagine a restaurant owner who is so busy cooking meals and serving customers that he never adapts his menus  to changing customer tastes.  He is hard working and disciplined--and he goes out of business.  

Great money managers aren't necessarily great business managers--and yet it takes both to sustain a successful trading career.  Researching and trading markets is half the battle: the other half is charting our business direction and executing on that strategy.

Further Reading:  Questions for Your Trading Business


Sunday, March 23, 2014

Readings and Resources for Starting the Week

Reading really is amazing...how else could we benefit from the ideas and inspirations from people all over the world at all periods of written history?

Here are some good readings and resources for starting the week:

*  Here's a blog from the PriceSquawk site on the advantages of hearing price action rather than watching it.

*  Quantifiable Edges on how the market would be trading now if it weren't for Fed meetings.

*  A look at the relative performance of financial shares and lots more financial links from Abnormal Returns.

*  Upcoming Battle of the Quants program and a worthwhile session on avoiding overfitting data.

*  Nice visualization of commodity performance for the week from FinViz.

*  Interesting trading strategies tested out by MarketSci.

*  Quite a compilation of quant-oriented posts from The Whole Street.


The Psychology of Quantitative Analysis

Early this morning I began my weekly routine of model building.

As a thought experiment, imagine taking every technical indicator out there and conducting a big factor analysis.  The factor analysis would reduce the number of indicators to a smaller cluster of factors that are relatively uncorrelated.  

This is important because it turns out that many indicators, from a purely mathematical vantage point, are measuring the same thing.  A 14-day RSI, for instance, may correlate very highly with a 14-day rate of change and a 14-day stochastics.  If you look at all three indicators, you're really looking at one variable measured three ways, not three unique variables.

What you really want are unique variables that are significantly correlated with forward price movement.

The bad news is that the many technical indicators out there really just boil down to a handful of unique variables.  The good news is that, overall, these unique variables do possess statistically significant predictive validity with respect to the prospective movement of stock index prices.  The challenging news is that even this significant predictive value leaves the lion's share of the future movement of stock index prices unexplained.

So imagine I identify a handful of unique predictive variables from among the large array of technical indicators and I identify the expressions of those variables that minimize their overlap.  From these few variables--it's important to reduce the likelihood of overfitting the data--I conduct a regression analysis and arrive at a statistically predictive model over an identified market regime.

Over the regime, let's say the model has been 65% accurate in forecasting the direction of S&P 500 Index prices over the next three trading sessions.  When the model has given its strongest signals (top quartile of forecasts), the average three-day gain in SPY has been .64%.  When the model has given its weakest signals (bottom quartile of forecasts), the average three-day loss in SPY has been -.28%.  This performance has held up well in out-of-sample testing.

Is this a good model?  It possesses a statistically significant "edge" and yet its R-squared, the amount of variance accounted for in future index prices, leaves about 90% of future action unpredicted.  A full 35% of the time, the model has been wrong in identifying future price direction.  And yet, a model that gets market direction right two-thirds of the time is better than throwing darts, assuming that we remain in the stationary regime that we backtested (an important assumption).

What quantitative work accomplishes for me psychologically is that it clearly identifies what is known and what is unknown.  It gives me a sense for when there is an objective edge and it provides a sense for the fragility of that edge.

Does quant modeling "take emotion out of trading"?  No, but it does something more important.  It replaces the emotions associated with overconfidence and confirmation biases with a different set of emotions: the humble respect for what is unknown, the desire to expand the frontier of the known, and the felt imperative to quickly adapt to what Victor Niederhoffer calls "ever-changing market cycles". 

Further Reading:   
Predictability as a Market Variable

Quant Reading:
See publications section of Marcos Lopez de Prado's site


Saturday, March 22, 2014

A Quick Look at the Market Tide

My chief market analyst is a bit cautious on the stock market.

The chart tracks all common stocks making fresh three-month highs minus those making three-month lows.  Back in mid-January, I became cautious on stocks because we were hovering at then-price highs and yet many fewer shares were participating in the strength.  That preceded the market tumble into early February.  

Now we see much the same thing happening.  On Friday we touched a price high in SPY and yet 847stocks made fresh three-month highs and 466 touched fresh three-month lows.  By way of comparison, we had 1626 new three-month highs on March 4th and only 101 three-month lows. 

Friday's high price in SPY was not confirmed by consumer discretionary shares (XLY); S&P 400 Midcap shares (MDY); homebuilder stocks (XHB); retail stocks (XRT); raw materials shares (XLB); consumer staples stocks (XLP); and healthcare stocks (XLV).  

NRK likes rising tides that lift all boats.  When she sees many boats not rising, she tends to question the tide.

Enhancing Your Information Processing

Yesterday afternoon I had the pleasure of speaking with Terry Liberman and Eric Cassidy from WindoTrader, a software platform that offers unique chart displays grounded in the Market Profile framework.

Notice the unique chart display above.  The entire period is captured at left in a profile view, displaying the prices with the greatest volume (far left) and the prices arrayed by time period (traditional profile).  The chart then segments the session into 14 large bars, with traditional bars inside the larger bars to show how price moved within the large bar period.  The large bars are color coded to show whether we are building value higher (green) or lower (red).  Notice the large rectangular bar that is arrayed horizontally across the center of the screen.  That is the session's value area.

The chart nicely shows how the market tried to establish value lower early in the session only to probe the opposite extreme of the value area. 

Notice how much information can be conveyed in a single display.  To be sure, any novel display takes time to learn and feel comfortable with.  With practice, however, traders can pick up on patterns that otherwise would go undetected with a traditional chart--particularly if they are guided by tested relationships derived from sound theory.

While on the topic of WindoTrader, check out their video series and especially the video detailing the concept of developing your "anchor trade".  That video nicely illustrates the value of looking at markets uniquely and developing bread-and-butter trades from your distinctive way of making sense of markets.  It's difficult to imagine you could achieve consistently better results than others by looking at the same information they do and processing it in similar ways.

Further Reading:  Countering Information Processing Biases in Markets

Friday, March 21, 2014

Creating the Right Trading Displays

In upcoming posts, I'll be showing a few ways of displaying information on charts that I find useful.

Much of short-term trading boils down to pattern recognition.  How information is displayed very much impacts the patterns that are perceived--and those that are missed.

What is important is that the chart clearly reflect the information most utilized by a trader in making decisions.

One piece of information I find crucial is perspective or context:  I want to see how the immediate, short-term action is related to the longer-term market auction.

A simple context is provided by the blue bars along the left axis.  Those display the total volume traded at each market price over the week's trade.  As you can see, we made fresh highs for the week this morning only to stall out.  It was helpful to see where volume had been distributed over the past few days, as that helps define what Market Profile traders call the "value area".  

A market that can't break out of a range is unable to establish value higher or lower.  The rejection of price above value in the morning led to the retreat back into the value range of the longer-term auction.

Markets continually establish value, reset value, and return to value.  Many of the day's best trades come from recognizing when a move away from value is gaining acceptance or finding rejection.

Further Reading:  Markets in Profile

The Limits of Self Belief

At most places where I have worked as a trading coach, I have been involved in the hiring process.  That has given me a fair amount of experience with interviews and interviewees.

What I can tell you is that the correlation between a candidate's self-professed passion for trading and the actual time/effort they spend understanding markets is close to zero.

The correlation between a candidate's stated confidence in their trading and trading methodology and their actual results is also about zero.

The most confident candidates I've encountered--those who target returns not achieved by even the most successful portfolio managers I work with--almost never can objectively document consistently good returns.

Candidates who come in with their actual, verifiable results, document their risk-adjusted returns, and clearly outline the limits as well as the promise of their methods are very often the ones who excel.

Promising candidates detail their trading processes, not their promise.

As outlined by recent research, it all seems as though confidence doesn't necessarily breed success.  Interestingly, the self-reported writing skills of college freshmen has been going up over decades, while actual writing ability has dropped.  Students rate themselves much higher in drive to succeed now than two or three decades ago, but the average time they spend studying has dropped meaningfully.

Whereas modesty was a common norm decades ago, it is now understood that successful people have to project confidence and tremendous self-belief.  This has led to a kind of ambition inflation, in which--crazily--above 75% of students rate themselves as "above average" in their drive to succeed.  One wonders whether that proportion really exhibits either drive or success.

Genuine confidence comes from hard work and hard experience: putting in the time and effort to achieve mastery and getting knocked down enough times to know--deep in your soul--that you have what it takes to succeed.  It springs from that "grit" factor described by Duckworth.  Stated confidence without the hard work, without the experience, and without the demonstrated grit is self-promotion at best, delusion at worst.

The old pros know: it's when you think you're special that markets are most poised to prove you wrong.

Further Reading:  The Power of Uncertainty

Thursday, March 20, 2014

Small Steps, Large Changes

In the recent post on why changing oneself is so difficult, I drew on the work of Kegan and Lahey, who emphasize that our "competing commitments" can make us immune to change.  They make the point that our "big assumptions"--our deeply-held beliefs about ourselves and the world--can stand in the way of implementing desired (and desirable) changes.

If I hold a deeply held belief that everything I do is destined for failure, then it's understandable that part of me would hold back from taking risks even though another part of me wants to take a calculated leap.  If my belief is that it is selfish to make money and focus on success, it's not surprising that I won't sustain the drive to achieve in business or in markets.

Amazingly, Kegan points out, people can be told that they need to take pills or else risk death--and yet a majority won't comply with doctors' orders.  That's not because they don't want to live.  It's because a competing drive makes it difficult to change their behavior.  

I had the honor and pleasure this afternoon of speaking with a wise rabbi from Beth Medrash Govoha in Lakewood, NJ. BMG, if you don't know about it, is a very unusual place, where students gather to study in self-organized groups and select their leaders--a place where the entire goal is learning for learning's sake.

The rabbi and I discussed change and he made an excellent point:  You can look at an ideal behavior--or someone who is ideal--and that can be inspiring.  But most of us are far from ideal and need to change one action at a time.  If you want to be a more generous person, you start by doing one generous thing each day.  No big change--just a step in the right direction.

Now it turns out that this is how people overcome many forms of anxiety, such as phobias and PTSD.  They very gradually, but very steadily, face the thing they are afraid of and build one successful experience after another.  Each step is not a large one, but after a while people are facing things they could never have tolerated earlier.

If you're not working on change daily, you're not working on change.  And if you try to accomplish massive changes in one day, you run the risk of activating competing motivations and derailing your efforts.

When change is each day in small ways, you gradually experience yourself in new ways...and soon that experience becomes part of your identity.  Most people are not immune to change.  They are immune to big changes.  The key to remaking yourself is to find the small steps that add to big changes without setting off alarms.

Further Reading:  Creating the Right Life Mirrors

What We Can Learn From Correlations Among Stock Market Sectors

As we saw in the post on Julian's video, we can gather a great deal of information from patterns of correlation.

Above is a measure of rolling correlations among major U.S. stock sectors that I track daily.  Basically it's a moving average of a composite of the correlations of each sector with every other sector.

Correlation has been percolating higher of late, but is not yet at levels that have been associated with recent market bottoms and snap-backs.

Since 2013, I notice that the average five-day return in SPY has been about .25%.  When the correlation among sectors has been above .80, the average five-day return has been .49%.  When the composite correlation has been below .80, the average five-day return has been .06%.

When stocks peak, they tend to move their own ways as sector rotation sets in and strong shares stay high while weak ones begin their declines.  When stocks fall, they tend to fall in unison--and then often bounce back in unison.  

It's not just about how stock indexes move; it's also about how stocks move relative to one another.

Further Reading:  Intraday Correlations Among Stock Sectors

Wednesday, March 19, 2014

Changing Your Self: Why Change is So Difficult

Making changes in life--and in trading--can be scary.  Every change is a voyage from the more known to the less known.  The pull of habit and safety can become a weighty anchor, grounding us when we long to soar.

This morning, a wise trader suggested to me that people don't fail to make changes because they lack motivation or because they have some need for self-sabotage.  Rather, people long to make changes and still can't sustain change because they have other, hidden commitments.

When you desire to change your trading or your lifestyle or your relationships but find yourself stuck re-reading old life chapters, it is because something in those chapters pulls you back.  Disrupting your overt motivation to change is a hidden motivation that has been operating in the background all along.

The trader who cannot bring themselves to take more risk has a hidden commitment, perhaps for safety.  Until that hidden commitment is actively engaged and addressed, it will work at cross-purposes with the desired goal.

How do you happily integrate hidden commitments with personal goals?  The first step is to become aware of those commitments--and to recognize that they are there for a (usually good) reason.  In the next posts in this series, we'll examine the change process and how traders can bring their real selves closer to their ideals.

Further Reading:  The Importance of Discrepancy in Change

Getting More By Giving More: Creating Positive Spirals

Overnight I received an email from my son Macrae.

Crae *never* emails.  We text, we talk on the phone, but no email for this millenial dude.

But Crae emailed overnight and expressed a heartfelt interest in connecting with his siblings and their kids via Skype.  His reasoning was impeccable:  we have large family reunions annually, but this way we could be more connected by the time we actually connect in person.

Now you have to understand, Crae is in the middle of a challenging job hunt and has a fair amount on his plate.  But out of the blue he emails and thinks about connecting with those he cares about.

It turns out that people all around the world have similar stories to tell about reaching out, caring, and giving.  Check out the "stories" page on the I Like Giving site.  It's all about people feeling good about doing good.

In Barbara Fredrickson's research, she found that people who practiced lovingkindness meditation daily experienced physiological benefits in terms of greater heart rate variability and psychological benefits in terms of greater well-being.     

But here's the catch:  practicing lovingkindness meditation actually led to a greater number of loving experiences in subsequent daily life--which then *added* to well-being and physiological benefit.

In other words, reaching out to others in thought led to reaching out in action, which led to more good feelings and more reaching out:  a positive spiral.

How many traders, consumed by the challenges of their profits and losses, stay isolated in front of their screens, thus facing a negative spiral?

Instinctively, Macrae realized that to overcome personal challenge you have to look beyond personal challenge and broaden your universe.  It's one of psychology's great paradoxes:  When you're not getting enough from life, it's time to start giving.

Further Reading:  Giving Thanks

Tuesday, March 18, 2014

Succeeding at Trading Through Innovation

One of the distinguishing features I've found among successful traders is that they innovate.  They don't look at the same markets in the usual ways.  They find new ways of viewing and trading markets.

Here is an excellent video from high school senior Julian Marchese, who is one of the founders of the Leaders Group mentioned in an earlier post.  He demonstrates how he uses a correlation workbook in Excel to identify potential "relative value" or "mean reversion" trades.  The workbook also shows which macro markets are moving with others, highlighting particular themes that are dominating the macro trade.

When I first met Julian, he had no particular experience with quantitative analysis or Excel programming.  He taught himself the relevant skills so that he could become multifaceted in his views of markets.  His key insight is that markets don't move in isolation:  many times they move thematically, in response to macroeconomic developments.  By tracking the correlated movement of assets, it is possible to read the themes that are driving market action and bet either on the continuation of those themes or their reversal.

Further Reading:  Pain and Gain in a Trader's Development
 

The Psychology of Trading Edge

We saw a nice thrust upward in stocks yesterday, as we went from a situation in which fewer than 30% of stocks traded above their three-day moving averages to one in which over 80% closed above that benchmark.  (Kudos to Index Indicators for the chart and data). 

So what has happened historically after a situation in which the difference between stocks trading above their three-day averages moves 50+% in a single day?  By definition, that captures a move in which we start with most stocks below their short-term moving averages and finish with most of them above.

Going back to mid-2006, when I first began archiving these data, this has occurred 39 times in a VIX environment < 20.  Over the next five trading sessions, SPX has been up 24 times, down 15 times for an average loss of -.26%.  Winners have been more common than losers, but the average size of losers has exceeded that of winners handily.

No edge in that particular pattern.

Which can be information.

But suppose I *need* to find an edge.  I keep running historical queries until something "significant" pops out.  Perhaps I even fall prey to confirmation bias and keep running the studies until something supports my preexisting market view.  If we run 20 studies, we've got a decent shot at finding the one in 20 that meets a significance criterion at the .05 level!

Confirmation bias is an understandable challenge in a field where confidence is needed to put on trades.  Running studies until something looks good--or cherry picking the charts to look at--is an understandable bias when traders are seeking confidence.

Sometimes, however, the answer is that there is no meaningful directional edge in a given market.  It's like drawing a poor hand at the poker table.  The pros know when to play and when to muck their hand.  There is an important difference between the motivation to trade and the motivation to make money.

Further Reading:  Avoiding Confirmation Bias

Monday, March 17, 2014

The Real Reason Traders Struggle With Discipline

If there's a single theme that dominates discussions of trading psychology, it's discipline.

Traders are routinely encouraged to control their emotions, stick to their processes, keep journals, whatever.  If you lapse in your trading, it's because you're not sufficiently disciplined.  Call it the puritanical approach to trading: if you don't stick to the straight and narrow, yours is a failure of willpower and commitment.

Research provides us with a different picture, however.

Willpower is a limited resource, tied to glucose levels in the brain.  When we exercise willpower in one set of circumstances, we can become depleted for the next ones.  Spending hours in front of a screen is an activity tailor-made to deplete willpower.  Overtrading and breaking one's trading rules, from that perspective, is less about self-sabotaging and more about the limits of our capacities for self-regulation.

The good news is that willpower really is like a muscle, in that it can be built over time.  Until your willpower muscles are of bodybuilding quality, however, an important trading practice is simply getting away from screens and renewing one's energy and focus.  Quick exercise, a drink of lemonade, a power nap--all are ways of restoring discipline.

Ironically, it's often the most driven performers who drive their willpower into the ground, leaving themselves frustrated with themselves and their performance.  It helps to think of trading more as a distance race and less as a sprint: pacing oneself is key to finishing the race.

And how far can one train one's willpower?  Check out the feats of David Blaine or watch the Penn and Teller movie "Tim's Vermeer".  It may well be the case that the reason passion for one's work is essential to success is that only such passion provides the gym time needed to build world class willpower muscles.

Further Reading:  Discipline: Cause or Effect of Trading Problems? 

The Revolution in Personal Investment

So much of what's written on market sites is about trading.  So much of what's written about trading is about daytrading.  This blog is as guilty as any in that regard, given the author's trading history and background.  Active traders are more likely than others to purchase trading-related products, to watch market-related media, and visit trading-relevant websites.  It's only natural for those in the industry to go after that audience.

But looking beyond active trading, there is an important development that has gained traction in the investment world.  It loosely falls under the umbrella of alternative investing.

Why focus on investing?  The first reason was nicely captured in this article by Morgan Housel on why we're awful at assessing risk.  There are real costs associated with fees, overtrading, and undersaving.  I've met many active traders looking to make a living from a small capital base.  If they trade with a $5.00 retail commission and place one trade in the morning, one at midday, and one in the afternoon each day--hardly wild-eyed daytrading--they will have accumulated about $7500 in brokerage expenses over the course of a year.  On a $50,000 trading count that means that the active trader is down a guaranteed 15% over the year--not including other expenses such as equipment, software, data fees, etc.  With the house stacked that way, Vegas starts to look attractive.

The larger reason for the investment focus is that baby boomers have found that they need to take control of their finances in a zero interest rate world.  These self-directed investors are smart enough to know that they need diversification in their portfolios.  They don't need to be whiz-bang daytraders--they need to be competent portfolio managers.

But how can the average self-directed investor become a portfolio manager and hope to compete with experienced hedge fund and asset management pros?  One answer has become alternative mutual funds, which invest in strategies that the pros use.  Here's an excellent article passed along by the Simple Alternatives blog; it explains the the difference between hedged mutual funds and hedge funds.  It's a very important distinction for individual investors.

Imagine informed investors assembling portfolios of hedged mutual funds across a variety of asset classes and strategies.  In such a world, investors would look less like traders and more like funds of funds.

That future is already coming.  Take a look at one of my favorite sites, Abnormal Returns.  Every week editor Tadas identifies the links that have received the greatest number of clicks.  Here is the list for this past week and the week before.  What I find interesting in the lists is that so many of the links are pertinent to individual investing, not trading.  Those who need to manage their capital are hungering for information to help them become better at balancing the needs for return of capital and return on capital.

When you hear individual investors debating the risk-adjusted returns of their investment alternatives and not the short-term path of the stock market, you'll know that the revolution is upon us.

Further Reading:  Being a Professional Trader

Sunday, March 16, 2014

Putting Markets in Historical Perspective

I just took a look at the most recent report from Quantifiable Edges, including a historical study that examined what happens when (as on Friday) SPY drops on positive NYSE breadth.  Interestingly, over the near term, winning periods outnumbered losing ones by about 2:1.  If you check out the Quant Edges blog, you'll see similar studies posted. 

That pattern makes sense because the breadth is showing strength underlying the stock market, even while the large caps--which dominate the indexes--may be seeing selling.  Still, any trader looking to make use of that information has to make a key assumption: that the near-term future will mirror the past.  In other words, whatever has driven forward price movement in the backtest will persist as drivers during the next market period.

I think of historical patterns as precisely that:  a script that markets should follow if they are driven by the same factors that influenced past price movement.  In addition to how markets *should* trade, however, there is also how markets *are* trading.  That is why measures like NYSE TICK and Market Delta are valuable from my perspective:  they tell us if buyers or sellers actually are dominating the market.  It is when how markets *are* trading lines up with how markets *should* trade that interesting trading ideas emerge.

And if markets don't follow their historical scripts?  That, too, is information.  It tells us that markets are responding more to current, idiosyncratic factors than historical ones.  In such a situation, I want to find out what those present drivers are and track their waxing and waning.  The historical query from Quant Edges suggests we could see a bounce in the first half of the coming week.  We know, however, that there are unsettling events in Russia/Ukraine and China that could trump those odds.  Teasing apart those present influences from the historical ones will be a key to successful trading this coming week.

Further Reading:  Historical Studies and Being Prepared

Optimism and Trading Performance

Harry Truman defined pessimists as those who make difficulties of their opportunities, whereas optimists make opportunities of their difficulties.

It turns out that optimism is an important variable in the response to stress.

This post points to research suggesting that people who are optimistic have more stable levels of cortisol (stress hormone) than pessimists.  Interestingly, optimists with high pressure jobs start their morning with higher cortisol levels.  This suggests that stress hormones can produce distress--and they can get us going.  High pressure might not imply high stress if we feel optimistic about what we're doing.

Here's an excellent article summarizing evidence that optimism is the most important predictor of emotional resilience:  the ability to weather adversity.  Summarizing the research of Barbara Fredrickson, the author makes the point that, in a positive mind state, you're more primed to notice positive things and act on them.  In a negative state, you're more likely to be defensive and narrow your field of vision.

Seeing the whole market field is not just a matter of looking at more charts and indicators; it's also a function of the cognitive set with which we process the information. 

The answer to successful performance is not to simply don rose-colored lenses.  Optimism does not mean ignoring challenges--that is denial.  Rather, an optimist finds opportunity in challenge.  We can't always feel good about outcomes, but we can find meaning and value in the process of learning and developing from those outcomes. 

Further Reading:  Optimism and Motivation


Saturday, March 15, 2014

Embracing Your Obstacles

There will always be people in life who envy you, who resent your success, who are threatened by your accomplishments, who do what they can to sabotage your efforts.

Those include people in a workplace who place politics and "optics" over productivity and innovation.  Those also include naysayers who don't dare admit the possibility of achievement because that would undermine their excuses, their failure to make a difference.

You know who your friends are when you reach a breakthrough success.  Your friends are ready to celebrate with you: they share your joy.  Those who cannot celebrate with you?  Perhaps they're struggling with their own demons.  Perhaps they are burned out and exhausted.  That doesn't necessarily make them horrible people.  They just can't be your friends.

It's natural to feel anger and resentment toward those who stand in your way and seek to undermine your success.  I've seen people consumed by hate, plotting revenge and wishing nothing but harm on those who have hurt them.  Sadly, they fall prey to the very negativity they resent in others.

But you can use liars, naysayers, and mediocrities to make you stronger.  Here's a simple exercise:

When you find yourself in a negative mindset, talking to yourself in frustrated, angry, and discouraged ways, close your eyes, take a few deep breaths, and visualize the person who has been most destructive toward you--the person you most resent.  Vividly imagine his or her face and imagine that he or she is saying to you the very negative things that you're saying to yourself.  Feel what it's like to have that other person berating you, putting you down, telling you that you can't succeed, that you're a loser, that you're no good.

Suddenly you feel angry.  You don't want to hear that kind of message from anyone--and certainly not from the person you most resent!  With your eyes still closed and that image still vivid, imagine telling that other person off, standing up for yourself, and putting things in a much more constructive light.  Now you're angry at the negativity, not at yourself.  You're refusing to talk to yourself the way an enemy would speak to you.

Holding anger and resentment can indeed be a poison.  Channeling it toward the patterns we want to change distances us from those patterns and frees us from them.  We won't want to own a pattern that we associate with someone destructive.  Very often, the first step in a change process is becoming so disgusted and angry with our old ways of doing things that we're propelled into new ways.  

Those who have wronged you can make you stronger.  In vowing to never be like them, you set a positive course for yourself and free yourself from bitterness--secure in the knowledge that living well is the best revenge.

Obstacles are like weights in a gym:  when lifted, they make us stronger.

Further Reading:  Using Emotion to Change Emotion

Seeing a Broader Market Field


Great quarterbacks, it is said, see the whole field.  It may look as though receivers are covered and no passing opportunities are present if you're looking down the center of the field, but off toward the sidelines--or maybe even just off to your side--could be a good opportunity to complete a pass.

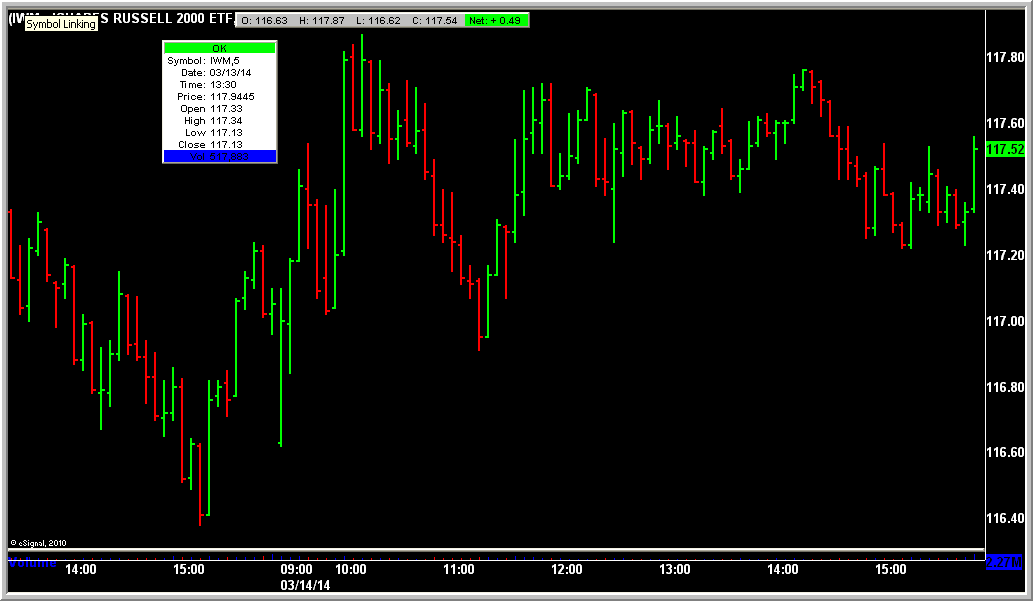
If all you were looking at yesterday afternoon was the S&P 500 Index (SPY, bottom chart above), what you saw was weakness through the day.  

Had you been looking at the smaller cap Russell 2000 shares (IWM, middle chart above) or the emerging markets ETF (EEM, top chart above), you would have seen shares holding nicely above their morning lows.

There was significant selling pressure in the afternoon, with multiple NYSE TICK readings below -800, and yet by the end of the day we had 643 stocks making fresh monthly lows, compared with 685 the day before.  Failing to trade below their prior day's lows were small cap shares (IJR); midcap shares (MDY); homebuilding shares (XHB); consumer discretionary stocks (XLY); raw materials shares (XLB); energy shares (XLE); EuroStoxx shares (FEZ); and utilities stocks (XLU).

If we see renewed broad weakness early Monday, we'll know that's fresh selling pressure-- and that would be information.  If we see firmness in stock prices early Monday, a number of tunnel-visioned quarterbacks might just have to cover their shorts.

Further Reading:    Preparation and Your Trading Pace 

Friday, March 14, 2014

Riding Trends Through Countertrend Trading

I recently posted a measure of intermediate-term market strength as well as moving average crossovers.  Above is a short-term measure of breadth specific to S&P 500 stocks that I have found helpful.  As with the intermediate measure, the raw data are from the Index Indicators site--shoutout to Mo Shaarani for a very useful site.  I archive the data and construct the indicator and chart it within Excel.  

This short-term breadth measure consists of a daily average of the percentage of SPX shares trading above their 3-day moving averages, their 5-day moving averages, their 10-day moving averages, and their 20-day moving averages.  So when the index approaches 100, the vast majority of shares are in uptrends over all of those short-term timeframes; when it approaches 0, the vast majority of shares are in short-term downtrends. 

Interestingly, when the breadth index closes below 30, since 2013 the next five-day gain in SPY has been 1.25%, almost four times the average gain for the remainder of occasions (.33%).  It's a great example of how markets that look and feel the worst--and that trigger the most stops for long positions--end up having the best near-term returns. 

Imagine short-term cycles superimposed on a long-term upward trend:  that is the market we've enjoyed for the last couple of years or so.  In such a market, it makes a lot of sense to be a trend follower--but to enter long positions in a countertrend mode.  

Further Reading:  Breadth as a Market Tool

A Look at Intermediate-Term Market Strength

Here's a measure that has done a nice job for me of tracking intermediate-term market strength and weakness.  You can see that we topped ahead of price, which is common, and have rolled over.  We have not, however, reached oversold levels, despite yesterday's stiff decline.  Those oversold occasions have marked very good buying opportunities in the past several years.

The intermediate strength measure looks at the number of S&P 500 stocks making fresh 5, 20, and 100-day new highs and lows and takes a moving average of that composite.  The data come from the Index Indicators site.

Like the crossovers, I've tracked these measures for years.  Daily posting of numbers and testing of relationships provides a learning experience that, for me, is far deeper than anything I can get from staring at screens.

Further Reading:  Implicit Learning and Trading Performance

Moving Average Crossovers and Shopping for Market Bargains

So imagine you are following all common stocks trading across the major U.S. exchanges and you track how many each day are crossing above their 20-day moving averages and how many are crossing below their 20-day averages.  If you take the net number of crossovers each day and track on a rolling five-day basis, you'd get a chart that looks like the above.

You'll notice that thrusts in crossovers to the upside have tended to lead price peaks in the market.  Troughs in the number of crossovers have corresponded with a number of short-term bottoms.

After yesterday's rout, you can see we're in the range of many of those troughs.  Indeed, since 2012, when (as yesterday) the net five-day number of crossovers has fallen below -1000, the next five days in SPY have averaged a gain of over 1.4%--about four times the average five-day price change over that period.

There are plenty of current geopolitical factors that could erupt and turn the recent decline into a deeper dive, so one cannot blindly assume that the future will mirror the past.  It's when tape action begins to confirm historical tendencies that you have a potential good short-term trade and NRK goes shopping.

Further Reading:  How Trading Systems Can Inform Discretionary Trading

Thursday, March 13, 2014

China on the Market Radar

FXI, the China ETF, has been underperforming U.S. stocks for a number of years and has moved lower recently in the wake of a domestic loan default and fears of a chain reaction.  Emerging market bonds (EMB) have also moved down in recent days, but are still well off lows of the last several months.  Note also the weakness in copper, which has been tied to the China trade in interesting ways.  With banks cutting lending to sectors with high levels of shadow banking debt, this familiar story has gained a bit of urgency in recent days.

Correlations and Opportunity Sets in the Stock Market

Here's a chart of rolling correlations among the major sectors of the S&P 500 stock universe vs. the S&P Index (SPY) itself.

Whether we are in a more correlated or less correlated environment impacts the relative value of trading the index itself vs. stock picking within the index.  Most recently we've been in a lower correlation mode.  Indeed, as we see from the FinViz site, over the last three months, returns from the major sectors have varied from a high of 10.1% (healthcare) to a low of -17.4% (conglomerates).

As a rule, the sectors tend to become more correlated during moves down and initial rises from lows and then less correlated during periods of short-term topping.  It is during those topping processes that we see sector rotation and weaker sectors falling off while stronger ones hold their highs.

My longer-term correlation metric has increased from .65 during 2005-2006 to .80 for 2012-present.  That has been part of the stockpicking challenge in the large cap universe and (along with volatility and its collapse) is one of the reasons many short-term traders in the stock market have gravitated to smaller cap shares that move more idiosyncratically.

It's yet another illustration of how market environments can shift over time and impact opportunity sets for traders.

Further Reading:  Adapting to Change

Wednesday, March 12, 2014

Self-Talk: Coaching Ourselves for Trading Success

There is no more important coaching relationship than the relationship you have with yourself.

How do you talk to yourself when you start your day?  When you are in losing trades or drawdowns?  When you are traversing your learning curve?

Our self-talk creates our most immediate psychological environment.

Do you talk to yourself the way you would speak with a loved one or a dear friend?  Do you motivate yourself?  Inspire yourself?  Challenge yourself?  Support yourself?

You wouldn't want to work for an employer that wasn't constructive, motivating, inspiring, challenging, and supportive.  Why would you settle for that as your internal workplace?

Successful traders, I find, may or may not make use of formal coaching, but they are generally good self-coaches.  They know when to give themselves a kick in the pants and when to be their own best friend.

I've long defined my work as a psychologist as comforting the afflicted and afflicting the comfortable.  That's also not a bad formulation for effective self-talk:  staying constructive when things go wrong and challenging ourselves when things go right.  Effective self-talk is much more than empty positive thinking:  it's staying constructive no matter how challenging life and markets become.

Further Reading:  We Become What We Think