Thursday, November 19, 2009

Today's Trade Across Asset Classes: Catching Intermarket Correlations


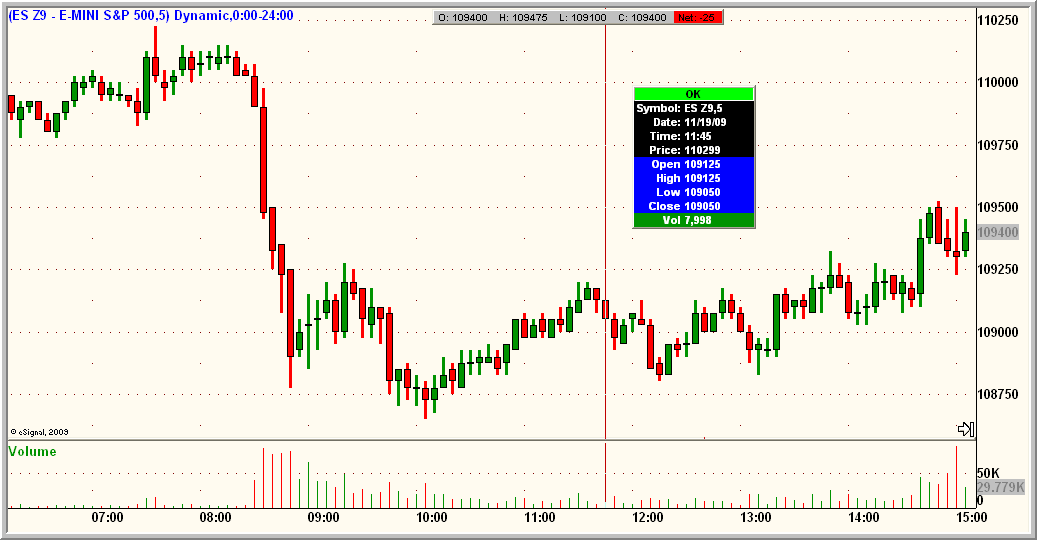
From 12 N CT forward, it was easy to look for a second leg down in the ES futures (top chart). Note, however, that the correlated asset classes--euro (middle chart) and gold (bottom chart)--had already rallied and taken out their morning highs. That suggested that the drop in stocks was not part of a fundamental revaluation of risk assets (as I had hypothesized), but rather a "puke" stimulated by the break of the multi-day trading range. If that is the case, the current action is more likely to be a correction in an ongoing bull market, rather than a reversal of those bull dynamics (much of which are rooted in the weak U.S. dollar).
.

Midday Briefing for November 19th: Bearish Sentiment


As regular readers know, the NYSE TICK is one of my favorite measures of short-term stock market sentiment. Here we see TICK on a 3-minute basis; note how the bars largely stay below the horizontal zero (purple) line. A quick look at the distribution of TICK values is afforded by the moving average of TICK (blue line), which has stayed below zero through the session, but has recently firmed.

As a rule, values above +800 suggest significant buying sentiment--many stocks upticking simultaneously, a sign of program buying--and values below -800 show significant selling sentiment. In today's trade thus far, we've had no readings above +800, but quite a few below -800. That's a sure sign that institutions--those executing the program trades--have been strongly leaning to the sell side.
.

Stocks Moving in Lockstep


The recent post highlighted the market's breakout move; those same qualities are common among trend days. Note from the FinViz spectrum display that stocks within the major sectors are almost uniformly lower over the day. That tells us that stocks overall are undergoing revaluation; this is not mere sector reallocation.
.

Morning Briefing for November 19th: A Legit Break


This morning's trade has given a great example of a breakout trade, as we moved below the range of the prior two trading sessions on expanded volume--and volume transacted at the market bid price. The skewed advance-decline ratio, very negative NYSE TICK, and dominance of volume at the bid all suggested that this break attempt (unlike ones yesterday) was legit. If so, we should not trade back into the overnight range.
.

Using Information Within the Bars on Market Delta Charts


If you click on the Market Delta chart above, you'll see the numbers within the 60-minute footprint bars. These numbers are quite helpful in managing positions in the market.

First, however, let's go over some basics:

Inside the bars, at each price, are two numbers. The first is the volume at that time transacted when that price was the market bid. The second is the volume at that time transacted when that price was the market offer. When volume transacted at the bid exceeds that at the offer (sellers more aggressive), that price level is color-coded red. When volume is transacted at the offer exceeds that at the bid (buyers more aggressive), the price level is color-coded green. The shifts of color within the bar show how buyers and sellers have behaved at each price level traversed during that period.

You can see that each bar has one price level and number pair in a box. That represents the high volume price for that period. By looking from bar to bar for the boxed prices, we can see where the market has been facilitating trade over time. In a downtrending market, the boxes will occur at successively lower prices; in an uptrending market, the boxes will occur at rising prices.

To the left of each bar is a vertical line that is either colored green or red. If the bar is color-coded red, the period's closing price was below the open. In such a case, the top of the bar represents the open price for the period; the bottom of the bar represents the closing price. Conversely, if the vertical line is green, that means that the close of the period was above the open price. In that case, the bottom of the line represents the open price; the top is the close.

That way, we can gauge the market open and close relative to the highs and lows for each period.

When we look at the numbers vertically within each bar, we can track where active trade occurred and where trade was shut off. This is very important: if trade is not facilitated as we're moving higher or lower, that means that we're running out of buyers or sellers at that time. Savvy short-term traders can use that information to gauge market exits.

When we look at numbers horizontally from bar to bar at particular price levels, we can see if trade is being facilitated at those prices from period to period. If volume shut off at a price in period one and then expands at period two, we know we're seeing market acceptance of that price as value. That can be very helpful information for entries and exits, as it tells us whether the flow of orders is going for or against our positions.

In coming posts, I will illustrate concrete trading applications of these data, with an eye toward better execution and management of trades. (Please note: I am not commercially or otherwise affiliated with Market Delta; the charts are tools I use and have found valuable in my trading and coaching.)

.

U.S. Dollar Bottoming: A Turn in the Risk Trade?


Recently, I've highlighted non-confirmations in the stock market, as new stock highs in the large cap indexes were not followed by highs among small caps and many stock sectors.

What we also see is that the recent highs in large cap stocks have not been followed by new dollar lows against the euro (top chart), yen (second chart from top), Canadian dollar (second chart from bottom), and Swiss franc (bottom chart).

With these major currencies topping out against the U.S. dollar and stocks showing divergences at highs, we may be seeing a major turn in the dollar-fueled "risk trade".
.

Wednesday, November 18, 2009

Learning and Developing as a Trader

In an excellent recent post, John Forman points out that trading education is not just about the divulging of trading systems. Books such as the Market Wizards texts can be useful, he points out, because the "...value to be found in books and other educational resources is not in specific trading systems and like. It’s in how the resource guides us in the development of our own unique way of taking on the markets."

As a trading coach and therapist, I am of value only if I can help traders see their challenges in new and promising ways. Everyone first tries to learn and grow on their own; it's when they become stuck in their progress that they typically reach out. Often, they are stuck because they're locked into a particular way of viewing self and markets. When a new view becomes available, it opens the door to novel ways of thinking and fresh ways of engaging markets.

So it is in trading education. It's not necessary that you learn "secrets from the masters." What *is* necessary is that you learn new ways of viewing market action, formulating trading ideas, and managing the positions that come from those ideas. A good book or course puts you in the head of the writer or teacher: from that perspective can come new insights, new skills.

The best traders I know seek out fresh opinions about markets; they also seek to learn new ways of engaging markets. It is by pushing themselves outside their comfort zones to look at things in new ways that they keep developing--and stay one step ahead of markets.

.

Identifying Range Trade


The tight value area (right histogram), relatively flat VWAP (red line), and mix of volume transacted at offer vs. bid (bottom histogram), and reduced overall volume all are useful tells for a range market. Another important tell: mixed strength/weakness among sectors. For most of the day today, the number of stocks in my basket trading up from their opening prices has been close to the number that have been down from their opens.
.

Midday Briefing for November 18th: Staying in a Range


Here's a follow-up to the chart shown in this morning's briefing. You can see that we traded back toward yesterday's low in the ES futures, bounced significantly higher back into Tuesday's range, and now have consolidated near the day's VWAP (red line) around 1106.25. So far, Wednesday has been trading inside Monday's range, as did Tuesday. As of my most recent count, 18 stocks in my basket have traded up from the open, 22 down. Financial issues have been relatively strong; we've seen relative weakness among raw materials shares, tech stocks, and small caps. We can also see mixed sentiment in the balance of volume trading at offer vs. bid (bottom histogram) and in the NYSE TICK.

The ES 1110 level represents important resistance; 1100 represents near-term support. I am watching intraday sentiment and leading sectors (large caps) for indications regarding the eventual break out of this trading range.
.

Morning Briefing For November 18th: Trading Higher


8:19 AM CT - I added the top chart to show how the ES futures are trading after the morning numbers. We initially sold off, then bounced back toward the day's session VWAP around 1107.50. Going back to yesterday afternoon, the 1104/1105 level has contained market selling. We're also seeing intermarket themes--weak dollar, strong commodities--supporting equity prices. As long as we stay above that 1104/5 area, we should make a move at testing bull highs. A move below 1100 would reverse yesterday's and Monday's firmness and suggest larger toppiness in the market.

This Market Delta chart, with each bar representing 125,000 ES contracts traded, shows how we're setting up going into the housing and CPI numbers this morning. Note how we held the 1100 area yesterday (which represented Monday's breakout level), and now we're trading above yesterday's range, building value higher. I'll update this with another chart and detailed commentary prior to the market open.
.

More Large Cap Outperformance Among U.S. Stocks


Once again, we're seeing evidence of large caps outperforming other indexes and market sectors. The Dow Jones Industrial stocks (DIA; top chart) have been roaring to new bull highs, even as Russell 2000 issues (IWM; second chart from top) remain below their September and October peaks.

Meanwhile, regional banking stocks (KRE; second chart from bottom) and homebuilding shares (XHB; bottom chart) remain notable sector laggards in the wake of continued concerns over commercial and residential real estate markets.
.

Tuesday, November 17, 2009

Tuesday Viewpoints

* Thanks to a sharp reader for this article on pushing ourselves beyond our comfort zones;

* Key idea: We change by adopting new roles;

* Very nice blog site that looks at framing the day with historical probabilities;

* Any biofeedback unit for traders that comes with an "emo bracelet" is definitely for me;

* Unemployment will continue to weigh on the economy;

* Credit contraction continues;

* Ending the "doom loop" for banks;

* A mixed picture for retail sales;

* A wave of mortgage defaults in the near future.
.

Markets in a Range


Note that we haven't gotten large moves today from most of the major asset classes and markets, as the Heatmap from the Barchart site displays. That has been one excellent tell of range trade in stocks thus far today: when traders are not revaluing related asset classes and moving them in trends, it's unlikely that stocks will be revalued.
.

Midday Briefing for November 17th: Range Bound Consolidation


Here we see a Market Delta chart in which each bar represents 100,000 contracts in the ES futures. What we see is that we have oscillated around the volume-weighted average price (VWAP; red line) around 1104 in a range trade. Once the market could not take out the day session lows from Monday, we moved back into the preopening range, with the 1107/1108 area important near-term resistance.

Among the stocks in my basket, I show 27 up from the open, 13 down, but nearly 700 more stocks are declining than advancing on the NYSE relative to Monday's close. New 20-day highs thus far handily outnumber lows, but we're seeing less than half of the new highs registered yesterday. All told, thus far, we're seeing a range day and consolidation of Monday's strength. If we're going to continue that strength, I would expect to see this morning's lows hold on selling.
.

Morning Briefing for November 17th: Building Value Lower


Here's how we're setting up prior to the open in the ES futures. The Market Delta chart will require some explanation. Each bar is drawn to represent the volume distribution within the period; each period represents 200,000 contracts. We see yesterday's and this morning's market, but the cumulative volume histogram at right is for the current day's session only.

What we see is that we've been building volume overnight below yesterday's volume bulge around ES 1108-1109. I will be watching how we trade relative to the overnight range closely, to see if we can sustain yesterday's strength or retrace much of the move. Note that we're seeing U.S. dollar strength, which, if sustained, could weigh on stocks during the regular trading session.
.

Hypothesize, Strategize, Revise: Viewing and Trading the Market Open

Here's a mental mapping process that helps me trade the early morning session:

Pretend the market open is 12 midnight.

Prior to the market open, see how Asia has traded and how U.S. stock index futures traded during Asian market hours.

Then see how Europe has traded and how U.S. stock index futures have been trading during European market hours.

Then watch how the U.S. stock index futures--and correlated asset classes, such as oil, gold, the U.S. dollar, and interest rates--behave on the release of any preopening economic numbers.

Then formulate your views as to whether U.S. stock index futures are trading in a range or with a directional bias. Identify price targets you think the market could hit in early trade if your view of the market is correct.

Then treat the market open as a news event, just like an economic release. See if the opening price action changes your view as to whether we're trading in a range or with a directional bias. Revise your views of market targets accordingly.

Repeat this process for any economic releases that follow the market open.

Hypothesize, strategize, revise: Updating your mental models of the market keeps you flexible--and keeps you on the right side of market moves.

More:

.

How to Interview For a Job: Three Keys

Mike at SMB Capital recently posted his ten interview tips for those pursuing positions with proprietary trading firms. Really, they're good tips for any position you might be interviewing for.

Here are my tips for interviewing, two of which dovetail with Mike's:

1) Outprepare Everyone - Know more about the firm you're applying to than any other applicant. Read about them, talk with people about them, know what they do--and be prepared to explain to them, specifically, why you are interested in *them*. Companies want to find a good fit between the interests and skills of applicants and the demands of the positions. Show them that you recognize that fit.

2) Don't Just Talk About Hard Work - Instead, show them hard work. Show them your achievements and efforts. Losers talk about their interest in trading. A winning interviewee will bring in his or her trading account statements and trading journal and *show* the interviewer the fruits of real labor.

3) Make a Connection - Here's where I might differ from Mike: research tells us that an interviewer's first impression really counts. Dress well. Make the most of eye contact, a handshake, and just plain good social skills. Looking and sounding good won't get you the job, but making a bad impression can lose you the spot. Remember, you're going to be part of a team. On average, people would rather have teammates they like than those they don't like.

Preparation and hard work: sound familiar? The same elements that make for a good interview also make for successful trading.
.

Monday, November 16, 2009

Monday Musings and Inspirations

* Super post: what it means when NYSE TICK starts the day strong;

* Great insights into how to interview for a position with a prop firm;

* Important topic: Turning goals into consistent habit patterns;

* Excellent economic overview: unemployment keeps the Fed on hold;

* The need to kill off the Chimerica monster;

* A look at the looming disaster in commercial real estate;

* Calendar effects in the stock market and other good reading;

* Repairing the American dream;

* Concerns over deflation in Japan;

* Eye-opening look at expanding government spending.
.

Quick Way to Track ETF Intraday Performance


A nice way to track intraday ETF performance is through the ETF heatmap published by FinViz. The map covers U.S. stocks, international indexes (see above), currencies, and commodities. When the entire map is largely green, it's generally a sign that risk assets are in demand.
.

Midday Briefing for November 16th: Building Value


We moved back to VWAP on selling in the wake of Fed chair Bernanke's comments regarding the dollar, but promptly moved back to--and above--the prior market highs, as dollar strength abated. Interestingly, those new highs were not confirmed by the NASDAQ 100 and Russell 2000 indexes, and we've since moved back into the morning range.

Notice the volume histogram at the right of the Market Delta chart above; it summarizes the volume of ES contracts transacted at each price traded through the day. You can see that volume has built between 1108 and 1109, telling us that this is where the market has reset value following the morning rally. If we are going to either continue the rally or reverse it, we should see a rejection of that value level in NYSE TICK and volume transacted at offer vs. bid. If we do not see strong or weak numbers in those indicators, that value area becomes a fresh fulcrum for a range trade.
.