Wednesday, December 31, 2008

When Program Selling Cannot Push The Broad Stock Market Lower


The blue lines represent 10 period moving averages for one-minute charts of the ES futures (top chart); Dow TICK ($TICKI; middle chart); and NYSE TICK ($TICK; bottom chart); click on charts for detail. One of my very short-term setups occurs when we get selling pressure in $TICKI that is not matched by commensurate selling pressure in $TICK. This typically occurs when program selling affecting large cap issues are not pulling the broad market lower. By waiting for the program selling to abate, as it did prior to 2 PM CT, we can often catch a nice pop up in the ES futures, as the large caps catch up to the broad market strength.
.

Cash Not Yet King When It Comes To Market Performance


With the credit crunch upon us, one might expect relative stock market outperformance from cash-rich companies that can finance their own expansions, take advantage of undervalued companies for strategic acquisitions, and ride out cyclical declines in business. According to Financial Times, six publicly held U.S. companies that hold the most cash are (billions USD):

Berkshire Hathaway (BRK.A): 106.1
Exxon Mobil (XOM): 28.2
Apple (AAPL): 24.5
Cisco Systems (CSCO): 19.9
Microsoft (MSFT): 18.7
Google (GOOG): 14.4

Since November (chart above), these stocks as a whole have not outperformed the S&P 500 Index (SPY; left most column on chart). Nor have they outperformed on a year-to-date basis; all, except XOM, are down more than 35%, while SPY is down 39%.

This will be an interesting group of stocks to follow going forward. While they hold an impressive stash of cash to weather economic storms, note that the entire group holds less than half of the $700 bn government allocation to TARP, perhaps obscuring the value of their fiscal prudence.

Interestingly, the greatest prudence belongs to China: three of the top four cash holding companies worldwide are Chinese banks, while China Mobile checks in at number six.
.

Tuesday, December 30, 2008

Trading the News: When Bad News Can't Keep a Market Down


Here's a great example of a worthwhile market pattern. We got some horrendous economic news regarding housing and consumer confidence around 9 AM CT, and the ES futures (chart above) dropped below their morning range. They quickly rebounded and moved solidly back into the range--an excellent tell that bad news could not dampen the holiday spirits of traders. We then broke above the morning range on solid volume, momentum, and NYSE TICK, leading us higher through the day.

Markets that cannot rise on good news and that cannot drop on bad news provide useful information for active traders. It's not the news itself, but the market's response to the news that is most important to track. That means that it's important to know which economic reports are coming out when and what the expectations are.
My morning Twitter posts include a listing of important economic reports and when they're coming out, which provides a heads up for seeing how markets trade at those times.
.

Head and Shoulders Bottom in the Stock Market?


I was recently asked about the possibility of a reverse head-and-shoulders bottom in the stock market, with the October lows constituting the first shoulder (first blue arrow above); the November lows forming the head (second blue arrow); and now the third blue arrow forming a second shoulder. If this pattern is valid, we should see the market holding at the low to mid 800's in the ES futures, followed by very significant buying that would launch us above the neckline in the low 900s.

I've overlayed the Cumulative NYSE TICK on the ES futures (chart above) to give a somewhat different picture. This is not a cumulative TICK adjusted for its prior 20-day average, as charted in my weekly indicator reviews. Rather, it is a simple cumulative sum of one-minute average TICK values. What this shows us is relative buying and selling pressure. We can see that the Cumulative TICK has been on the rise since the November bottom, but has been rising at a far more gradual pace than it fell during the prior decline.

While I'm open to the possibility of a head-and-shoulders reversal bottom, the actual buying and selling pressure across NYSE issues is equally consistent with a pattern of lower highs and lower lows in a bear market. I would like to see an upside acceleration of the cumulative TICK line before I stick my head and shoulders in a possible bear guillotine.
.

Monday, December 29, 2008

Recognizing Reversal Patterns in the Stock Market


The S&P 500 Index (ES futures contract; top chart) staged a nice turnaround in afternoon trading. An important clue to the turnaround was that we returned to prior days' support and then subsequent selloffs in NYSE TICK (bottom chart, blue arrows) could not generate lower price lows. With sellers unable to push the market lower, we saw a flurry of buying in TICK late in the afternoon, enabling ES to retrace its day's losses. Recognizing these patterns as they emerge is a key element of trading success; turnarounds often occur when buyers/sellers cannot move markets higher/lower, emboldening fresh sellers/buyers to enter the market.
.

Indicator Update for December 29th


Last week's indicator review found that we remain in a multi-week range bound market: "We continue to trade within a broad range, frustrating bulls and bears alike; ultimately, I expect any continued inability of stocks to sustain a move above the 900 area resistance to lead to a test of the range lows." We did indeed see a move down to the middle of our recent range, but seasonal strength kept the markets off its range lows. Sector strength has weakened over the past week, but money flow was positive among Dow stocks and the Cumulative Adjusted NYSE TICK managed to hit another multi-week high (bottom chart). The latter has reflected relative strength among small caps; as I noted in the morning's Twitter update, 47% of S&P 500 stocks closed on Friday above their 20-day moving averages, but 63% of small caps.

Thus, while we've pulled back to a moderately overbought stance in the Cumulative Demand/Supply Index (top chart) and have also pulled back in the ratio of new 20-day highs to lows among NYSE issues (middle chart), these moves were muted. The low 900 area continues to serve as important resistance for the S&P 500 Index; a break above that level accompanied by strong sector participation and new high strength would be an important signal for longer-term bulls. We need to see new 20-day lows outnumbering new highs and a downturn in NYSE TICK and money flow to test range lows. I will be updating market indicators each morning prior to the NY stock market open via Twitter (free subscription).
.

Sunday, December 28, 2008

Thoughts on Investor Complacence


I've talked with a good number of people about their personal investments; most have been significantly impacted by the simultaneous drop in housing, stock, and bond prices over the past year. Almost to a person, their investment strategy has been to stick with their investment mix, convinced that "things will eventually turn around".

The key word, of course, is "eventually". Stocks didn't overtake their 1929 highs for decades; by 1982, stocks--on an inflation-adjusted basis--had lost well over half their value relative to 1966. Japan's Nikkei stock average, depicted above in the chart from Decision Point, has made recent lows, having lost about 75% of its value since 1989. That's going on 20 years of severely negative returns.

In all of those markets, there were solid countertrend rallies offering attractive opportunities for traders and active investors. Among those investing over the long haul, however, I detect a shocking complacence and a complete absence of planning for worst case scenarios. Although Japan's long-term experience with going into profound debt in the name of quantitative easing has not been a formula for favorable stock market returns, U.S. investors seem singularly unconcerned about a replay.
.

Money Flow Update for December 28th


As we can see from the top chart above, Cumulative Money Flow for the Dow Jones Industrials stocks remains in a downtrend, but has bounced off its lows during the past week. The four-day moving average of money flow has once again turned positive (bottom chart), which has been a fairly reliable short term sell signal of late. Sustaining positive money flows after a period of relative strength--suggesting that buying is attracting further buying interest--is one of the things I need to see to identify any possible change in the Dow's trend.

Money flow numbers are updated each morning before trading days via Twitter (free subscription); tomorrow AM, I will update other market indicators (which are also part of the daily Twitter posts).
.

Saturday, December 27, 2008

Sector Update for December 27th

Last week's sector review found that most sectors were in a neutral trending mode, with financial shares weakest and health care issues strongest in relative terms. As of Friday's close, here's how the Technical Strength readings look:

MATERIALS: -300 (36%)
INDUSTRIAL: -200 (66%)
CONSUMER DISCRETIONARY: +20 (43%)
CONSUMER STAPLES: 0 (61%)
ENERGY: -100 (20%)
HEALTH CARE: +180 (73%)
FINANCIAL: -380 (33%)
TECHNOLOGY: -200 (49%)

The sectors, as a whole, are displaying a modest downtrend, with materials shares responding to commodity weakness and financial issues particularly weak. Technology and industrial stocks are weaker than they were last week; interestingly, energy shares have held up relatively well despite weakness in the price of crude oil over the past week.

The percentages of stocks within the sectors that closed on Friday above their 20-day moving averages are in parentheses, as reported by the excellent Decision Point site. This gives us a somewhat longer-term look at sector strength and weakness. Clearly, the commodity weakness is weighing on the energy and materials sectors; financials are also quite weak. Health care shares, somewhat recession resistant, continue to lead the pack.

Thus far, the sector readings are consistent with the range bound market conditions we've seen over the past several weeks. Active traders: note that I update trend numbers each morning before trading days via the Twitter app; subscription is free.
.

Implicit Learning, Self Regulation, and Biofeedback: Training for Trading Performance

The first post in this series took a look at implicit learning as a key element in trading performance. If trading decisions rest upon implicit (subconscious) pattern recognition, the implications for the development of trading expertise are significant:

1) Success is not just a function of finding the right data and indicators to follow, but also the ability to internalize these over time;

2) The majority of traders may fail simply because they lack sufficient consistent exposure to markets to facilitate an internalization of patterns of supply and demand;

3) Efforts at trading education that emphasize explicit learning (seminar/workshop teaching, written articles/books) cannot, by themselves, ensure trading success;

4) Most training programs for traders are not structured in a way that is designed to maximize implicit learning, as exposure to trading patterns is too brief and unstructured;

5) The most important psychological challenge in trading may be the ability to maintain a steady state in which traders have continuous access to their implicit knowledge base.

One role for biofeedback is training for maintaining this steady state. I've used heart rate variability feedback as one technique for sustaining "the zone". Heart rate variability has been described as an index of emotional regulation; it also appears to play a role in regulating responses to physical pain.

Talk counseling is limited in its ability to help traders achieve cognitive and emotional self-regulation in the face of risk and uncertainty. Biofeedback, utilized in real time in the context of making trading decisions, offers objective measurement of a trader's ability to perform in the zone and--most important--can aid in building the capacity to sustain self-regulation.

The premise of biofeedback is that, if you can regulate mind and body in real time, you are better able to guide and control the decisions you make, even in stressful circumstances. In this context, discipline begins with very basic elements of self control: control of breathing, focusing of concentration, and physical control.

Perhaps just as important, the ability to sustain the self-regulating zone is also likely to facilitate implicit learning itself. Freed of distractions, we're more likely to internalize trading patterns effectively and efficiently. Much of the effective training of traders may consist of training in self regulation, particularly under the challenging conditions of decision making under conditions of heightened risk, reward, and uncertainty.
.

Friday, December 26, 2008

Assessing Institutional Participation and Other Ideas for a Holiday Weekend


* Assessing Institutional Participation - Most analyses of NYSE TICK focus on direction, as a way of gauging buying vs. selling pressure. Because it takes institutional/large trader activity to move the TICK significantly (i.e., to trigger the simultaneous upticking vs. downticking of NYSE issues), the volatility of TICK itself is a nice way to assess institutional participation during the day. Above we see a moving one-day average of one-minute ranges in NYSE TICK (pink) plotted against the ES futures (blue). In general, we tend to see more TICK volatility near intermediate-term market bottoms and less volatility near price peaks. Note the huge tailoff in TICK volatility in the last session, as institutional activity was quite sparse during the holiday session.

* New Site - Trader Planet includes commentary and blogs, as well as articles and a variety of community features.

* Brains, Behavior, and Performance - Here are the most popular articles from the Sharp Brains site.

* Worth Following - The Traders' Talk feature of the Green Faucet site includes perspectives from some keen market observers.

* More Good Stuff? - If you're a blogger posting material that would be of special interest to Trader Feed readers, by all means email me the URLs and I'll be happy to include in Twitter and/or blog posts.
.

Implicit Learning: The Key to Trading Performance

My recent post emphasized the role of planning in successful trading. While trade planning is as important for the trader as game planning is for the quarterback, the reality is that a trader's performance, like that of the quarterback, is a joint function of gut feel and careful forethought. The quarterback may call for a pass play, with the flanker slanting up the middle of the field as a primary receiver, but under pressure from linebackers may opt to dump the ball to a running back or scramble out of the pocket and look for secondary receivers. Similarly, the trader may plan a trade to break below the previous day's low, but noticing very weak holiday volume, might take profits before the target is hit when the NYSE TICK cannot make decisive lows on a down move.

One of the formative experiences of my career as a psychologist was observing high frequency traders in Chicago (those making 50-100 or more trades per day on a discretionary basis) make money consistently, day after day, week after week, and year after year. When I looked at how much they were giving up in commissions each day and yet still could make money, I realized that their skills were greater than any market efficiencies.

Perhaps most interesting to me was that these traders typically could not verbalize to me how they were making their decisions. Yes, they could point to shifts in order flow, volume, etc.,--and, yes, their trading size and ideas about limiting losses and taking profits had a strong element of preplanning--but most of their decisions were like the audibles of the quarterback. It was clear to me that they knew a great deal about markets, but did not seem to know what they knew.

This realization led me to research the field of implicit learning when writing my book on trading performance. It also led to this key post on the objective basis for subjective knowledge. It appears that, particularly in the realm of pattern recognition, we process the world far better in an implicit, subconscious mode than explicitly. As a driver, I respond to the sudden shift of the car in the next lane almost immediately, before I consciously identify what that car is doing. This makes evolutionary sense: if we needed to rationally, consciously evaluate each threat before responding, we would not survive long as hunters, fighter pilots, or race car drivers.

An excellent recent research article passed along by an alert reader (many thanks!) points out that the human brain is hard-wired to make sound decisions in an implicit mode. For example, research subjects watching a computer screen in which most dots move randomly, but some move with a programmed path, can eventually make accurate predictions about the direction of the programmed dots far beyond chance levels. The mathematical calculations needed to make these predictions are beyond the skill level of many participants. Rather, their brains capture the probability distributions in the data and these present themselves to subjects as a "feel" for what will happen next to the dots.

The reason psychology is crucial to developing and experienced traders is that access to this felt, implicit knowledge is easily disrupted by such factors as fatigue, worry, frustration, and performance pressure. Indeed, one of the most common mistakes traders make is that they address performance problems by thinking harder. Like the insomniac who stays awake longer and longer thinking about trying to get to sleep, the trader who analyzes and worries about performance loses that "zone" in which probability distributions present themselves implicitly.

Experienced, successful traders know more than they know they know. Their performance crucially hinges on their ability to sustain a mindset in which they can access their implicit knowledge. Maintaining that "zone" will be the topic of the second post in this series.
.

Thursday, December 25, 2008

A Holiday Message From Brett Steenbarger

Experience is the hardest kind of teacher. It gives you the test first, and the lesson afterward -- Anonymous

Dear Readers,

I hope you've had a wonderful holiday season and are getting ready for a happy and prosperous start to the New Year.

It's hard to believe that I began this blog just three years ago. There were a little over 6000 visitors to the blog that first month, less than now visit the site during a slow holiday period. Since that time, the blog has expanded to include regular information on markets and indicators as well as trading psychology. The Twitter Trader blog within a blog carries updated market information and daily links to mainstream media and blog posts. Three years have generated over 1900 posts and 4400 "tweets".

More is to come in 2009. Over time, the Become Your Own Trading Coach blog will evolve into an all-purpose self-help site for traders. Included in the new Daily Trading Coach book will be a dedicated email address that readers of the book can use to ask questions and share insights, to help traders apply the ideas and techniques to their own trading. Many of those questions and insights will form the basis for future blog entries, so that one trader's learning can benefit all readers.

We are going through what appears to be the most severe recession in decades; 40% has already been cut from major stock market averages. History suggests that secular bear markets do not turn around on a dime: the crash of 1929 did not bottom until 1932, and stocks remained volatile and well below prior bull market peaks well into the next decade. Similarly, the severe decline of 1970 was followed by an even more severe drop in 1974 and further inflation-adjusted lows into the summer of 1982.

Such markets, however, bring significant volatility and superior trading opportunities for those who are not wedded to buy-and-hold. I know of a number of traders who have prospered in the past year; the difficult investment climate has not impaired their ability to trade successfully. Timing is key; over the coming year, that will be an increasing focus of the blog.

In and out of markets, the important thing is to identify where *your* opportunity lies in 2009 and then pursue it. My hope is that this blog provides you with a few tools and inspirations that will help you reach your goals. Thanks, as always, for the interest and support--

Brett
.

Trading With A Plan: The Importance of Intentionality

A planned trade is one that is guided consciously, filtered according to a variety of criteria that are designed to provide a positive expectancy. The opposite of a planned trade is an impulsive one, in which traders enter markets before explicitly identifying what they are doing and why. The difference between planned and unplanned trading is one of intentionality: being proactive in taking controlled risks vs. being reactive to what has already occurred in markets. Even the most intuitive and active trader can trade in a planned manner, if many of the elements of planning are achieved prior to entering positions.

So what are these elements of planning? The ideal trade identifies:

1) What you're trading - Why are you selecting one instrument to trade (one stock, one index) versus others? Which instruments maximize reward relative to risk?

2) How much you're trading - How much of your capital are you going to allocate to the trade idea versus other ideas?

3) Why you're trading - What is the rationale for the trade? Why does the trade idea provide you with an "edge"?

4) What will take you out of the trade - What would lead you to determine that your trade idea is wrong? What would tell you that the trade has reached its profit potential?

5) Where you will enter the trade - Given the criteria that would take you out of the trade, where will you execute your idea to maximize the reward you'll obtain relative to the risk you'll be taking?

6) How you will manage the trade - What would have to happen to convince you to add to the trade, scale out of it, and/or tighten your stop loss?

A beginning trader will take time to answer these questions, much as a new driver will need time to properly steer and brake a car. With experience, however, planning can occur very quickly, as much of a trader's homework is accomplished before the market opens. For instance, before the open, I already have identified the short- and intermediate-term trend of the market; pivot points that will serve as profit targets; and volatility that will guide my position sizing. From there, much of the trade is a function of pattern recognition and execution--seeing selling or buying dry up in a rising or falling market and entering the trade at a level in which I'll make more by hitting my target than by hitting my stop.

A good trade is not necessarily a profitable one: even the best planning is fallible. Rather, good trading is defined in terms of intentionality: having a constructive, valid purpose and sticking to it. When emotional and physical factors--anxiety, frustration, fatigue--affect decision making, they generally do so by impairing intentionality. Under the sway of an altered cognitive, emotional, or physical state, we become more reactive, less intentional. One of the most effective steps we can take when we're no longer in the "zone" of immersed concentration is to double down on trade planning, taking the next few trades only after writing down or talking aloud the elements listed above.

Training yourself to become more intentional during periods of heightened arousal or fatigue is an excellent strategy for building emotional resilience--and preventing trading losses from becoming trading slumps.

RELATED POST:

Gurdjieff, Intentionality, and Turtles
.

Wednesday, December 24, 2008

The Volatility of the VIX: From Bear Panic to Barely Elevated


VIX, a measure of implied volatility for S&P 500 options, has been making multi-month lows this past week, declining even as stocks have moved lower. Equally interesting, the volatility of the VIX itself--measured in the chart above as a five-day moving average of high-low percentage range--has returned to average values characteristic since 2007.

The volatility of the VIX is interesting in that it measures relative uncertainty in options pricing. During the October plunge, we saw record uncertainty, which has been declining ever since. Note how, in general, we tend to see relative uncertainty in VIX volatility near intermediate-term market lows and relative certainty near peaks. More than 40% below the 2007 peak in the S&P 500 Index, we're now seeing surprising unanimity and comfort in option pricing, even as the market has declined. In the past, that has not been a bullish indication.
.

Five Qualities I Look For in Successful New Traders

In response to my recent post on trading for a living, one reader asks, "In your opinion what are the starting qualities needed to be a great trader?" This is a difficult question, because different kinds of trading require different skill sets. For example, many of the best hedge fund portfolio managers have superior analytical skills and abilities to detect themes in noisy data. Many of the best market makers have an uncanny speed of mental processing and level of concentration that enable them to stay on top of order flow throughout the day. This is why I emphasize, in the trader performance book, that matching one's style of trading to one's strengths--talents and skills--is an essential component of success.

If I had to identify qualities that distinguish "starting qualities" that are important across all traders, the following come to mind:

1) Capacity for Prudent Risk-Taking - Successful young traders are neither impulsive nor risk-averse. They are not afraid to go after markets aggressively when they perceive opportunity;

2) Capacity for Rule Governance - Successful young traders have the self-control needed to follow rules in the heat of battle, including rules of position sizing and risk management;

3) Capacity for Sustained Effort - Successful young traders can be identified by the productive time they spend on trading--research, preparation, work on themselves--outside of market hours;

4) Capacity for Emotional Resilience - All young traders will lose money early in their development and experience multiple frustrations. The successful ones will not be quick to lose self-confidence and motivation in the face of loss and frustration;

5) Capacity for Sound Reasoning - Successful young traders exhibit an ability to make sense of markets by synthesizing data and generating market and trading views. They display patience in collecting information and do not jump to conclusions based on superficial reasoning or limited data.

Finally, I would say that successful developing traders approach their work with a kind of humility. They don't know it all and they don't pretend to know it all. They absorb wisdom from mentors and markets, and they are quick to acknowledge when they're wrong, so that they can get out of bad positions and learn from their experience. Show me a stubborn young trader with a defensive ego, and I'll show you one who will fight his or her learning curve every step of the way, with predictably poor results.

If you want to identify potentially successful young traders, look at their trading journals and gauge the amount of time they spend behind the screen. The good ones will have detailed entries about markets and about themselves, with constructive ideas, goals, and feedback. The less successful traders will have sparse entries that display little effort or analysis, with no goals, no constructive direction. The good ones watch markets closely, even when not trading. The less successful ones find little reason to watch markets if they don't have a position.

Effort alone won't make a trader successful, but lack of it will almost certainly ensure failure.
.

Tuesday, December 23, 2008

Selecting Successful Traders: Implications for Proprietary Trading

In a recent article, Malcolm Gladwell tackled the quarterback problem: the issue of selecting performers who are most likely to succeed in their fields. It turns out that how quarterbacks perform in college is not well correlated with how they perform in the pros, due to the difficulty of the competition at that next level. The same selection challenges, Gladwell notes, affect the selection of teachers; I've also experienced those challenges in working with traders at proprietary trading firms and hedge funds.

One of the great challenges in selecting successful traders is that the usual arsenal of interviews and resume reviews don't begin to tap talents (native abilities) and skills (acquired competencies). As reader Jason pointed out in his comment to my last post, practice and skill-building are necessary but not sufficient; without a base of talents, these at best will take poor performers and bring them closer to average. For instance, although I love the game of basketball and am a competent outside shooter after years of playing, I lack foot speed and jumping ability. I can hold my own in pickup games, but could never star in college--or certainly the pros.

The implications are important: you cannot select for successful traders without observing those traders trade. Just as scouts must see a quarterback play and instructors must observe teachers in the act of teaching, firms that hire traders and portfolio managers need first hand experience with those they would select. To be sure, a trading track record over years of trading and different market conditions can go a long way toward establishing skills and talents. When hiring relatively new traders, however, track records are sparse and may not be representative of trading in the big leagues, with larger risk and size.

Prop firms, as a whole, have found that it is not profitable to hire new traders, offer a dollop of training, and set them loose to figure out markets. Even when the traders are trading very small size, the fees alone for overhead (hardware, software, IT, commissions, etc.) add up and create unacceptable drawdowns before traders can gain traction and make real money. That is why we're seeing an increasing number of firms offer beefed up training, sometimes at a fee, prior to allocating proprietary capital to traders. The training period is an opportunity to observe, first hand, whether traders possess the requisite talents and skills to succeed.

I predict that this trend will continue, with many prop firms increasingly looking like professional training programs over time. Star pupils will gain the right to trade prop capital for the firm, and the training will double as a means of selection. Over time, I further predict that the best of the prop firms will become feeder organizations for hedge funds, as investors burned by buy-and-hold will demand the skill sets that are more typical of traders than portfolio managers. Indeed, if I were a forward thinking hedge fund, I'd look to take a minority financial stake in a superlative prop firm, providing the firm with more capital and resources, and providing the fund with continuous access to a talent pool.

The really good prop firms will trade well. The best, however, will become expert at finding those who trade well.
.

Can I Trade for a Living? The Quest for Trading Success

A reader who has tried for years, without success, to trade for a living consulted with a trading coach. After reading one of my articles, the reader is now questioning the coach's advice. The reader asks:

"Am I deluding myself by following his assertion that successful trading is predominantly based on mindset--and that this is the key--this is all that has been missing from my previous trading ventures? I have spent years and thousands of $'s trying to educate myself as to trading systems, books, and methods. I thought that all I really needed to do was find a trading method that suited me - (my psychological makeup), something I could follow with a degree of self-confidence...Is there any hope that this might become a possibility?"

My heart goes out to those who struggle with trading, and I cannot express the depth of my contempt for "coaches" who pander to those hopes with psychological snake oil.

Let's try an experiment: Read the first two paragraphs of this post again, but this time substitute the words "play chess" for trade and "chess playing" for trading. Now read the paragraphs again and substitute the words "play golf" for trade and "golf playing" for trading. Do it yet again, imagining that our writer is an aspiring Broadway star, and substitute the words "act" and "acting".

Of course, the re-readings sound ludicrous: we know that there is far more to success in chess, golf, and acting than "mindset" and prefab "systems, books, and methods". The missing element? Skill development. Training. A systematic program of learning that emphasizes pattern recognition, an understanding of market movement across time frames, intermarket relationships, sound execution of trade ideas, and risk management.

Mindset is critical in sustaining motivation, interest, and focus during the learning curve, and mindset is crucial in the consistent application of one's skills. The wrong frame of mind and emotional/cognitive/physical state can disrupt the best of skills, but the best of mental outlooks cannot substitute for developed skills. No positive mindframe and "method that suited me" can provide competencies--in any performance field.

So is there hope for our reader? As long as he is searching for a perfectly harmonious method that he can "follow with a degree of self-confidence", he won't be immersed in a learning curve and won't succeed as a discretionary trader. His best bet is to shop for an actual trading system that has been adequately developed and backtested and have it executed mechanically by a participating broker.

Alternatively, he could start from the ground up with observing markets and patterns, testing out trading ideas and skills in simulation mode, and making note of the markets, time frames, and patterns that come most easily and provide the greatest interest, as outlined in my trader performance book. Observing experienced traders apply their skills in online trading rooms or joining a proprietary trading firm that features sound training can also be worthwhile toward this end.

Most of all, our reader should find coaches and mentors that are more interested in guiding a career than making a sale. There are good ones out there that will shoot straight; note, for example, John Forman's recent series of questions that he answers for developing traders and the sophisticated observations of Ray Barros re: emotions and trading.

The bottom line is that the answer to successful trading cannot be found in any coach, book, or system. Success is something that is cultivated over time, with directed effort. There is hope for our reader if he can identify his strengths and systematically learn to apply them to markets that capture his interest and motivation.
.

Monday, December 22, 2008

Intermediate-Term Bond Rally: Investors Accept Risk in a ZIRP World


In a little over a week, we've seen a nice rally in intermediate-term investment grade corporate bonds (VFICX; pink line), as well as intermediate-term investment grade municipal bonds (VWITX; blue line), as falling interest rates have investors searching for relatively safe yields. During this same period, we've seen dramatic weakness in the U.S. dollar and firmness in gold. With Treasuries offering near-zero interest rates and one-year bank certificates of deposit currently averaging 2.86%, compared with the prior week's 3.22%, the search for yield is gradually taking investors further out on the risk curve--particularly retirees and baby boomers who need to replace the income they had been getting from riskless instruments. As the Fed seems unlikely to unwind its zero interest rate policy (ZIRP) any time soon, I'll be watching for signs of growing risk appetites in credit markets.
.

Indicator Update for December 22nd


Last week's indicator update suggested that we remained in a range bound market, with the low 900 region in the S&P 500 Index as resistance and the low 800 area as support. Once again, the ball was in the bull's court, the update indicated, and once again, we saw a continuation of non-trending action across most sectors, with few stocks in my basket showing decisive upside or downside movement.

One area of strength was the small cap stocks, and this showed up as firmness in the Cumulative Adjusted NYSE TICK (bottom chart) and the new 20-day highs/lows (middle chart). Although the S&P 500 Index closed its week off its highs, the broad market retained much of its strength, as we've seen a relative absence of aggressive selling pressure. At this juncture, the Cumulative Demand/Supply Index (top chart) is overbought, in a region where we normally see corrective movement to the downside. As long as we see peaks in the Cumulative DSI at successively lower price highs, it is premature to conclude that we are free of the bear's grip.

Nevertheless, seasonal tendencies are providing a measure of firmness to the indicators, with a multi-month high in the new highs/lows measure. We continue to trade within a broad range, frustrating bulls and bears alike; ultimately, I expect any continued inability of stocks to sustain a move above the 900 area resistance to lead to a test of the range lows.
.

Sunday, December 21, 2008

A Different Look at Money Flow


As readers are aware, money flow is typically calculated by calculating the dollar volume of each transaction in a stock and then adding that amount to a cumulative total if the transaction occurs on an uptick; subtracting the amount if the transaction occurs on a downtick. Money flow for an entire index would simply consist of the sum of flow numbers for the component stocks.

I decided to experiment with a different means of calculating money flow for the overall stock market. I generated the dollar volume for each minute's transactions in the ES futures (closing price times volume for that one-minute period) and multiplied that figure by the average NYSE TICK reading for that minute. I then added this figure to a cumulative total, such that the cumulative total increased when average NYSE TICK was positive and decreased when the average one-minute TICK reading was negative.

This creates a cumulative TICK measure that is weighted by dollar volume. The rationale is that the "TICK flow" will increase or decrease greatly when markets are strong/weak on high volume. By weighting NYSE TICK for market participation, we get a sense for whether large buyers or sellers are active in the market.

The chart above shows the ES futures (blue line) plotted against the cumulative TICK flow line (pink) for the past week. Note that, as the S&P 500 Index weakened late in the week, the flow line remained near its peak, suggesting persistent buying interest. This interest showed up particularly among small cap issues.

In coming weeks, I will be investigating the TICK flow measure with historical data to see if it adds value to the cumulative adjusted TICK line that I normally post each Monday AM as part of my sector review. These tweaks of indicators sometimes lead to new observations and insights that prove worthwhile; it was just such a tweaking of a momentum measure that led to my development of the Demand/Supply Index posted each morning before trading via Twitter and summarized in cumulative form in my Monday AM posts.
.

Gold and Gold Stocks Show Relative Outperformance


As this useful performance chart from the Stock Charts site indicates, gold (GLD; blue line) has considerably outperformed commodities as a whole (DBC; green line) since October. Gold and silver mining stocks (XAU; red line), meanwhile, have taken the performance lead in the past month, perhaps anticipating higher prices to come in the wake of a weakening U.S. dollar.
.

Saturday, December 20, 2008

Sector Update for December 20th

Last week's sector update found a largely range bound market. As I recently posted, the majority of stocks in the basket that I follow have not been solidly trending higher or lower. Here's how Technical Strength breaks down, sector by sector as of Friday's close:

MATERIALS: -80 (43%)
INDUSTRIAL: -100 (74%)
CONSUMER DISCRETIONARY: +100 (75%)
CONSUMER STAPLES: +60 (63%)
ENERGY: -140 (33%)
HEALTH CARE: +220 (78%)
FINANCIAL: -280 (57%)
TECHNOLOGY: -60 (74%)

What we see is that most the sectors are in neutral mode (-100 to +100), with financial shares showing the greatest weakness and health care displaying relative strength.

Next to the Technical Strength numbers (in parentheses) is the percentage of stocks in each sector trading above their 20-day moving averages, as reported by Decision Point. This gives us a longer-term perspective than Technical Strength. Notice that the commodity-related sectors, materials and energy, are displaying relative weakness, followed by financial stocks. Recessionary themes continue to impact this market.

Note: For those wanting to stay on top of these numbers, Technical Strength and percentage of S&P 500 stocks above their moving averages are updated in the morning, prior to trading days, via my Twitter feed (subscription is free).
.

Range Bound Market: A Different Look at Market Trending


I have posted in the past about my proprietary Technical Strength measure, which assesses short-term trending of stocks in a manner analogous to a goodness-of-fit regression line. In the chart above, I've taken the 40 S&P 500 stocks in my basket (five of the most highly weighted stocks within the eight sectors that I track each week) and divided them into five categories based on Technical Strength: strong uptrend, moderate uptrend, neutral (non-trend), moderate downtrend, and strong downtrend. By posting bars for Monday through Friday, we can see how the trending behavior of the basket evolved over the week.

What we see is that we began the week with more stocks in uptrends than downtrends, though no stocks were in strong uptrends and eight were in strong downtrends. The majority of issues, however, were non-trending, indicating a mixed market. By Tuesday, half of the stocks registered moderate uptrends and eight were in strong uptrends, as the S&P 500 Index broke above its 900 level of resistance. For the remainder of the week, stocks in uptrends dwindled and neutral (non-trending) stocks increased, as the S&P 500 Index fell back into its range. By Friday, the market was clearly in non-trending mode.

Distinguishing between strong and moderate uptrends/downtrends provides useful information, I find. In a solid trending market, half or more of the stocks in the basket will qualify as being in strong uptrends or downtrends. After the upside breakout early in the week, only 20% of the stocks in the basket qualified as being in a strong uptrend. I strongly suspect that similar categorical breakdowns of trending within stocks in specific sectors would provide useful data for traders.

Because I find value in this breakdown, I will post the trend category status of my basket each morning before trading days via Twitter. Subscription is free and available on my Twitter page, or you can simply read the last five posts on the blog home page under "Twitter Trader".

.

Friday, December 19, 2008

Week in Review: Small Cap Outperformance


While the large cap stocks remained range bound for the week (SPY; top chart), unable to sustain a rally above 900 in the S&P 500 futures, small cap stocks benefited from end-of-year buying (IWM; bottom chart) and closed near their highs for the week. Those small cap highs were also two month highs for the Russell 2000 Index.

Friday was the fourth consecutive trading session in which new 20-day highs exceeded 1000 among NYSE, NASDAQ, and ASE exchanges, despite the choppy trade in the large cap indexes. Small caps contributed to that strength; according to Decision Point, 73% of S&P 600 small cap stocks were trading above their 20-day moving average, compared with 69% of S&P 400 midcaps and 64% of S&P 500 large caps. While the advance-decline line specific to S&P 500 large caps is below its peak from the week of December 7th, we are at multi-week highs in the advance-decline line specific to S&P 600 small caps.

While I have found the inability of the S&P 500 Index to stay above 900 to be disappointing, the underlying strength in the broader market has limited the downside.
.

Breaking Trading Slumps by Becoming Your Own Trading Coach


Here is an email from a developing trader that I believe all of us can relate to. It offers an outstanding opportunity for self-coaching:

"Is this month's ES market so different from September? November? As you may recall, I am new at this game. I have been working my tail off training to trade the ES by trading for real, but tiny in SPY. May is when I began to develop my current approach. As I am a newbie, the approach/strategy has morphed as I learn. In my practice trading, I achieved really quite good results in the fall. I make many discretionary decisions, but my most firm rules are for risk management. So, I think there is some consistency in my approach. But I would not describe my trading as very consistent. I have disciplinary lapses, but I am learning about them all of the time and the progress is good. December's results are horrible, however. No big losses, which is my strength. I keep them pretty small. But this month, so many losers! I am just so confused about it. I am looking at the same things, thinking the same way; I am not under any more pressure than I was in the fall...What the heck is going on? Is this par for the course for a guy who has been trading the ES for 6-7 months?"

There are two major reasons for traders entering slumps: 1) changes in their life situation and/or mindset leading to their getting away from strengths and sound trading practices; 2) changes in markets, especially with respect to trend and volatility. In the first scenario, the trader changes how he/she trades and loses money. In the second scenario, the trader trades the same under different market conditions and loses money due to a failure to adapt.

Our trader asks the question whether this month's stock index market is so different from recent months. As the monthly chart above suggests, the answer is yes. December is shaping up as an inside month, with a far narrower range than prior months. If we drill down to a daily level in SPY, we find that the average high-low range has been 4.34%, down from 5.83% in November and 6.74% in October. In the last two weeks, the average daily range has been 3.89%. In short, we have lost both trending and volatility in December.

Note that our trader prides himself on having "no big losses". In the current month, however, he has had many losing trades. The first thing I would investigate as his trading coach is how often he has been getting stopped out on trades that begin as winners and how often he has been stopped out of trades that not long after would have been winners. If he has not adjusted his stop-loss levels for the changes in the market's volatility, he will wait for larger moves than ultimately materialize. The trade starts as a winner, but eventually reverses against him. If he has overadjusted to the market's reduced volatility, he would set stops too tight and lose money on normal whipsaws before the market eventually goes his way. Both are very frustrating scenarios.

The other thing I'd look for in his trading is whether he is buying strength and selling weakness in the execution of his ideas. You can get away with that in trending markets, not in range markets. Once you buy into strength or sell into weakness, you are subject to normal reversal and can be stopped out of trades with losses frequently. The more range bound the market, the more important execution becomes. You have to wait for your prices, not chase moves.

On the psychological side, it's clear from the tone of the letter that our trader is frustrated. While frustration may not have been the initial cause of the slump, it can be instrumental in sustaining the slump. I'd look for changes in the sizing and frequency of trading, as well as changes in execution, as signs that frustration might be affecting decision-making. When I am frustrated with my trading, I have learned to take time away from markets and return with a clear head. Very often, that leads to a fresh view and much better trading.

Finally, our trader asks if this is par for the course for developing traders? The answer is yes. Slumps are common, even to seasoned professionals. The key is diagnosing the slump early, reducing risk exposure before losses become serious, and instituting corrective measures. It is very common for intraday traders to lose sight of shifts in trending and volatility and fail to adapt to market conditions. This often starts a slump; frustration often keeps it going. If you drill down and look at your trades in detail--what happened before and after--patterns may very well jump out at you that point the way out of the slump. That drill down is best accomplished, however, after you've stepped back and gotten out of the frustrated mindset.

For more background on breaking trading slumps, check out this post and its links.
.

Thursday, December 18, 2008

Trading Coach Basics: Changing the Viewing and Doing

I'm in the process of indexing the new book, The Daily Trading Coach, which will be coming out in the first quarter of 2009. The following quote from the book nicely summarizes an important point in trading psychology:

"As your own trading coach, you want to use your most extreme feelings to figure out your most distorted ways of viewing yourself and your trading. If you're managing risk properly, there should be nothing overly threatening about any single trade or any single day's trading...If you are trading well--with plans built on demonstrated edges, with proper risk control--trading will have its stresses, but should not be filled with distress. Markets cannot make us feel anxious, depressed, or angry; the threat lies in how we view our market outcomes" (p. 168).

All of us, in our perception and thought, see the world through the lenses of personal experience, just as a person might see things through a set of glasses. When we react extremely to trading, the problem is often in the lenses, not the markets themselves. We become too attached to winning, too afraid of losing, too insistent that markets behave the way we want; all of these impose distortions in our views of our performance. In such situations, what we need is a new set of lenses, a change of prescription--not a frantic search for ever more perfect indicators and systems.

So often, changing our doing begins with changing our viewing. But the reverse is equally common: we engage in new doing and that leads to fresh views. The latter is a big part of what self-coaching is all about: challenging old ways of thinking and opening yourself to new experiences, new ways of experiencing yourself. Too often, we hope to change the mind in hopes that it will change our behavior. In reality, the arrow of causation is reversed: in generating new experiences, we change how we see self and world. You don't just become more confident and then trade better; you learn to trade better, and that brings confidence.
.

Joining a Proprietary (Prop) Trading Firm: Should I Pay to Play?

In the last few weeks, I've received an increased number of emails from traders interested in joining proprietary trading firms. This is particularly the case, given the growing number of prop firms that are offering training programs for their traders. For those considering joining prop firms, I recommend you review the posts on training at prop firms and prop firms, arcades, and scams. Both posts offer a few things to look for and think about when you investigate various firms.

In Illinois, where I live, we're all too familiar with "pay-to-play", thanks to allegations surrounding our governor. I'm skeptical as well of pay-to-play models of proprietary trading: models in which you must pay hefty training fees to begin trading small amounts of capital for the firm. It's not that the model can't be executed professionally and responsibly; I think there are firms accomplishing just that. But it's a model that is ripe for abuse, as what are really schools for traders can masquerade as prop firms by doling out small amounts of capital and then shutting down traders before they lose as much money as they poured into training.

This is especially the case for firms that train traders to trade very actively ("scalping"), but make money from commissions charged per trade. By starting traders out with a small stake, the traders will be very likely to lose their money in commissions during their learning curve, so that what the firm gives in capital with one hand, it can take back with the other in commissions and other "desk" fees.

So please engage in due diligence before sinking time, money, and effort into a proprietary trading firm. There are some very good, very professional ones out there, but with the growth of pay-to-play models, there will be some snakes in the grass, as well.
.

Wednesday, December 17, 2008

Quantitative Wheezing: The Difficult Search for Yield


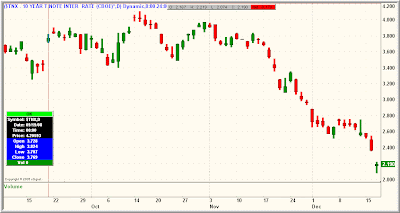
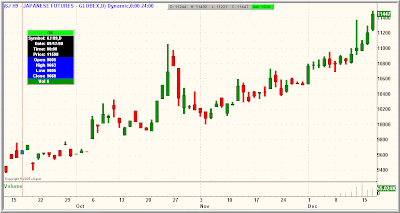
It seems as though the post on competitive devaluation of the U.S. dollar was a bit more timely than even I expected. Ten year Treasury rates have absolutely collapsed (top chart) in the wake of announced Fed policy. As a result, the euro (middle chart) has soared about 10% versus the dollar in the past five trading sessions alone. The yen (bottom chart) is now trading at 13+ year highs versus the dollar. Gold, meanwhile, is trading at its highest level since early October.

In the wake of these events, I talked with a bank president yesterday, who was unusually candid. His bank was lowering its CD rates because it didn't need to attract more capital. Why? It is difficult to find creditworthy lending projects. The bank isn't keen to lend money for real estate-related loans, and the business climate is hardly looking good for expansion.

As Mish points out, banks can borrow money essential for free from the Fed and simply stash it at higher interest rates further out on the yield curve. Making money cheaper doesn't necessarily increasing the incentives for banks to lend. Meanwhile, I talked with representatives from two large brokerage firms, both of whom confirmed that their inventory of longer-term certificates of deposit (more than 3 years) had been completely bought out.

Retirees are going to be facing an interesting dilemma in 2009: accept government guarantees with Treasuries, CDs, etc. and face paltry yields or accept greater risk as well as return in the corporate and municipal bond markets. I notice we had a good pop in price for investment grade corporates (LQD) and municipals (TFI) today; perhaps those yields are looking jucier in a zero interest rate world. Of course, all those returns are denominated in U.S. dollars and, hidden to average investors, is the dollar devaluation of their accounts in the past week.
.

Constructing and Interpreting the Cumulative Adjusted NYSE TICK

My recent post explained the construction of the NYSE TICK and related measures of short-term sentiment. Most uses of TICK are intraday, as a way of gauging whether buyers or sellers are gaining the upper hand on short-term moves. I've used short-term oscillators of the NYSE TICK of 10-20 minutes as a way of smoothing out one-minute values. I find the peaks and valleys helpful in execution, as I want to buy on countertrend dips in the TICK oscillator and sell on countertrend bounces.

Some years ago, I decided to create a cumulative line of one-minute TICK values as a way of gauging longer-term buying and selling interest. Each one minute reading was the average of that minute's high, low, and close TICK values. I added the one-minute average readings to a cumulative total, as one would do for an advance-decline line.

What I found was that the NYSE TICK, as a distribution, did not have a perfect zero mean. There was a positive bias to the series. That bias has since been reduced by the elimination of the uptick rule for short-selling. Still, at any given time, the mean of TICK values will depart from zero. This gave the cumulative TICK line a bias in slope, particularly over the long-term.

Thus began my efforts to adjust the cumulative TICK to create a zero mean. The solution I arrived at was to calculate the average one-minute TICK reading for the past 20 days (a roughly 7900 period moving average of the one-minute high, low, close average values) and subtract that moving 20-day average from each subsequent one-minute H-L-C TICK value. I called this the Adjusted TICK.

What the Adjusted TICK is telling you is whether the current TICK values are stronger or weaker than the average over the past 20 days. This tells us whether markets are gaining or losing buying/selling interest relative to their recent past. In a sense, we can think of this as relative sentiment: the degree to which short-term sentiment is departing from what we've seen over the past month.

When we cumulate these Adjusted TICK values, the resulting line is quite helpful in providing a picture of changes in market sentiment. If buyers or sellers are quite dominant, we'll see a sharp rise or fall in slope of the line. If we're range bound, we'll tend to see a flattening of the line. Divergences between price and the cumulative line suggest that buying or selling pressure may be waning over time, which has me looking for possible reversal.

I use the day's Cumulative Adjusted TICK (starting each day at zero) as a trend indicator; most my intraday trades will be in the direction of the TICK line. I also use breakouts in the TICK to validate price breakouts from ranges. Many of my past posts illustrate these concepts.

I don't know of any software that charts the Cumulative Adjusted TICK for you. Market Tells follows the indicator closely and utilizes it in its helpful newsletter and intraday trend-following service. For more intrepid sorts, the NeoTicker program enables you to create TICK indicators for any basket of stocks, sector, or index.

My own calculation of the indicator utilizes data from e-Signal, archived and charted within Excel. If the adjustment feature isn't crucial for you, you can simply observe how much time a moving average of TICK spends above and below the zero level during the day as a rough way of eyeballing the trend of sentiment. Together with the indicators I track weekly on the blog and that I post each morning before trading days via Twitter, I find the Cumulative TICK invaluable in keeping me on the right side of the market.
.

Tuesday, December 16, 2008

Three Stock Picking Resources on the Web

Here are several resources that might be of interest in selecting stocks for trading or investment:

Alpha Clone - This is a new site that pulls stock holding information from the filings of money managers, so that you can see what the pros are investing in. You can calculate performance metrics for various portfolios and "clone" the strategies used by your favorite investors, such as Warren Buffett. The site is offering a free guest pass to interested traders;

StockPickr - This site includes stock selections from both professional money managers and a community of users. One very nice feature for active traders features trading systems, including system trades of the day. There are spotlight portfolios that highlight specific themes and updated lists of top rated portfolios;

StockScouter - This site from MSN rates stocks across both fundamental and technical criteria, creating a 1 -10 rating system. You can follow a portfolio of the top ten rated stocks or create your own portfolios from the ratings. The site also features portfolios from MSN Money contributors and categorizes top rated stocks by sector;

If you have other favorite stock-picking tools, please share them in a comment to this post.
*

A NYSE TICK Primer: How to Assess Intraday Sentiment

Although I've posted details in the past, I decided to respond to recent questions about the construction of the Cumulative Adjusted NYSE TICK with two dedicated blog posts. This post will explain the basics of the NYSE TICK. The second will explain my use of the Cumulative Adjusted TICK. For those interested, here is a link to many past posts on the topic of the TICK, many of which explain how I use the indicator in intraday trading.

So let's start at the start. In an auction market, we have buyers who would like to acquire stock at a relatively low price and sellers who would like to part with their stock at a relatively high price. When all buyers and sellers are assembled in the marketplace, we have an established bid price for the stock (the highest price that buyers will pay) and an established offer price (the lowest price that sellers will accept). The spread between the bid and offer will be quite narrow for actively traded issues; wider for less liquid instruments. Market makers provide liquidity to the market by actively buying bids and selling offers, profiting from the spread.

A patient buyer will work an order in the book below the prevailing price, bidding for the stock or futures contract at a price that he/she considers to be a good value. A patient seller will work an order above the prevailing price, offering the stock at a price that he/she considers to be a good value. As a result, there are always resting orders above and below the market. The number and volume of these orders, arrayed by price, is what is known as depth of market. Market makers and true scalpers (those whose trades last a minute or so or less) often rely on shifts in depth of market to identify when the market is skewed toward buyers or sellers.

If a buyer is not patient and feels that the market is headed higher right now, he/she will not work a bid below the market. Rather, they will "lift the offer": they'll place a market order and accept the best price offered by a seller. When this occurs, the stock or futures contract will typically trade on an uptick, at the offer price in the bid-offer matrix. The motivated seller thinks the market is primed to move lower right now and "hits the bid", accepting the best price offered by a buyer. This transaction will occur on a downtick, at the bid price in the bid-offer matrix.

Over time, we can look at how many transactions across all stocks occur on upticks versus downticks as a way of assessing whether buyers or sellers are more motivated. This statistic is called the NYSE TICK. It is calculated by the exchange 10 times per minute (every six seconds), typically under the symbol $TICK. A TICK value of +500 means that 500 more stocks traded on upticks than downticks in the most recent six second period; -500 would mean that 500 more issues traded on downticks than upticks. We can track changes in the TICK over time to see whether buyers or sellers are becoming more aggressive on a short-term basis.

A different view of very short-term sentiment is Market Delta. Instead of looking across a range of stocks to see how many are trading on upticks versus downticks, it calculates the volume of shares or futures contracts traded at the market bid versus offer for a single instrument. This is very helpful when the instrument may be imperfectly correlated to the broad stock market. Many times, for instance, we can see a neutral Market Delta reading in the ES futures when NYSE TICK is quite positive or negative. Most often, this means that sentiment is neutral among large cap issues, but more positive or negative among the large number of small cap issues that are part of the NYSE TICK universe.

Finally, we can use the same logic as TICK to construct measures of money flow. We multiply the price of the stock or futures contract times the volume traded for each transaction. This gives us the dollar volume of the transaction. If the transaction occurred on an uptick, we add the dollar volume to a cumulative total; if it occurred on a downtick, we subtract the dollar volume from the cumulative total. This money flow measure identifies whether large market participants (those trading larger volumes) are predominantly lifting offers or hitting bids.

These are among my favorite market indicators, because they are grounded in the actual auction market behavior of participants. They do not rely upon esoteric interpretations of chart patterns, oscillator readings, or market waves. The minute-to-minute readings of TICK and Market Delta help intraday traders understand whether markets are becoming stronger or weaker. When we cumulate these readings over time, we can assess sentiment shifts over longer time frames.

In my next post in this series, we'll look at how you can cumulate the NYSE TICK and use the data for an understanding of market trends. Please note that I update the Cumulative Adjusted NYSE TICK every Monday in my weekly indicators post; I post money flow numbers for the Dow stocks each morning prior to the start of trading days via Twitter.
.