
Dear Blog Readers,
I continue to receive positive comments about the market updates from last month, in which I posted observations about market participation (who is in the market), trends/ranges, sentiment, and volume distribution in real time. (Here's an example). The goal of these updates was to encourage short-term traders to think about markets in new ways, integrate historical research, and find ways of trading with an edge based upon hard market data.
Having taken on a new writing project, I am no longer able to conduct the updates on a daily basis. Because of the continued interest of readers, however, I'm starting an occasional feature that I'm calling "A Morning With the Doc". On those days, I will share my market homework and and track the market in real time with periodic updates on the blog. If I have positions in the market (which I don't every day), I will make these known and will share the rationale for those positions.
When I was supervising psychiatry residents and psychology interns at a medical school in Syracuse, I found that the most effective means of supervision was to have the young professionals sit in the office with me and help me conduct my therapy sessions. They got to see me work and I got to see their efforts. To my surprise (and delight), they learned as much from my mistakes as from my successes--and I became a better therapist just by knowing that my every action would have to be explained.
So let's try it out with trading. I'll make some great observations and trades and some pretty bad ones. If we're lucky, we'll learn from each other and from the experience.
The first Morning With the Doc will be this Wednesday, October 18th with postings before the market open. The focus will be the S&P 500 Index trading, but I will be referring to the NASDAQ and Russell as well and will be tracking key sectors. The Morning should be relevant for day timeframe traders who follow either the index futures or ETFs. As always, there will be no registration and no fee.
Look forward to having you there. Details will follow on the Trading Psychology Weblog.
Friday, October 13, 2006
Is a Rising Market Due for a Fall--Or Not At All?
Many traders have been bemused by the equity markets' recent strength. There have been regular observations of an "overbought" market, only to see that market become still more "overbought". When is a rising market part of an ongoing trend, and when is it about to end?
One rough guideline that I track in the Trading Psychology Weblog is the proportion of S&P 500 stocks trading above their 50-day moving averages. This proportion tends to peak ahead of price peaks--and in recent years, it has had to reach at least 80% to make a peak. Throughout the recent market rise, that proportion has been growing. It now stands at about 84%.
A more direct way to measure market momentum is to examine the size of price moves and what typically occurs after large vs. moderate rises. Going back to 1990 (N = 4173 trading days), we've had 475 occasions in which the S&P 500 Index ($SPX) has made a 60-day price high. Sixty days after that, the market has risen by an average of 2.26% (325 up, 150 down). That is no different from the average 60-day price change of 2.19% (2835 up, 1338 down) for the sample overall. In other words, just because a market has made a 60-day high doesn't mean it's overextended. Its prospects are no different from average.
But wait. Let's divide our sample of 60-day highs in half based on the number of stocks making 52-week new highs at the end of the rise. When the 60-day high occurs with a relatively strong market participation of over 180 new highs (N = 238), the next sixty days in $SPX average a gain of 3.26% (187 up, 48 down)--a nice outperformance. When the 60-day high occurs with a relatively weak participation of under 180 new highs (N = 237), the next sixty days in $SPX average a gain of only 1.26% (138 up, 99 down)--a notable underperformance. This fits other findings from my research, including the findings regarding the proportion of stocks above their moving averages: The broader the market momentum during a rise, the more likely it is to persist in the following time frame.
Some rising tides lift all boats; others do not. That's one way we can handicap the odds of the tides coming in--or rising yet further. Having made a 60-day high on Thursday with over 300 new highs, it is difficult to make a case based on recent historical precedent that the market has become more vulnerable to decline.
One rough guideline that I track in the Trading Psychology Weblog is the proportion of S&P 500 stocks trading above their 50-day moving averages. This proportion tends to peak ahead of price peaks--and in recent years, it has had to reach at least 80% to make a peak. Throughout the recent market rise, that proportion has been growing. It now stands at about 84%.
A more direct way to measure market momentum is to examine the size of price moves and what typically occurs after large vs. moderate rises. Going back to 1990 (N = 4173 trading days), we've had 475 occasions in which the S&P 500 Index ($SPX) has made a 60-day price high. Sixty days after that, the market has risen by an average of 2.26% (325 up, 150 down). That is no different from the average 60-day price change of 2.19% (2835 up, 1338 down) for the sample overall. In other words, just because a market has made a 60-day high doesn't mean it's overextended. Its prospects are no different from average.
But wait. Let's divide our sample of 60-day highs in half based on the number of stocks making 52-week new highs at the end of the rise. When the 60-day high occurs with a relatively strong market participation of over 180 new highs (N = 238), the next sixty days in $SPX average a gain of 3.26% (187 up, 48 down)--a nice outperformance. When the 60-day high occurs with a relatively weak participation of under 180 new highs (N = 237), the next sixty days in $SPX average a gain of only 1.26% (138 up, 99 down)--a notable underperformance. This fits other findings from my research, including the findings regarding the proportion of stocks above their moving averages: The broader the market momentum during a rise, the more likely it is to persist in the following time frame.
Some rising tides lift all boats; others do not. That's one way we can handicap the odds of the tides coming in--or rising yet further. Having made a 60-day high on Thursday with over 300 new highs, it is difficult to make a case based on recent historical precedent that the market has become more vulnerable to decline.


Thursday, October 12, 2006
When Selling Becomes Extreme: What Does It Bring?
Readers of this blog know that I rely upon the NYSE TICK as a short-term measure of market sentiment. Most of my studies have focused on the Cumulative TICK and momentum effects in the market, as well as patterns in the distribution of TICK values intraday. In this post, however, we'll examine the importance of single, extreme readings in the TICK.
On Wednesday, in the wake of selling on the release of the Fed minutes, we hit an NYSE TICK reading below -1200. This suggests very broad selling, with more than 1200 issues trading at their bid price vs. their offer. When selling becomes that extreme, what tends to come next?
Since 2004 (N = 695 trading days), we've only had 50 days in which the NYSE TICK has gone below -1100. Two days later, the S&P 500 Index (SPY) is up on average .37% (31 up, 19 down). That is quite a bit stronger than the average two-day gain of .06% (367 up, 328 down) for the entire sample.
Conversely, when the daily NYSE TICK never goes below -500 (N = 45), the next two days in SPY average a loss of -.14% (21 up, 29 down), notably weaker than average.
In other words, extreme selling seems to be bullish; the absence of extreme selling brings subnormal returns. Panic selling, in particular, tends to produce short-term trading opportunities.
Interestingly, on the panic selling days, if there is not a significant *buying* episode that day--an NYSE TICK reading stronger than +1100--the next day in SPY averages a *loss* of -.12% (11 up, 13 down). If there is a strong buying period on a day that features panic selling, the next day in SPY averages a next day gain of .54% (19 up, 7 down).
Extreme selling by itself cannot create a bull move. It's when panic selling draws in buyers--something we did on Wednesday--that short-term returns tend to be favorable. Average NYSE TICK readings are summarized daily on the Trading Psychology Weblog; going forward, I will also flag daily extremes.
On Wednesday, in the wake of selling on the release of the Fed minutes, we hit an NYSE TICK reading below -1200. This suggests very broad selling, with more than 1200 issues trading at their bid price vs. their offer. When selling becomes that extreme, what tends to come next?
Since 2004 (N = 695 trading days), we've only had 50 days in which the NYSE TICK has gone below -1100. Two days later, the S&P 500 Index (SPY) is up on average .37% (31 up, 19 down). That is quite a bit stronger than the average two-day gain of .06% (367 up, 328 down) for the entire sample.
Conversely, when the daily NYSE TICK never goes below -500 (N = 45), the next two days in SPY average a loss of -.14% (21 up, 29 down), notably weaker than average.
In other words, extreme selling seems to be bullish; the absence of extreme selling brings subnormal returns. Panic selling, in particular, tends to produce short-term trading opportunities.
Interestingly, on the panic selling days, if there is not a significant *buying* episode that day--an NYSE TICK reading stronger than +1100--the next day in SPY averages a *loss* of -.12% (11 up, 13 down). If there is a strong buying period on a day that features panic selling, the next day in SPY averages a next day gain of .54% (19 up, 7 down).
Extreme selling by itself cannot create a bull move. It's when panic selling draws in buyers--something we did on Wednesday--that short-term returns tend to be favorable. Average NYSE TICK readings are summarized daily on the Trading Psychology Weblog; going forward, I will also flag daily extremes.
Wednesday, October 11, 2006
Putting the Market on the Shrink's Couch
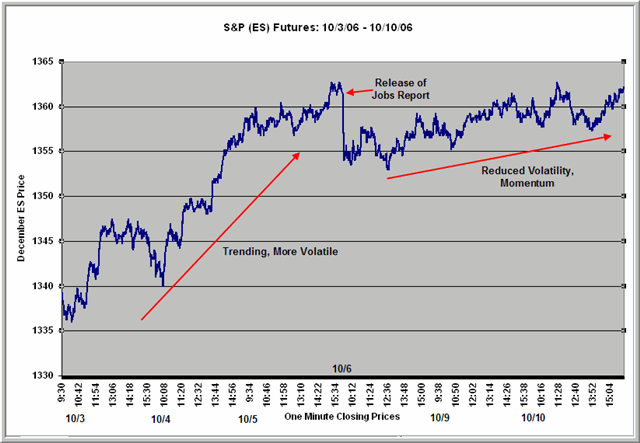
How does a psychoanalyst analyze a patient? Contrary to popular image, it takes a bit more than sitting behind a couch, puffing a pipe, and giving occasional prods to, "Tell me more about that." What the analyst is doing is sampling streams of conversation from the patient, listening for tone and meaning, and gaining an appreciation for how those meanings are changing over time. This is particularly important after a major life event: very often before and after samples of a person's speech will reveal precisely how that event is being processed and how it has affected the individual.
So it is with markets. We sample one-minute streams of price and volume data and get a sense for where traders and investors place value, how those placements are shifting, and whether those estimates are relatively stable or volatile. By tracking market data streams before and after a major economic release, we can put the market on the couch and gain some insight for how investors are reading the tea leaves.
The chart above displays the S&P 500 (ES) futures three days prior to and three days after the release of the jobs data on 10/6/06. What we see is that the character of the market changed significantly following the release. Where we had been trending upward, we now entered a choppy trading range. Where the market had traded with reasonable volatility (the standard deviation of prices before the release was 7.53) prior to the release, volatility waned (standard deviation of prices of 2.06) after the release.
Prior to the release, on 10/4, I counted 794 stocks that closed above the volatility envelope surrounding their 20-day moving averages. Only 123 issues closed below their envelopes. The respective numbers on 10/5 were 494 and 154. For the three days following the release, only 188, 314, and 284 stocks closed above those envelopes, but 387, 198, and 259 closed below. In short, upside momentum among individual equities has waned since the jobs data.
And what's been happening in other markets during this transition? For the three days prior to the release, the yield on the 10-year note dipped from 4.616% to 4.608%. During the three days after, yields have climbed to 4.748%. The Euro, which moved narrowly against the dollar in the three days before the release, has steadily moved lower (i.e., the dollar has appreciated) from 1.27650 to 1.25880.
What might market shrinks conclude? Perhaps this: The markets have interpreted the jobs numbers as signs of economic strength. They were less taken with the modest increase in jobs reported and more impressed by the 50% upward revision of the prior data. With the indication of strength, expectations of Fed easing were reduced, rates backed up, and this helped support the dollar. Stocks, however, have not found additional buyers in the face of rising rates and a firmer dollar. Interestingly, the average one-minute volume in those S&P 500 futures has been about a third lower (2532 vs 1765) after the release compared with after. The average NYSE TICK reading before the release (showing how many stocks at each moment are upticking vs. downticking) dropped from 343 to 264.
Yes, the presence of a holiday might account for some of this, but somehow I think traders could have mustered more enthusiasm had they loved the jobs data. When a patient's stream of conversation changes after an event, the analyst concludes that the event has special meaning and impact. This creates a window into the mind of the individual. This market shrink looks at the jobs data release and finds a similar window into the mind of the market.
Tuesday, October 10, 2006
Due Diligence: Who Would You Hire to Manage Your Funds?
Imagine the following scenario inspired by a recent Wall St. Journal article:
You've amassed a reasonable nest egg for retirement, but you need someone to guide its investment. Your goal is to achieve a respectable return on your money without taking large risks. There are many money managers desirous of your business, so you decide to put together a set of interview questions to see who you like best.
After considerable thought, you arrive at the following four questions:
1) Why should I place my money with you? Show me, in your historical testing of your strategies and in your real-time performance, how you obtain returns that are in excess of what I could obtain in riskless investments or in simple buy-and-hold stock and bond strategies.
2) Diversification has been called the one "free lunch" available to investors. How do you utilize diversification to achieve superior risk-adjusted returns? How do your returns correlate with those available in the stock and bond markets?
3) Show me data on how your strategies perform under different market conditions, the drawdowns I can expect, as well as the flat periods of performance.
4) Markets are constantly changing. What, specifically, are you doing to stay ahead of the curve? What major changes have you made recently to adapt to market conditions and how do you track the success of those changes?
Your questions in hand, you're now ready to begin your interviews prior to obtaining references from satisfied clients.
Your first money manager interviewee comes through the door.
It's you.
You are applying for the job of managing your own money.
You have to answer your own questions and justify why you deserve the business.
Would you hire you to manage your money? If someone else identical to you--you with your work ethic, your objective trading/investing results, your strategies, and your interview responses--approached you to manage your funds, would you turn your money over to him or her?
If your answer is yes, congratulations. If no, what steps do you need to take to become worthy of your own business--or, as someone trading/investing your own capital, are you in the wrong business altogether?
You've amassed a reasonable nest egg for retirement, but you need someone to guide its investment. Your goal is to achieve a respectable return on your money without taking large risks. There are many money managers desirous of your business, so you decide to put together a set of interview questions to see who you like best.
After considerable thought, you arrive at the following four questions:
1) Why should I place my money with you? Show me, in your historical testing of your strategies and in your real-time performance, how you obtain returns that are in excess of what I could obtain in riskless investments or in simple buy-and-hold stock and bond strategies.
2) Diversification has been called the one "free lunch" available to investors. How do you utilize diversification to achieve superior risk-adjusted returns? How do your returns correlate with those available in the stock and bond markets?
3) Show me data on how your strategies perform under different market conditions, the drawdowns I can expect, as well as the flat periods of performance.
4) Markets are constantly changing. What, specifically, are you doing to stay ahead of the curve? What major changes have you made recently to adapt to market conditions and how do you track the success of those changes?
Your questions in hand, you're now ready to begin your interviews prior to obtaining references from satisfied clients.
Your first money manager interviewee comes through the door.
It's you.
You are applying for the job of managing your own money.
You have to answer your own questions and justify why you deserve the business.
Would you hire you to manage your money? If someone else identical to you--you with your work ethic, your objective trading/investing results, your strategies, and your interview responses--approached you to manage your funds, would you turn your money over to him or her?
If your answer is yes, congratulations. If no, what steps do you need to take to become worthy of your own business--or, as someone trading/investing your own capital, are you in the wrong business altogether?
Monday, October 09, 2006
Tracking the Large Trader

In my post on the structure of market reversals, I presented a common sequence of price and volume events that occur at market transitions. This sequence--and the notion of transitional structures as patterns that present themselves at multiple time frames--was also elaborated in my recent Webinar.
In the chart above, we see a transitional structure from Friday's market. Notice the distinct elements: the momentum extreme featuring high volume and a high proportion of trade at the market bid; further selling and a price low on lower volume and more modest downside momentum; a significant bounce from the price lows and then an exhaustion of sellers, who can no longer push the market to new lows; and finally a reversal and influx of buyers.
What makes the Market Delta chart above unique, however, is that the volume data are derived solely from trades of 100 contracts and more. Indeed, the numbers in the bars are not volume at all, but rather the number of large trades that are being transacted. While not all large traders necessarily transact their business in such large increments, we can rest assured that small traders are not flinging hundred-lots around. By printing only trades from large traders and seeing whether those trades--and only those trades--are predominantly occurring at the bid price or at the offer, we can see in a rather transparent way whether large traders are aggressive to the buy or sell side.
Two pieces of data from the chart are important:
1) In the exhaustion phase, note how there was an influx of large trades hitting the market bid. When this selling could not push the market to new lows, those large traders had to cover their shorts, contributing to the subsequent runup. Finding spots where large traders are pushing the market one way and cannot succeed very often produces useful short-term countertrend trades;
2) After the runup, also notice how the number of large trades expanded, with many occurring on the bid. This influx of large sellers is common at short-term market tops and can aid order-flow oriented traders in taking profits (or at least in not jumping aboard the tail ends of moves).
Finally, to amplify a recent comment from the Weblog, since volume is so well-correlated with volatility, tracking the number of large trades in the market gives us some idea of the short-term opportunity for the day timeframe trader. We can readily see large traders enter and leave the markets and we can note the price levels at which they shift their participation.
If less than 10% of all trades control over 90% of all volume, why not focus on those and separate signal from noise? One of my current research projects is constructing market indicators derived solely from large trade data. I hope to report more in coming weeks.
Sunday, October 08, 2006
Who Controls the Markets?
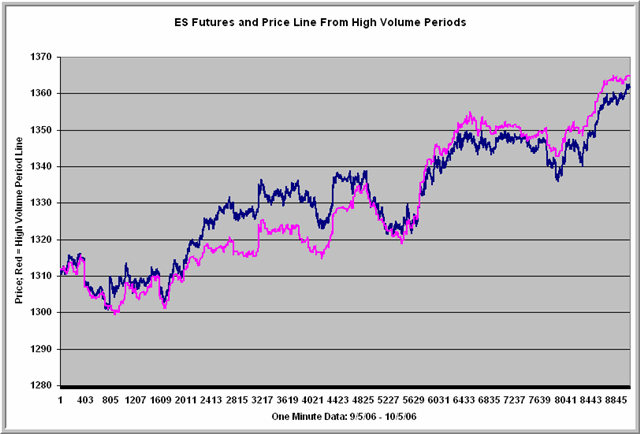
In my posts, I have frequently emphasized that large market participants dominate the equity index markets and control its movement. My trade-by-trade analysis suggests that the largest 3-4% of trades (those over 100-200 contracts each in ES) account for well over half of the total volume in that market. Because volume correlates very highly with price volatility, the presence or absence of large traders in the marketplace is an important determinant of opportunity for the intraday trader.
Above we have a demonstration of how size controls the markets. The chart represents the S&P emini futures (blue line) over the past month. The red line is a cumulation of the ES price changes over the month that included only those one-minute periods that traded on twice (or more) the average volume expected for that time of day. In other words, the red line is price change solely attributable to time periods in which size has hit the market. These high volume occasions accounted for only about 11% of the minutes in the trading day.
The two lines correlate almost perfectly: .96. Essentially all of the movement in the ES can be accounted for by the small number of periods in which large participants have entered the market. When large locals and institutions are not in the market, the market--for all practical purposes--goes nowhere.
Many market indicators and technical analysis formulations treat each time period during the day as equivalent. An alternative--and promising--strategy is to separate signal from noise by analyzing only those time periods in which large participants are present.
My data suggest that fully half of all ES trades are one and two lots that only account for 3% of total market volume. In a very real sense, over half of everything that occurs in the equity indices doesn't matter. The key is focusing on the trades--and traders--who do move the markets.
Saturday, October 07, 2006
Narrative Complexity and the Trader
Human beings organize a great deal of their experience into narrative structures. When we're asked to provide a detailed biography, we "tell the story" of our lives, connecting events temporally (my childhood, my college years) and thematically (struggles, successes, personal life, career). Cultures were making sense of their worlds through myth and fable long before science was institutionalized; sit around the dinner table long enough at a reunion and you'll hear the narratives that affirm who we are and where we've come from.
An interesting social science experiment years ago asked people to watch a computer screen depicting moving colored shapes and then describe what they saw. To the investigators' surprise, subjects invented narratives to explain their observations, attributing human attributes (aggressiveness, shyness) to the moving forms. Narratives provide coherence to our experience and enable us to make sense of events--even (or perhaps especially) when we are confronted with life's randomness.
A depressed person is one who becomes trapped in his or her own narrative of inadequacy, just as the anxious person's stories are dominated by threat and danger. Our narratives become lenses through which we view the world, essential parts of ourselves. Countries will go to war over differing accounts of the world's origin and nature of the Deity; their leaders expend considerable resources to shape the narrative structures of those they lead. Diplomacy is the art of co-constructing mutually satisfying world views; the therapist is one who helps the unhappy person organize his or her experience in ways that are more enhancing to self and others. Couples tell very different stories about each other before and after successful counseling.
Swiss psychologist Jean Piaget recognized that the "schemas" that organize our perceptions grow in complexity as we develop from childhood into adolescence and adulthood. We test our narrative accounts against reality, revising and enriching as needed. What we value in the greatest novelists is the ability to create complex and revealing narratives that embrace many facets of experience. When narratives lack such complexity, they become cartoons: the very essence of simple-mindedness.
Novice traders are like Piaget's children. When I first started following markets, I focused on price and price configurations, creating such narratives as, "We just made a double top; we're heading lower." With (painful) experience, I learned that volume was an important element in ascertaining demand and supply and expanded the narrative to include how volume was expanding or contracting with price movement. Still later, I reorganized my accounts of price and volume into a narrative of auctions and began to see how markets move toward and away from complexes of price and volume that determine "value".
When I joined a professional trading firm, I learned that not all volume is created equal. I learned to differentiate volume coming from locals and those coming from institutions. I learned to identify and track the largest volume participants in the markets, because they would ultimately control whether trade moved in mean-reverting or trending ways. Still, that wasn't enough. I found that I had to break large volume down into arb/program trading and directional trading to truly understand participation in the marketplace. I had to learn intermarket relationships, in which different markets and sectors impact one another.
Now, when you ask me what is going on in the markets, I won't say anything about double tops. I will give a detailed narrative account of how we're trading relative to value at various time frames, what institutions and locals are doing, which regimes (themes) are dominating the market, and whether trade is dominated by arb and countertrend participants or by directional traders. Years from now, my hope is that my market narratives are richer still, just a bit closer to the complexity embodied by markets.
The idea is not complexity for complexity's sake. Indeed, the function of narrative is to package complicated realities into readily understood accounts. Creating simple narratives that guide market understanding and decision making--and ensuring that those simple narratives are not simplistic ones--is a large part of the trader's developmental process.
An interesting social science experiment years ago asked people to watch a computer screen depicting moving colored shapes and then describe what they saw. To the investigators' surprise, subjects invented narratives to explain their observations, attributing human attributes (aggressiveness, shyness) to the moving forms. Narratives provide coherence to our experience and enable us to make sense of events--even (or perhaps especially) when we are confronted with life's randomness.
A depressed person is one who becomes trapped in his or her own narrative of inadequacy, just as the anxious person's stories are dominated by threat and danger. Our narratives become lenses through which we view the world, essential parts of ourselves. Countries will go to war over differing accounts of the world's origin and nature of the Deity; their leaders expend considerable resources to shape the narrative structures of those they lead. Diplomacy is the art of co-constructing mutually satisfying world views; the therapist is one who helps the unhappy person organize his or her experience in ways that are more enhancing to self and others. Couples tell very different stories about each other before and after successful counseling.
Swiss psychologist Jean Piaget recognized that the "schemas" that organize our perceptions grow in complexity as we develop from childhood into adolescence and adulthood. We test our narrative accounts against reality, revising and enriching as needed. What we value in the greatest novelists is the ability to create complex and revealing narratives that embrace many facets of experience. When narratives lack such complexity, they become cartoons: the very essence of simple-mindedness.
Novice traders are like Piaget's children. When I first started following markets, I focused on price and price configurations, creating such narratives as, "We just made a double top; we're heading lower." With (painful) experience, I learned that volume was an important element in ascertaining demand and supply and expanded the narrative to include how volume was expanding or contracting with price movement. Still later, I reorganized my accounts of price and volume into a narrative of auctions and began to see how markets move toward and away from complexes of price and volume that determine "value".
When I joined a professional trading firm, I learned that not all volume is created equal. I learned to differentiate volume coming from locals and those coming from institutions. I learned to identify and track the largest volume participants in the markets, because they would ultimately control whether trade moved in mean-reverting or trending ways. Still, that wasn't enough. I found that I had to break large volume down into arb/program trading and directional trading to truly understand participation in the marketplace. I had to learn intermarket relationships, in which different markets and sectors impact one another.
Now, when you ask me what is going on in the markets, I won't say anything about double tops. I will give a detailed narrative account of how we're trading relative to value at various time frames, what institutions and locals are doing, which regimes (themes) are dominating the market, and whether trade is dominated by arb and countertrend participants or by directional traders. Years from now, my hope is that my market narratives are richer still, just a bit closer to the complexity embodied by markets.
The idea is not complexity for complexity's sake. Indeed, the function of narrative is to package complicated realities into readily understood accounts. Creating simple narratives that guide market understanding and decision making--and ensuring that those simple narratives are not simplistic ones--is a large part of the trader's developmental process.
Friday, October 06, 2006
When is a Really Great Time to Buy Stocks?
The quick answer is when no one else is buying them.
Suppose we measure the number of NYSE, NASDAQ, and Amex stocks making fresh 65-day highs during each trading day. Since 2004 (N = 675 days), when fewer than 150 stocks across all the exchanges are making 65-day highs (N = 69), the next 20 days in the S&P 500 Index (SPY) average a gain of 1.77% (51 up, 18 down). That is a considerably more favorable return than the average 20-day gain of .49% (415 up, 260 down) for the entire sample.
How about when everyone is buying, however? On Thursday, we had 1157 stocks across the exchanges make fresh 65-day highs. Since 2004, when we've had 1000 or more 65-day highs (N = 61), the next five days in SPY have averaged a loss of -.03% (30 up, 31 down). That's weaker than the average five-day gain of .12% (372 up, 303 down) for the sample overall. By 20 days out, however, SPY was up on average by .56% (43 up, 18 down)--a very respectable win:loss ratio.
In short, when no one is buying turns out to be a great time to look at stocks, but returns are respectable when everyone is buying. We typically see some pullback in the near term after a period of popularity, but over a 20-day period returns are quite good. The notion that "overbought" markets are due for scary corrections does not hold water. Rather, it seems as though upside momentum tends to persist over an intermediate-term time frame.
Suppose we measure the number of NYSE, NASDAQ, and Amex stocks making fresh 65-day highs during each trading day. Since 2004 (N = 675 days), when fewer than 150 stocks across all the exchanges are making 65-day highs (N = 69), the next 20 days in the S&P 500 Index (SPY) average a gain of 1.77% (51 up, 18 down). That is a considerably more favorable return than the average 20-day gain of .49% (415 up, 260 down) for the entire sample.
How about when everyone is buying, however? On Thursday, we had 1157 stocks across the exchanges make fresh 65-day highs. Since 2004, when we've had 1000 or more 65-day highs (N = 61), the next five days in SPY have averaged a loss of -.03% (30 up, 31 down). That's weaker than the average five-day gain of .12% (372 up, 303 down) for the sample overall. By 20 days out, however, SPY was up on average by .56% (43 up, 18 down)--a very respectable win:loss ratio.
In short, when no one is buying turns out to be a great time to look at stocks, but returns are respectable when everyone is buying. We typically see some pullback in the near term after a period of popularity, but over a 20-day period returns are quite good. The notion that "overbought" markets are due for scary corrections does not hold water. Rather, it seems as though upside momentum tends to persist over an intermediate-term time frame.
Thursday, October 05, 2006
TIKI (Dow TICK) and Program Trading
Let's say that, instead of measuring the number of NYSE stocks trading at their offer prices vs. those trading at their bids (NYSE TICK), we simply focus on the Dow 30 Industrial stocks and investigate how many of them are trading bid vs. offer. The resulting statistic is called TIKI and, it too, can be viewed as a sentiment measure. When Dow buyers are aggressive, they will be willing to transact at the stocks' offer prices, and you'll see TIKI values skyrocket above +20. When Dow sellers are aggressive, they're willing to bail out at the stocks' bid prices and TIKI will plunge below -20. Because the Dow stocks are quite liquid and trade frequently, the TIKI moves much faster than the NYSE TICK. Its values are also distributed very differently from the TICK; TICK and TIKI correlate significantly (around .60), but hardly perfectly. The majority of variance in TIKI cannot be explained by the general buy/sell sentiment captured by TICK.
The reason for this is that TIKI is highly sensitive to program trading. Whenever a program is executed that calls for the simultaneous buying or selling of a basket of stocks (arbing stocks against index futures would be a common example), TIKI values will shoot very high or very low. The Dow stocks, being liquid, are frequent components of such stock baskets. When the Dow stocks move in unison, it is often because programs are being set off.
One way we know this is by looking at the distribution of TIKI values on a 10 second basis. (Yes, I archive those data also). The odds of a very high number of Dow stocks upticking or downticking at exactly the same time should be quite small if we assume that there is an even probability of the next tick being an uptick or downtick in each issue. What we see, however, is many more extreme values than would be predicted by chance. These bulges at the extreme are the result of systematic buying and selling by institutions, often as part of arb (non-directional) trade.
If you get that idea, then it will make sense to you that absolute TIKI values are not especially helpful in gauging the sentiment of the market. TIKI can soar or plunge, simply because institutions are buying or selling stocks at the same time that they sell or buy index futures. It is the correlation between TIKI and price that is crucial. When TIKI hits extremes and price is moving in a correlated fashion, we know this is part of directional trade--not arb.
So let us take a moving correlation between TIKI and price change in the S&P 500 Index (SPY). I have cumulated each day's TIKI values, adjusted them for a zero mean, and correlated TIKI and daily price change over a moving 10-day window going back to 2004 (N = 682 trading days).
The average 10-day correlation between daily TIKI and daily price change in SPY over this period has been .63. When we have a strong TIKI/price correlation (above .80; N = 108), the next ten days in SPY average a gain of .73% (73 up, 35 down). That is significantly stronger than the average 10-day price change in SPY of .26% (397 up, 285 down).
When the TIKI/price correlation is relatively low (below .50; N =133), the next ten days in SPY average a loss of -.41% (57 up, 76 down). That is significantly weaker than the average 10-day performance.
What this suggests is that, when TIKI is well correlated with price, the market tends to outperform. When TIKI is poorly correlated with price, the market tends to underperform. This pattern, I have found, is also present at intraday time frames. A reasonable explanation for the findings is that low correlation periods represent occasions of high program/arb trading, whereas high correlation periods represent periods of high directional trade.
We last saw very high TIKI/price change correlations on September 21 and 22, when the values were about .88. The recent price strength has followed from that. We are now at relatively average levels of correlation (.60). Much of May and June--a period of correction--featured very low correlations.
According to H. L. Camp, about 45% of all NYSE volume is now attributable to program trading. The buying or selling you see on the screen may or may not reflect genuine demand or supply in the marketplace. Who is in the markets ultimately impacts what markets do.
The reason for this is that TIKI is highly sensitive to program trading. Whenever a program is executed that calls for the simultaneous buying or selling of a basket of stocks (arbing stocks against index futures would be a common example), TIKI values will shoot very high or very low. The Dow stocks, being liquid, are frequent components of such stock baskets. When the Dow stocks move in unison, it is often because programs are being set off.
One way we know this is by looking at the distribution of TIKI values on a 10 second basis. (Yes, I archive those data also). The odds of a very high number of Dow stocks upticking or downticking at exactly the same time should be quite small if we assume that there is an even probability of the next tick being an uptick or downtick in each issue. What we see, however, is many more extreme values than would be predicted by chance. These bulges at the extreme are the result of systematic buying and selling by institutions, often as part of arb (non-directional) trade.
If you get that idea, then it will make sense to you that absolute TIKI values are not especially helpful in gauging the sentiment of the market. TIKI can soar or plunge, simply because institutions are buying or selling stocks at the same time that they sell or buy index futures. It is the correlation between TIKI and price that is crucial. When TIKI hits extremes and price is moving in a correlated fashion, we know this is part of directional trade--not arb.
So let us take a moving correlation between TIKI and price change in the S&P 500 Index (SPY). I have cumulated each day's TIKI values, adjusted them for a zero mean, and correlated TIKI and daily price change over a moving 10-day window going back to 2004 (N = 682 trading days).
The average 10-day correlation between daily TIKI and daily price change in SPY over this period has been .63. When we have a strong TIKI/price correlation (above .80; N = 108), the next ten days in SPY average a gain of .73% (73 up, 35 down). That is significantly stronger than the average 10-day price change in SPY of .26% (397 up, 285 down).
When the TIKI/price correlation is relatively low (below .50; N =133), the next ten days in SPY average a loss of -.41% (57 up, 76 down). That is significantly weaker than the average 10-day performance.
What this suggests is that, when TIKI is well correlated with price, the market tends to outperform. When TIKI is poorly correlated with price, the market tends to underperform. This pattern, I have found, is also present at intraday time frames. A reasonable explanation for the findings is that low correlation periods represent occasions of high program/arb trading, whereas high correlation periods represent periods of high directional trade.
We last saw very high TIKI/price change correlations on September 21 and 22, when the values were about .88. The recent price strength has followed from that. We are now at relatively average levels of correlation (.60). Much of May and June--a period of correction--featured very low correlations.
According to H. L. Camp, about 45% of all NYSE volume is now attributable to program trading. The buying or selling you see on the screen may or may not reflect genuine demand or supply in the marketplace. Who is in the markets ultimately impacts what markets do.
Wednesday, October 04, 2006
Big Buying Days: What Comes Next?
Readers know that I look to the NYSE TICK as a measure of market sentiment. There are good short-term trading patterns that utilize the TICK; there are also longer-term patterns based upon shifts in the distribution of TICK readings. We see some short-term momentum effects in the market based upon extreme TICK readings over a five-day period. An earlier post, however, found subnormal two-day returns following individual big swinging TICK days in the market.
On Wednesday, we saw an example of a strong TICK day, with the Adjusted TICK closing at +903. We also showed very strong momentum among stocks, with my Demand measure (number of stocks closing above their short- and intermediate-term moving average envelopes) exceeding Supply (number of stocks closing below those envelopes) by more than 5:1.
Since 2004 (N = 687 trading days), we've had 32 days of very strong TICK (greater than +700) and very strong stock momentum (Demand:Supply better than 5:1). Two days later, SPY was down by an average of -.15% (14 up, 18 down). That is weaker than the average two-day gain in SPY of .06% (362 up, 325 down) for the entire sample. Interestingly, this underperformance has tended to reverse over the *following* two sessions.
The implication is that it is common for markets to take a pause after a big buying day. This tends, however, to be a short-term effect; returns are actually moderately superior four days out.
On Wednesday, we saw an example of a strong TICK day, with the Adjusted TICK closing at +903. We also showed very strong momentum among stocks, with my Demand measure (number of stocks closing above their short- and intermediate-term moving average envelopes) exceeding Supply (number of stocks closing below those envelopes) by more than 5:1.
Since 2004 (N = 687 trading days), we've had 32 days of very strong TICK (greater than +700) and very strong stock momentum (Demand:Supply better than 5:1). Two days later, SPY was down by an average of -.15% (14 up, 18 down). That is weaker than the average two-day gain in SPY of .06% (362 up, 325 down) for the entire sample. Interestingly, this underperformance has tended to reverse over the *following* two sessions.
The implication is that it is common for markets to take a pause after a big buying day. This tends, however, to be a short-term effect; returns are actually moderately superior four days out.
Moving Correlations: A Tool for Examining Sector Relationships
Traders are familiar with moving averages, in which we track the price of a stock or index against a moving window of previous prices. Suppose, however, we want to track the price of a stock or index vis a vis another stock or index? One way to accomplish this is to create a moving correlation of prices. For instance, in this exercise, we'll look at a 10-day moving correlation between the price of the Dow Jones Industrial Average (DIA) and the Russell 2000 Index (IWM).
Recently, this correlation has dipped into negative territory, as the Dow is up over the time period, but the Russell is down. When the two averages are moving in sync (high positive correlation) during a rally are expectations for future prices different than when they're moving in opposite directions (low positive or negative correlation)?
Overall, since 2004 (N = 684 trading days), the average 10-day correlation between the Dow and Russell has been .73. That means that about half of all the movement in those indices can be attributed to a general "buy the market, sell the market" effect. The other half of variance in the movement can be attributed to factors independent of the relationship between the two averages.
We have only had 31 occasions in which the 10-day correlation has been outright negative--and only four in which the negative correlation occurred as a result of the Dow outperforming the Russell. Although this sample size is too small for reliable generalization, it is interesting that all four occasions led to gains in IWM over the following five days--perhaps a kind of catch-up effect, as the average gains in IWM exceeded those in DIA.
When we look at occasions in which (as at present) the Dow has been up more than 1% over the past 10 days (N = 249), we find that the ten-day correlation with the Russell has impacted returns for the Dow only modestly over the next five days. When the Russell has been highly correlated with the rising Dow (N = 124), the next five days in the Dow average a loss of -.05% (61 up, 63 down), which is weaker than the average five-day gain of .08% (362 up, 322 down) for the Dow sample overall. When the Russell has been weakly correlated with the rising Dow (N = 125), the next five days in the Dow have averaged a gain of .07% ( 64 up, 61 down), in line with overall performance.
When we examine the impact of the correlation on the Russell, however, we see more of a pattern. On those occasions in which the Dow has been up over 1% during the past ten sessions, when the Russell has been highly correlated (N = 124), the next five days in the Russell have averaged a gain of .09% (67 up, 57 down), which is weaker than the average five-day gain of .20% (376 up, 308 down). When the Russell has been relatively weak in its correlation with the Dow (N = 125), the next five days in the Russell have averaged a gain of .39% (80 up, 45 down)--a much more bullish edge.
If we look just at times in which the Dow has been up over 1% in the past 10 sessions and the correlation between the Dow and Russell has been under .50 (N = 25), the next five days in the Dow and Russell have been quite bullish. The Dow has averaged a gain of .47% (18 up, 7 down); the Russell has averaged a gain of 1.15% (20 up, 5 down).
What this suggests is that it isn't just how an index moves that is important; it's how it moves relative to other sectors. Moving correlation may be a worthy tool for market analysis. More research to follow here and in the Trading Psychology Weblog.
Recently, this correlation has dipped into negative territory, as the Dow is up over the time period, but the Russell is down. When the two averages are moving in sync (high positive correlation) during a rally are expectations for future prices different than when they're moving in opposite directions (low positive or negative correlation)?
Overall, since 2004 (N = 684 trading days), the average 10-day correlation between the Dow and Russell has been .73. That means that about half of all the movement in those indices can be attributed to a general "buy the market, sell the market" effect. The other half of variance in the movement can be attributed to factors independent of the relationship between the two averages.
We have only had 31 occasions in which the 10-day correlation has been outright negative--and only four in which the negative correlation occurred as a result of the Dow outperforming the Russell. Although this sample size is too small for reliable generalization, it is interesting that all four occasions led to gains in IWM over the following five days--perhaps a kind of catch-up effect, as the average gains in IWM exceeded those in DIA.
When we look at occasions in which (as at present) the Dow has been up more than 1% over the past 10 days (N = 249), we find that the ten-day correlation with the Russell has impacted returns for the Dow only modestly over the next five days. When the Russell has been highly correlated with the rising Dow (N = 124), the next five days in the Dow average a loss of -.05% (61 up, 63 down), which is weaker than the average five-day gain of .08% (362 up, 322 down) for the Dow sample overall. When the Russell has been weakly correlated with the rising Dow (N = 125), the next five days in the Dow have averaged a gain of .07% ( 64 up, 61 down), in line with overall performance.
When we examine the impact of the correlation on the Russell, however, we see more of a pattern. On those occasions in which the Dow has been up over 1% during the past ten sessions, when the Russell has been highly correlated (N = 124), the next five days in the Russell have averaged a gain of .09% (67 up, 57 down), which is weaker than the average five-day gain of .20% (376 up, 308 down). When the Russell has been relatively weak in its correlation with the Dow (N = 125), the next five days in the Russell have averaged a gain of .39% (80 up, 45 down)--a much more bullish edge.
If we look just at times in which the Dow has been up over 1% in the past 10 sessions and the correlation between the Dow and Russell has been under .50 (N = 25), the next five days in the Dow and Russell have been quite bullish. The Dow has averaged a gain of .47% (18 up, 7 down); the Russell has averaged a gain of 1.15% (20 up, 5 down).
What this suggests is that it isn't just how an index moves that is important; it's how it moves relative to other sectors. Moving correlation may be a worthy tool for market analysis. More research to follow here and in the Trading Psychology Weblog.
Note: I want to thank Instant Bull for its kind recognition of TraderFeed as a 2006 "Best of Breed" blog.
Tuesday, October 03, 2006
When Do I Get Out of a Trade?
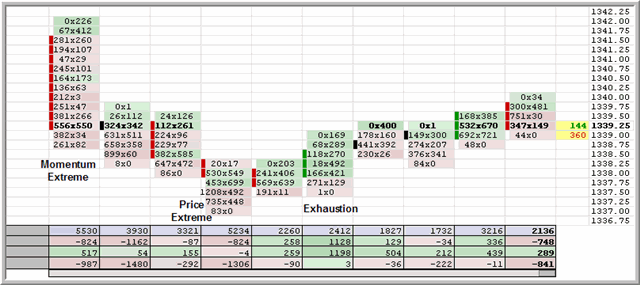
Yesterday, in my Webinar session (which will be archived in the next couple of days on the Teach Me Futures site), I introduced an idea that I called "transitional structures" in the market. These are shifts that occur at turning points, in which bearish sentiment gradually becomes bullish and vice versa. For a nice example of a transitional structure, take a look at this post. Thinking in structural ways is important, because it provides a framework for thinking about how markets are behaving--and why.
A question came up in the Webinar that went something like this, "How many ticks (or points) away from my entry should I place my stop?"
If you're thinking in structural market terms, that's not the risk management question to be asking. All too often, it's easy to select price-based stops based on one's pain threshold--not on objective market action--and thereby limit opportunity.
Rather, the question to ask is, "What market action would convince me that the rationale for my trade is incorrect?"
Let's take the very simple example above. We have a candidate transitional structure, labeled with the downside momentum extreme, the price extreme (bottom) on reduced volume and reduced volume at the bid, and then we get a couple of bars of exhaustion. During those exhaustion bars, we have some net selling (volume at bid) around 1337.75, but the volume is drying up (when compared to the previous bars) and we're unable to make new price lows. You would want to enter the market on the long side as close to those exhaustion points as possible, with the expectation that you will return to the mean trading price of the previous bars that encompassed the market decline.
Now the question is: What would get me out of the trade?
Do I set a stop several ticks below the market's low point to decide I'm wrong? Not at all. If my trade idea is based on the notion of exhaustion, then any expansion of volume at the bid at that 1337.75 region takes me out of the trade. Why? That tells me fresh selling is entering the market. I don't want to go there; it invalidates my trade idea.
It's not a maximum tick or point loss that should get you out. It's being wrong that gets you out. When a market structure gets you into a trade, a violation of that structure should be what gets you out. Not fear. Not loss. Not pain.
Monday, October 02, 2006
A Psychological Take on Volatility
The role of markets is to facilitate trade and establish value. Price is the measure of the degree to which market participants value underlying financial instruments and commodities.
Imagine a market in which price was totally constant throughout the day. The open, high, low, and close price for the day were the same. In such a market, we would have perfect consensus regarding value. The market would be expressing a high degree of conviction regarding the placement of value.
Now imagine a market in which price fluctuates wildly throughout the day, perhaps as the result of a stream of news events and economic reports. A different and unique price is present at every time period within the day. Such a market would display little consensus regarding value. The market would be expressing a low degree of conviction regarding the location of value.
Volatility is intimately linked to uncertainty. A low volatility market is one in which traders are in relative agreement about their valuations. In a high volatility market, valuations are all over the place. Think of the market as a single person trying to come up with a number that represents ideal value. The non-volatile market is one in which the person is more certain of his or her value estimates.
The question then becomes: Are returns superior in a market environment characterized by high consensus/low uncertainty or low consensus/high uncertainty?
As it happens, the past three days in SPY have been a period of unusually high consensus. The three-day range of prices has been among the lowest that we've had since 2004 (N = 687 trading days).
In all, we've had 61 trading occasions since 2004 in which the three-day range in SPY has been below 1%. Three days later, SPY has been down on average by -.36% (19 up, 42 down). That is quite a subnormal return. The average three-day price change for the sample as a whole has been .08% (380 up, 307 down).
Conversely, when the three-day range in SPY has been greater than 2% (N = 177), the next three days in SPY have averaged a gain of .16% (107 up, 70 down), with five-day returns continuing to outperform.
One implication is that markets reward risk assumption. The safest times to trade--when there is relative consensus regarding value--offer subnormal returns, whereas the least certain--and seemingly most risky--periods to trade offer outperformance. A trading strategy that avoids volatility is not just a risk management strategy, but also an opportunity limiting one.
Imagine a market in which price was totally constant throughout the day. The open, high, low, and close price for the day were the same. In such a market, we would have perfect consensus regarding value. The market would be expressing a high degree of conviction regarding the placement of value.
Now imagine a market in which price fluctuates wildly throughout the day, perhaps as the result of a stream of news events and economic reports. A different and unique price is present at every time period within the day. Such a market would display little consensus regarding value. The market would be expressing a low degree of conviction regarding the location of value.
Volatility is intimately linked to uncertainty. A low volatility market is one in which traders are in relative agreement about their valuations. In a high volatility market, valuations are all over the place. Think of the market as a single person trying to come up with a number that represents ideal value. The non-volatile market is one in which the person is more certain of his or her value estimates.
The question then becomes: Are returns superior in a market environment characterized by high consensus/low uncertainty or low consensus/high uncertainty?
As it happens, the past three days in SPY have been a period of unusually high consensus. The three-day range of prices has been among the lowest that we've had since 2004 (N = 687 trading days).
In all, we've had 61 trading occasions since 2004 in which the three-day range in SPY has been below 1%. Three days later, SPY has been down on average by -.36% (19 up, 42 down). That is quite a subnormal return. The average three-day price change for the sample as a whole has been .08% (380 up, 307 down).
Conversely, when the three-day range in SPY has been greater than 2% (N = 177), the next three days in SPY have averaged a gain of .16% (107 up, 70 down), with five-day returns continuing to outperform.
One implication is that markets reward risk assumption. The safest times to trade--when there is relative consensus regarding value--offer subnormal returns, whereas the least certain--and seemingly most risky--periods to trade offer outperformance. A trading strategy that avoids volatility is not just a risk management strategy, but also an opportunity limiting one.
Note - I will be offering a free Webinar today at 3:30 PM CT. The topic is "Assessing Market Psychology"; the session is sponsored by the Chicago Mercantile Exchange and hosted by Advantage Futures. Interested traders can register here.
Sunday, October 01, 2006
Are Technical Indicators Relevant for Daytraders?
In my last post, I observed that the behavior of the S&P 500 Index during its day hours (open to close) was quite different--and independent of--its behavior during night hours (close to open). As I noted on my Trader Performance page, this calls into question market analyses utilized by daytraders that incorporate overnight data.
Unfortunately, overnight information is embedded within many traditional technical indicators utilized by daytraders. These include, not only price series, but such measures as TRIN, advances/declines, and oscillators covering multiple days.
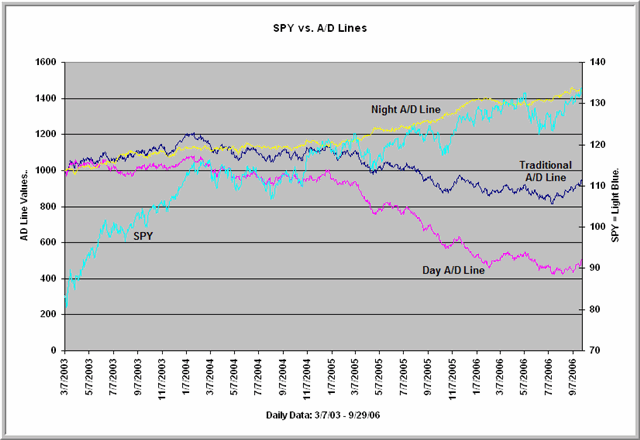
Above we have a chart that features three advance-decline lines and SPY, going back to early March, 2003. The dark blue line is a traditional advance-decline line derived from the 17 stocks in my Institutional basket. These issues are highly liquid stocks that represent the major sectors that are part of the S&P 500 Index. My historical studies have found that these stocks track the SPX quite well.
The yellow line is an advance-decline line derived solely from the overnight performance of the stocks. In other words, we are cumulating the gap between the prior day's close and the current day's open. Note the persistent upward trend--precisely the same pattern we saw with the "Nighttrading" S&P Index from the previous post.
The red line is an advance-decline line built solely upon the day session performance of the stocks. Here we are cumulating the open to close performance of the stocks. Observe that we have a rather steady downward trend. This is the same pattern we saw with the "Daytrading" S&P Index in the last post.
The traditional advance-decline line is basically an amalgam of the two lines. It does not reflect actual stock performance experienced by a daytrader. For that, we might need to use an advance-decline measure drawn solely from day session (open to close) data. Similarly, any effort to assemble overbought-oversold measures for the market should draw upon day session performance: the actual market being traded by the daytrader. It may well be that technical indicators so constructed would do a better job than traditional measures at identifying tradable patterns for the daytrader.
Perhaps the following example makes the issue clearer. Let's say that I live in an area of New Mexico at high altitude. You wish to visit me and ask me what kind of clothes you should pack for the climate. I tell you that the average temperature is 60 degrees F., and you accordingly pack a light sweater and jeans. When you arrive, however, you find that daytime temperatures hit the 90s and nights get into the 30s. The average temperature did not help you pack; it obscured important differences between day and night.
By looking at average price performance across entire days, daytraders can similarly obscure important day and night differences. What does it matter that "the trend is up" or "the market is strong" if the trend has no statistical bearing on the hours that you are trading--or, in the case of the advance-decline numbers--a slightly *negative* correlation (-.22)?
And if your goal is to capture trending behavior in the markets, is daytrading an appropriate strategy? Does closing positions at the end of the day lower risk, or does it reduce reward?
Saturday, September 30, 2006
The S&P 500 Index and Its Multiple Personality
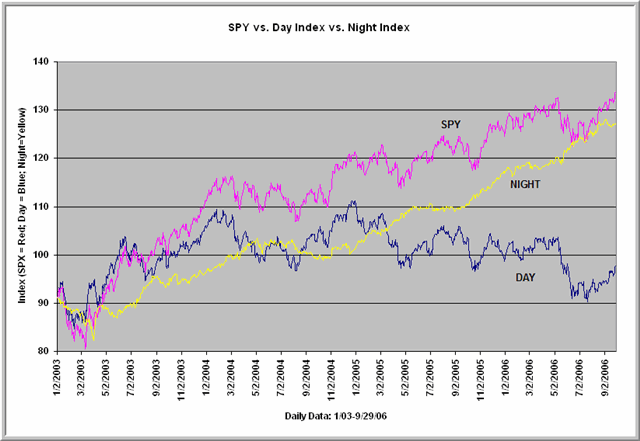
Here is the 2003-2006 bull market from three perspectives. The red line is the one we're most familiar with: it is the S&P 500 Index (SPY). The bullish and trending yellow line represents the cumulative price change of the S&P 500 Index outside of normal market hours (overnight). The blue line, which represents only a very modest gain over the entire period, is the cumulative price change of the S&P during the normal day session from open to close.
The correlation between the blue line (Daytrading Index) and yellow line (Nighttrading Index) is .04. What happens to the S&P during normal day hours is wholly independent of what happens to it after the close and before the open. The S&P truly has a multiple personality.
There are several implications to this breakdown:
1) Analyzing the Index as a whole (SPY) to derive patterns for daytraders may be faulty methodology. To the extent that researched patterns include--and are dominated by--overnight price changes, they portray opportunity that the daytrader would never realize;
2) Trend traders operating in the day timeframe would be well advised to extend their holding periods. Their trading methods might better take advantage of the trending component of the overnight market;
3) Because over half of all NYSE volume is program trading, the day session is dominated by arbitrage. Much of the market's directional activity occurs after the close and before the open, which is when many economic reports are released and when many influential world markets (currency, oil) are operating.
Notice that I am not saying that the day timeframe lacks opportunity. Rather, I'm suggesting that daytrading has not been offering a trending opportunity, and it is offering opportunity that is independent of what occurs in the market overnight.
To capture this opportunity, might it make sense to analyze patterns within the Daytrading Index, rather than in the S&P 500 Index itself? While the Daytrading Index is not a true trading index and traders are unlikely to replicate its performance by precisely buying the open and selling the close each day, analyses of historical patterns in the Daytrading Index would provide more accurate alerts to directional movements than analyses that include time periods during which the trader will never hold positions.
One other interesting implication of all this: With the advent of free trading, might it make sense for a trader to actually trade the Nighttrading Index as an instrument? Someone who bought the close and exited at the open each day would have done well, sans commissions, during the past several years.
I will be pursuing Daytrading and Nighttrading Index patterns in my own research and report here on this blog and in the Trading Psychology Weblog.
Friday, September 29, 2006
Market Psychology Update for 9/29/06
9:50 AM CT - Here's my latest Trading Markets article. Hope it's a bit more exciting than this market has been. Volume really slowed down here. I'll be taking off now; hope you have an excellent rest of the day. Update tonight on the Weblog and regular weekend updates as well.
9:39 AM CT - Recent selling has held at that average price area of 1347, but volume on buying after that initial spike on the news has been quite modest. We'll need to see an expansion of negative TICK to sustain any kind of downtrend here. Similarly, we'll need multiple +1000 readings as we had earlier this week to sustain the upside. Until then, it's quite a narrow range.
9:31 AM CT - Some tailing off of volume here. Declines lead advances by less than 100 issues. Very little follow through to short term moves; lots of runups/rundowns and reversals, typical of local dominated trade.
9:25 AM CT - The uptick in rates continues on the heels of the strong economic report. Keep an eye. No major change in Dollar/Euro. Falling rates were a major underpinning of the recent rally; let's see how we respond to a possible rate backup.
9:20 AM CT - So far, it's a 3-1/2 point ES range and the economic numbers have not been sufficient to break us from the range on this Friday, the last day of the quarter. As mentioned earlier, fading moves above and below that average price of 1347 makes the most sense *if* you're going to trade such an environment. There's no outstanding selling pressure thus far, but neither has there been follow through to buying. I'm watching that TICK distribution carefully to see if that shifts.
9:08 AM CT - Strength in the Chicago PMI number was taken well by the market--note the program buying and expansion in the TICK--as we once again get the chance to break and stay above the 1350 area highs, with the 1346 region now providing near term support. Advances lead declines by about 300 issues--nothing to write home about--but upside volume (at offer) really picked up on the number's release. We need to stay above the AM lows to get a good uptrend day out of this; a decisive break below those lows would have me entertaining the idea of an intermediate-term market top.
8:59 AM CT - A pickup of selling took us back to that average price, and volume remains modest--all consistent thus far with the range bound hypothesis. So far, buying has not seen follow through. If that continues, expect a test of those lows around 1343.
8:45 AM CT - Some weakness in emerging markets (EEM) ETF; NQ and semis show weaker performance so far. Volume at bid vs offer pretty even in ES; TICK positive overall, but not robust. Nothing so far to lead me to believe that we're not in a range bound market: volumes are modest, with mostly locals doing their very short-term thing.
8:40 AM CT - TICK positive thus far, though not especially robust. NQ showing a little relative weakness; ER2 a little relative strength. ES trying to hold above that average price to mount an assault on range highs. Waiting for the two economic reports. Advancers over declines by a little less than 500 issues. Back shortly.
8:22 AM CT - Well, the Personal Income and Personal Spending numbers came in pretty much in line. We'll get Michigan Sentiment before 9 AM CT and Chicago PMI around 9 AM. We're hovering around the highs from the past two days, with that 1350 area offering immediate resistance. Note that we're further from the lows in ER2. Multi-day support is at 1343, so that gives us a relatively narrow range going into today's trade. My latest Trading Markets article will come out later this AM and details the many divergences in the current market. For intermediate-term trading, I am not chasing the upside here. The rally is just too narrow-based for my liking. A broadening of the rally, expanding the number of stocks making new 20-day highs and taking the small and mid cap sectors with it, would change my mind. Note that 1347 represents the average trading price of the last couple of days; as yesterday, I look to fade moves above and below that unless we get an expansion of volume lifting offers or hitting bids. But, like the last post noted, staying flexible is the key. Back after the open.
8:15 AM CT - As noted yesterday, this will be my final daily market update. Starting in October, I will resume daily postings to this site and the Trading Psychology Weblog, but won't be tracking the market in real time during the early morning hours. If you are interested in doing occasional free real time training sessions via the Web, with a focus on reading short-term market patterns, drop me a line. My email address is at the right sidebar on this blog. While on the topic of training, I'll be doing the Webinar for the Chicago Mercantile Exchange this Monday at 3:30 PM CT. It's free, but registration is required. Once again, thanks to Advantage Futures and John Conolly of TeachMeFutures for sponsoring the event. I will be doing a live event for the Merc that will also be broadcast over the Web on November 2nd. Details will be on my personal site shortly. Back in a bit.
9:39 AM CT - Recent selling has held at that average price area of 1347, but volume on buying after that initial spike on the news has been quite modest. We'll need to see an expansion of negative TICK to sustain any kind of downtrend here. Similarly, we'll need multiple +1000 readings as we had earlier this week to sustain the upside. Until then, it's quite a narrow range.
9:31 AM CT - Some tailing off of volume here. Declines lead advances by less than 100 issues. Very little follow through to short term moves; lots of runups/rundowns and reversals, typical of local dominated trade.
9:25 AM CT - The uptick in rates continues on the heels of the strong economic report. Keep an eye. No major change in Dollar/Euro. Falling rates were a major underpinning of the recent rally; let's see how we respond to a possible rate backup.
9:20 AM CT - So far, it's a 3-1/2 point ES range and the economic numbers have not been sufficient to break us from the range on this Friday, the last day of the quarter. As mentioned earlier, fading moves above and below that average price of 1347 makes the most sense *if* you're going to trade such an environment. There's no outstanding selling pressure thus far, but neither has there been follow through to buying. I'm watching that TICK distribution carefully to see if that shifts.
9:08 AM CT - Strength in the Chicago PMI number was taken well by the market--note the program buying and expansion in the TICK--as we once again get the chance to break and stay above the 1350 area highs, with the 1346 region now providing near term support. Advances lead declines by about 300 issues--nothing to write home about--but upside volume (at offer) really picked up on the number's release. We need to stay above the AM lows to get a good uptrend day out of this; a decisive break below those lows would have me entertaining the idea of an intermediate-term market top.
8:59 AM CT - A pickup of selling took us back to that average price, and volume remains modest--all consistent thus far with the range bound hypothesis. So far, buying has not seen follow through. If that continues, expect a test of those lows around 1343.
8:45 AM CT - Some weakness in emerging markets (EEM) ETF; NQ and semis show weaker performance so far. Volume at bid vs offer pretty even in ES; TICK positive overall, but not robust. Nothing so far to lead me to believe that we're not in a range bound market: volumes are modest, with mostly locals doing their very short-term thing.
8:40 AM CT - TICK positive thus far, though not especially robust. NQ showing a little relative weakness; ER2 a little relative strength. ES trying to hold above that average price to mount an assault on range highs. Waiting for the two economic reports. Advancers over declines by a little less than 500 issues. Back shortly.
8:22 AM CT - Well, the Personal Income and Personal Spending numbers came in pretty much in line. We'll get Michigan Sentiment before 9 AM CT and Chicago PMI around 9 AM. We're hovering around the highs from the past two days, with that 1350 area offering immediate resistance. Note that we're further from the lows in ER2. Multi-day support is at 1343, so that gives us a relatively narrow range going into today's trade. My latest Trading Markets article will come out later this AM and details the many divergences in the current market. For intermediate-term trading, I am not chasing the upside here. The rally is just too narrow-based for my liking. A broadening of the rally, expanding the number of stocks making new 20-day highs and taking the small and mid cap sectors with it, would change my mind. Note that 1347 represents the average trading price of the last couple of days; as yesterday, I look to fade moves above and below that unless we get an expansion of volume lifting offers or hitting bids. But, like the last post noted, staying flexible is the key. Back after the open.
8:15 AM CT - As noted yesterday, this will be my final daily market update. Starting in October, I will resume daily postings to this site and the Trading Psychology Weblog, but won't be tracking the market in real time during the early morning hours. If you are interested in doing occasional free real time training sessions via the Web, with a focus on reading short-term market patterns, drop me a line. My email address is at the right sidebar on this blog. While on the topic of training, I'll be doing the Webinar for the Chicago Mercantile Exchange this Monday at 3:30 PM CT. It's free, but registration is required. Once again, thanks to Advantage Futures and John Conolly of TeachMeFutures for sponsoring the event. I will be doing a live event for the Merc that will also be broadcast over the Web on November 2nd. Details will be on my personal site shortly. Back in a bit.
The Most Underrated Trading Virtue

Those anti-motivational folks at Despair have it right: there's nothing like the winds of change to blow away the unsuspecting trader.
A worthwhile book that I've begun reading is Master Traders by Fari Hamzei of Hamzei Analytics. There's a very nice segment from Jeff deGraff:
Contrary to what 99 percent of the investment population thinks, trading is not about being right. Being right is easy. Trading is about being wrong; and navigating this inevitable occurrence distinguishes the winners from the losers in the long run...The road to riches is littered with the bodies of those who believed that being right required conviction and stamina...but the line between conviction and stubbornness is at best vague (p. 13-14).
Although trading coaches wax poetic about trading plans and maintaining discipline with these plans, rigidity in the face of a plan going sour is no virtue. The winds of market change can shift quite dramatically when large participants enter with directional positions. It is for this reason that mental flexibility is perhaps the most underrated trading virtue.
Yesterday's market update provided a perfect example of the value of mental flexibility. During the opening ten minutes of trade, I observed strength in the Russell futures and a positive tone to the NYSE TICK. My historical studies told me that, under these conditions, the odds of taking out the previous day's highs were well north of 75%. That was my initial plan.
Then came the winds of change.
By 8:48 AM, I was noticing selling in the Russell futures and especially program-driven selling. The presence of institutional sellers as we neared the previous day's high led me to consider an alternate market scenario: perhaps we were in the process of forming a range for the day. By 9:01 AM, I was looking for the previous day's average price of 1347 in the ES to be a midpoint of this developing range, noting an attempt to form a short-term base below that level. (The eventual midpoint was 1346.75).
At 9:14 AM, the market had indeed rallied from this base, but the quality of the rally was substandard: certainly nothing like the opening buying. By 9:34 AM, the winds of change had come full circle. From expecting to take out the previous day's highs, I now work with the hypothesis that we had put in the high for the current day. Instead of buying strength, I was fading rallies--a strategy that worked well for the short-term trader.
Within an hour's time, I had completely revised my view of the market. Had I formed a plan at the start of trading and stuck with it in the name of discipline, the winds of change would have hurled some projectiles at my P/L.
When you're a short-term trader, think of the market as your dance partner. It leads, you follow. Your job is to sense your partner's intentions and move fluidly with each shift of direction. Your trading plans and predictions mean nothing to the market; only ego makes the trader want to lead his or her dance partner.
Be a good follower, and you'll be a market leader.
Thursday, September 28, 2006
Market Psychology AM Update for 9/28/06
9:52 AM CT - I'll have more to say about this in tomorrow's blog post, but notice how my view of the market shifted over the course of the AM. I started with favorable expectations for taking out the highs in ES, given the TICK and ER2 strength. Then, with program selling, I started entertaining the idea of bottoming and rangebound trade. Then I questioned the vigor of the rally and started looking to the downside. The point here is to stay mentally flexible, not get hung up on any single perspective or piece of research. The balance between buyers and sellers shifted over the course of the AM: our job is to pick up such shifts. Important support in the 1343 area from yesterday's lows; it will be important to see if we get any further shifts as we approach those. Have a great day; update on the Weblog tonight.
9:40 AM CT - I'll put out an article on the Dow TICK before too long. I continue to see sell programs hit the market, and that's putting a lid on stocks thus far. Note the continued weakness in TICK and ER2. That's going to need to change for us to have a shot at taking out yesterday's highs.
9:34 AM CT - Just had a computer crash; hopefully all will be OK with this update. The rallies continue to look suspect, and we're seeing some downward tilt in the TICK distribution. I'm entertaining the possibility that we put in our highs for the day and that we might give back some of the recent gains--a pattern that would fit with the research mentioned earlier this AM. Advancing stocks now only lead declines by 250. I'm watching that TICK distribution and ER2 once again. They were leading the market early to the upside and have been waning ever since.
9:14 AM CT - Hopefully you were able to see that short-term bottoming form and, at the very least, not get lulled into selling lows. This is not a convincing rally, however; volume is waning, and we continue to see volume at bid exceed that at the offer in ES. The TICK distribution has stayed relatively positive, however, and it's that dynamic that's keeping us in a range.
9:01 AM CT - Note yesterday's average price of 1347. With the failure to take out yesterday's high, we traded through that, and now we're trying to put in a short-term bottom. We want to look closely for evidence for such bottoming, because that would provide us with a support level in a trading range extending up to yesterday's highs. I'm looking to see if volume picks up or dries up at these levels to handicap the odds of bottoming short term. Let's also see if TICK can hold above its recent lows.
8:48 AM CT - My read, FWIW, is that it's not that we have huge volume in the market; it's that a good portion of that volume is program buying or selling by institutions. Mass buying or selling of futures vs. underlying stocks or futures relative to each other creates sudden sharp movements for a number of ticks and then equally sharp reversals. Note the significant NQ and ER2 selling just since my last post and the several swings in the Dow TICK from very strong to very weak and back again. Because the Dow stocks are included in many baskets for program trading due to their liquidity, the swings in the Dow TICK (TIKI) do reflect program activity. That's how we get significant ES selling without negative NYSE TICK readings. This activity could keep us range bound--keep an eye on buying/selling volume (at offer vs bid) as we approach market highs.
8:40 AM CT - Keep watching TICK and ER2. As long as those are strong, we have good odds of taking out the recent highs in ES.
8:38 AM CT - Volume is moderate; nothing to write home about. TICK remains positive, and volume at offer in ES exceeds that at bid. Near term support at 1347.25; we're testing those highs as indicated a few min ago.
8:34 AM CT - Note that we're opening with ER2 above its previous day's high, TICK positive, and over 800 advancers over decliners. We should test yesterday's ES highs if that continues.
8:20 AM CT - Initial claims came in pretty much as expected; GDP a tad weaker, but we're seeing an uptick in interest rates and a bit of dollar strength versus the Euro. The S&P Index in preopening trading has been hovering near its recent highs, but in a narrow range. As my previous blog post indicated, returns five days out following a string of 20-day highs in SPY have been negative, on average. One thing I'm looking at: ER2 is below its highs from last week and, so far, we've seen fewer stocks make new highs this week compared with last. I want to see if this rally broadens out or stalls. If the latter, I'd expect some pullback over the next week. Back after the open.
8:05 AM CT - This has been a nice lull period for me. Having finished my book manuscript and also finished work with a trading firm I had been helping, I've been able to devote a piece of my mornings to these updates. At the end of this month, however, I won't be able to continue the daily updates. A new writing project beckons, and I will begin a couple of projects with new firms. Beginning in October, I'll continue to update the Weblog and this site daily, with illustrations and historical analyses of tradable market patterns. I also hope to extend the analyses to longer timeframes, for swing traders and short-term investors. I just won't be able to comment on the market in real time on a daily basis. My hope is that the real time updates have given you some ideas of things to look for in the markets, so that you can frame your own trading hypotheses. Thanks for your interest and support. Market update soon to follow.
9:40 AM CT - I'll put out an article on the Dow TICK before too long. I continue to see sell programs hit the market, and that's putting a lid on stocks thus far. Note the continued weakness in TICK and ER2. That's going to need to change for us to have a shot at taking out yesterday's highs.
9:34 AM CT - Just had a computer crash; hopefully all will be OK with this update. The rallies continue to look suspect, and we're seeing some downward tilt in the TICK distribution. I'm entertaining the possibility that we put in our highs for the day and that we might give back some of the recent gains--a pattern that would fit with the research mentioned earlier this AM. Advancing stocks now only lead declines by 250. I'm watching that TICK distribution and ER2 once again. They were leading the market early to the upside and have been waning ever since.
9:14 AM CT - Hopefully you were able to see that short-term bottoming form and, at the very least, not get lulled into selling lows. This is not a convincing rally, however; volume is waning, and we continue to see volume at bid exceed that at the offer in ES. The TICK distribution has stayed relatively positive, however, and it's that dynamic that's keeping us in a range.
9:01 AM CT - Note yesterday's average price of 1347. With the failure to take out yesterday's high, we traded through that, and now we're trying to put in a short-term bottom. We want to look closely for evidence for such bottoming, because that would provide us with a support level in a trading range extending up to yesterday's highs. I'm looking to see if volume picks up or dries up at these levels to handicap the odds of bottoming short term. Let's also see if TICK can hold above its recent lows.
8:48 AM CT - My read, FWIW, is that it's not that we have huge volume in the market; it's that a good portion of that volume is program buying or selling by institutions. Mass buying or selling of futures vs. underlying stocks or futures relative to each other creates sudden sharp movements for a number of ticks and then equally sharp reversals. Note the significant NQ and ER2 selling just since my last post and the several swings in the Dow TICK from very strong to very weak and back again. Because the Dow stocks are included in many baskets for program trading due to their liquidity, the swings in the Dow TICK (TIKI) do reflect program activity. That's how we get significant ES selling without negative NYSE TICK readings. This activity could keep us range bound--keep an eye on buying/selling volume (at offer vs bid) as we approach market highs.
8:40 AM CT - Keep watching TICK and ER2. As long as those are strong, we have good odds of taking out the recent highs in ES.
8:38 AM CT - Volume is moderate; nothing to write home about. TICK remains positive, and volume at offer in ES exceeds that at bid. Near term support at 1347.25; we're testing those highs as indicated a few min ago.
8:34 AM CT - Note that we're opening with ER2 above its previous day's high, TICK positive, and over 800 advancers over decliners. We should test yesterday's ES highs if that continues.
8:20 AM CT - Initial claims came in pretty much as expected; GDP a tad weaker, but we're seeing an uptick in interest rates and a bit of dollar strength versus the Euro. The S&P Index in preopening trading has been hovering near its recent highs, but in a narrow range. As my previous blog post indicated, returns five days out following a string of 20-day highs in SPY have been negative, on average. One thing I'm looking at: ER2 is below its highs from last week and, so far, we've seen fewer stocks make new highs this week compared with last. I want to see if this rally broadens out or stalls. If the latter, I'd expect some pullback over the next week. Back after the open.
8:05 AM CT - This has been a nice lull period for me. Having finished my book manuscript and also finished work with a trading firm I had been helping, I've been able to devote a piece of my mornings to these updates. At the end of this month, however, I won't be able to continue the daily updates. A new writing project beckons, and I will begin a couple of projects with new firms. Beginning in October, I'll continue to update the Weblog and this site daily, with illustrations and historical analyses of tradable market patterns. I also hope to extend the analyses to longer timeframes, for swing traders and short-term investors. I just won't be able to comment on the market in real time on a daily basis. My hope is that the real time updates have given you some ideas of things to look for in the markets, so that you can frame your own trading hypotheses. Thanks for your interest and support. Market update soon to follow.
Does It Pay to Buy Multiple Market Highs?

Amidst the attention being given to the new highs in the large cap indices, it's worth asking the question, "Does it pay to buy new price highs?"
In the chart above, I'm taking closing daily prices of SPY and simply calculating the number of days in the past 20 in which we've made new 20-day highs. I subtract from that figure the number of days in the past 20 in which we've made new 20-day lows.
Going back to 2004 (N = 670 trading days), we've had 205 occasions in which the net number of new high days has been five or greater. Ten days later, SPY has been down by an average of -.06% (106 up, 99 down). That is considerably weaker than the average ten-day gain of .38% (282 up, 183 down) for the remainder of the sample.
Note that, at present, we've had a net number of new high days of 8. When that has occurred since 2004 (N = 65), returns in SPY have been similarly subnormal 5-10 days out (31 up, 34 down).
Conversely, when the net number of new low days in SPY is five or greater (N = 55), the next ten days in SPY average a gain of 1.03% (41 up, 14 down)--quite a positive edge.
Quite simply, it's made us money since 2004 to buy the market when SPY has been making multiple new 20-day lows. It has actually cost short-term traders money to buy the market when SPY has been making multiple new 20-day highs.
What that's really saying is that we haven't been in a trending market over this time frame. A trending market is one in which buying highs or selling lows is significantly more profitable than the reverse. There were times during the 2003-2004 runup in which buying multiple new high occasions was profitable. That hasn't been the case, however, for going on three years and-- given divergences in the market among sectors (small/mid caps, NASDAQ)--I'm not inclined to pronounce that "this time will be different".
Note in today's Weblog, however, that a peak in multiple new high days tends to precede short-term market price peaks. Given that we just hit a peak of 8 on Wednesday, it is also reasonable to conjecture that we have not yet put in a top for this particular market move. It's when we've seen price highs at progressively lower net numbers of new high days that, since 2004, the market has tended to correct significantly.
Subscribe to:
Posts (Atom)


 Posts
Posts


