Monday, September 18, 2006

Stop Loss Exits: Managing Risk vs. Managing Anxiety


In a recent post, I suggested that stop-loss points have a way of limiting opportunity as well as risk. My observation was the result of testing hundreds of trade setups with the Odds Maker program and noticing how such staples of the market literature, such as fixed price-based stops and trailing stops, severely degrade the performance of those setups.

Should one abandon stops altogether? I think not. If we consider every trade to be a hypothesis that is based upon our understanding of the marketplace, we owe it to ourselves to abandon that trade once the hypothesis is disconfirmed. The problem with most price-based stops is that they are not formulated with these hypotheses in mind. They are employed, I suspect, as much to manage the trader's anxiety as to manage objective risk.

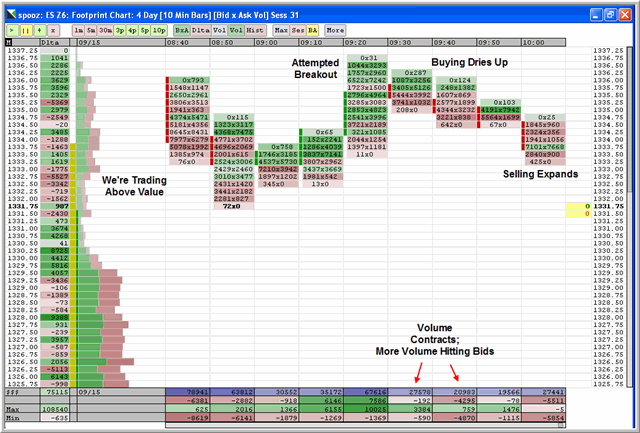
Above is the Market Delta chart from the Friday AM ES market. The Odds Maker trade setup suggested that fading breakouts of the morning's 30 minute opening range and holding that position for 30 minutes produced, in the past three weeks, eight winners in fourteen trades and an average win size considerably larger than the average loss size. (See my Trader Performance page for details).

Notice how buying dried up after the attempted upside breakout. (My Trading Markets article scheduled for later today explains this in detail). Order flow was telling us that it was reasonable to hypothesize that we had made a short-term price high and would move lower. My own research suggested we would test the average trading price for the morning, as I posted to the update for that day. Suppose, however, that a news item hit the wires and new volume came to the market, lifted offers, and gave us expanded volume at 1336 and above. Clearly that would have invalidated my idea of buying drying up. Stopping out the trade even before it became a loser would make sense in such a circumstance.

A trailing 3 tick stop, however, in the name of "locking in" profits, would have led to the premature abandonment of a profitable trade. Three ticks of heat is normal for such a trade. We know this from studying the individual trade setups and their maximum adverse excursions. Simply because a market moves against a position does not necessarily mean that the underlying trade idea is invalid. The important thing is to know your trade idea and what would truly invalidate it.

Not knowing what would invalidate a trade can lead to much frustration. A good example of this is the common practice for traders to place their stops just beyond obvious price points of support or resistance. Large locals, knowing this, will work orders in the book beyond those points, push the market past support/resistance, trigger the stops, and then let the puking traders fill their resting orders. If you look at any daily ES chart, you'll see plenty of such "false breakouts."

A good trade idea already has risk management built in. If your trade idea is a tested one, it has to have both an exit and an entry. It cannot be tested otherwise. The time-based exit of my trade accomplishes a great deal of risk management. Beyond that, judiciously allocating limited capital to each trade and diversifying trades among time frames and asset classes accomplishes the bulk of risk management. Think of managing portfolio risk, not (micro) managing each trade. The stop-loss on my 30 minute trade--or any single trade--is a last resort. It has a value and purpose, but it cannot shoulder the entire risk management burden.

Is your stop loss criterion truly protecting you from the risk of future adverse price movements, or is it stopping your temporary level of anxiety about a drawdown during a trade? Do you really know how your stops impact your trading performance? What makes us most comfortable in the markets is rarely what enables us to pursue opportunity. The best stops protect us from our fallibility, not from our frailty.

Sunday, September 17, 2006

What Yields Tell Us About Equities


A little while back, my wife and I received notice that one of our certificates of deposit was going to mature. We considered all the options for the funds: buying a new car, putting the money in a retirement savings vehicle, adding to college savings, investing in stocks, etc. In the end, we found a promotional money market account at a local bank that guaranteed us well over 5% on liquid capital. We went with that, opting for flexibility above all.

On a very small scale, my wife and I experienced what markets go through daily: calculations regarding how much reward to pursue for a given amount of risk. There are times when guaranteed return of capital becomes more important than absolute return on capital and investors take the bird in the hand. Other times, it makes sense to pursue those long-term returns on equities, drawdown periods and all.

The chart above covers the period from 1982 to the present. I tracked the weekly dividend yield of the S&P 500 Index and the yield on 1-year Treasury Bills. I computed a 52-week moving average of the difference between the Bill yield and stock index dividend yield and then looked at how far above or below that moving average we were in yield percentage terms.

What that gives us is a relative sense for when fixed income is more attractive (Bills give us more yield relative to stocks compared to the 52-week average) and when stocks are more attractive (stocks give us more yield relative to Bills compared to the 52-week average).

When the Fed tightens credit, those bill yields rise sharply and provide competition for stocks. Note how those rising periods leading up to peaks preceded some nasty market drops in 1983, 1987, 1990, and 2000. (We had a relatively benign market drop in 1994).

When the Fed eases, Bill yields plunge and stocks provide competition for fixed income. Note how the troughs on the chart occur at some nice times to have owned equities, including the recent market bottom in 2002.

Notice that, recently, fixed income has provided good competition for stocks (hence our household decision). Notice also that, with the recent decline in yields, that competition is lessening. Should we see weak economic statistics going forward and actual Fed easing of rates, we will once again visit the territory below the zero line. And that might lead our family to a different allocation of capital.

PS - My bad: Chart heading should read 1-Year T-Bills, not Notes. I originally looked at Note data, but stuck with Bills to better reflect Fed impact on short rates.

Saturday, September 16, 2006

How to F*&# Up a Trade Setup


Success in trading requires discipline and risk management, right?

We should always establish and honor stop losses, right?

But what if stop losses consistently minimize the profit potential of promising trade setups?

In the Trading Psychology Weblog the past couple of days, I've taken a look at the Odds Maker program from Trade Ideas as a way of establishing market regimes. You can think of regimes as the set of rules that the market has been playing by over the recent past. The Trade Ideas program screens the market for various patterns; Odds Maker tells you if those patterns would have been profitable if held for user-defined periods with user-defined stops.

For example, over the past three weeks, it has been consistently profitable to buy SPY after a break below the 30 minute opening range. That gave us 8 winning trades in 11 opportunities, with the average win size ($.46) exceeding the average loss (-$.04). Trading those opportunities provided the SPY trader with net winnings of $3.54 per share. That's with no stops and a holding period of 60 minutes.

Suppose, however, that we want to add a stop to our setup to limit our risk? We decide to exit any time the market moves against us by making a 15-minute price low after our entry. Now we have 4 winning trades in 11 opportunities, with the average win size ($.48) exceeding the average loss (-$.11), but overall profitability of $1.49 per share compromised.

Fine, let's widen the stop and exit if we make a 30-minute low. That really F*&#s it up. We have 2 wins in 11 opportunities. Yes, the average win of $.63 is fine and we've limited the average loss to -$.08, but now the net winnings are down to $0.96.

Indeed, in my work with Odds Maker I find it amazing how just about any configuration of stops degrades a trade setup. Not just for this pattern, but many others across different stocks and time frames.

Maybe--horrors!--the common wisdom has it wrong. Maybe it makes sense to limit the capital you assign to any single trade idea, properly diversify your ideas across time frames and trading vehicles, and contain your risk that way. Forget about stops, take the losses like a grown man or woman when they occur, and have the integrity to stick with your ideas.

At the very least, test your stops out in advance and determine if they're managing opportunity more than risk. I think you'll be surprised.

Friday, September 15, 2006

Market Psychology AM Update for 9/15/06

10:00 AM CT - Very early on we saw the top of a range formed when buying hit the brick wall, and then we made a low of the range when selling dried up in ER2. For now, we seem to be oscillating in that range, and the advice of my previous post is relevant. But, alas, dudes and dudettes, it's time for Dr. Brett to head for Chicago and attend to other traderly things. Have a great weekend. Update on the Weblog tonight and thru the weekend as always.

9:54 AM CT - Hopefully you could see how the buying dried up and we came back to the middle of the AM range. That's why I tell my student traders that, at the top or bottom of a range, there's always a good trade if you can read order flow. We'll either break out of the range and attract new participants/volume, or we'll revert to the mean of the range. It's a helpful heuristic.

9:40 AM CT - Let's see if buying continues to meet resistance and dry up at those AM lows. I've been selling moves to the highs and covering on moves down in the TICK. Not a way to get rich, but it covers the overhead... :-) Eventually if those highs hold, we should test the average price of the AM range at the very least, which is around 34.25.

9:12 AM CT - File that one away. Notice how you can follow order flow in the weakest market index and, when the selling dries up, you often will see a turnaround across the board. Just another example of how it's important to follow more than just the index or stock that you're trading.

So here's the answer to the question for you advanced dudes and dudettes. When volume at bid is high in ES but the TICK for the ES stocks is relatively strong, it means that institutions are selling futures and buying stocks as part of an arb trade. It is not a directional trade and the selling you see on Market Delta is not necessarily a sign of a downtrend. Indeed, those contracts generally get bought back. Yet another example of how you need to know *who* is in the market and *what* they're doing--not just sitting in front of the screen looking at chart formations and oscillator readings.

Let's see how we do at the AM resistance.

9:07 AM CT - OK, I'll toss a bone to you advanced traders out there. What does it mean when the volume at the bid is much higher than the volume at the offer in ES, but the TICK that is specific to the ES stocks (number of issues trading at their offer vs bid) is relatively strong? BTW, the tick specific to a particular index is available via the NeoTicker program. Answer in a few min. ER2 trying to put in that low, per the last post.

9:01 AM CT - If I were to play the long side here, I'd wait for the sellers to take their turn, drive the TICK down to negative territory, and see if the weakest of the 3 indices (ER2) holds its lows well. That would start me thinking about selling drying up and looking more closely at ES volume patterns in Market Delta. Let's see if that pans out, or if weakness continues.

8:50 AM CT - If you look at the volume on a five min by five min basis here, you'll see numbers considerably elevated above recent norms. Folks, I work with prop traders/locals. I know local-driven volume when I see it. This ain't it. Some longer timeframe traders--institutions--are selling into the strength, quite possibly as part of options expiration related strategies. It does not make sense to buy dips when the volume at the bid is far exceeding that at the offer.

8:45 AM CT - Interesting...a lot of those contracts bought on the way up after the CPI news have been puked out on the recent weakness. ER2 has retraced more than half its AM gain. My best judgment here, FWIW, is that that AM high might pose some stiff resistance, we could see us put in a low this AM, and then get range bound trade much of the remainder of the day. Just a hypothesis I keep in the back of the head. But if I suspect a range developing, I'll use volume-at-price (left side of Market Delta, the histogram) to try to identify the midpoint of the range and look to buy below and sell above once I see selling/buying dry up. That's a short-term trader's game; not for everyone. The selling into the pre-opening strength is apparent in the fact that the TICK has never gone above +600 so far. The selling was that "brick wall" effect I mentioned a while back.

8:37 AM CT - As you'd expect, the TICK opens with a positive distribution, advances lead declines by over 1000 issues, expiration-related volume very high. Normally, you'd think about buying pullbacks in the TICK, but some traders may elect to stand aside in the expiration-related cross-currents. ER2 still looking heavy, another cautionary note for those tempted to chase highs.

8:30 AM CT - *Very* early disparity in strength between NQ/ES and ER2, with the latter weaker. Just something I'm watching. You'd think a breakout rally would carry the broad market.

8:10 AM CT - On the heels of a benign CPI report, stocks have rallied above Thursday's highs. As Jason Goepfert of the excellent Sentimentrader site notes, expiration Fridays rarely turn out to be highly volatile, wide-range days, so we may see some cross-currents here. As long as we stay above the 1331 pre-opening high from Thursday with a positive TICK distribution and ES volume skewed more toward lifting offers than hitting bids, we have to go with the short-term uptrend noted in the Weblog the past couple of days. If you haven't read my latest Weblog entry on Odds Maker and the identification of regimes, you may want to check it out. It's an idea I'll be refining and hopefully posting next week. Back after the open.

The Value of Market Blogs

In my previous post, I made the distinction between descriptive and inferential statistics. When we describe a sample of the world around us, we take the first steps toward formulating hypotheses about that world. When we employ inferential statistics, we report tests of those hypotheses. Generating hypotheses, testing them, refining them based on tests: this is much of what science is all about.

But there is one crucial, missing ingredient: theories.

Theories are our explanations of the world we see. When we observe and describe our sample of the world, we build a model based on our perceptions and say to ourselves, "This is what I think the world is like." That model--our theory--provides us with the hypotheses that we test. When we check out and revise our hypotheses based on those tests, we're really refining our internal models of the world: our theories.

So where do market blogs come in?

It is rare indeed to find market blogs reporting statistical significance tests. Blogs are online journals: they describe; they do not infer. The really good blogs show you how an experienced investor/trader thinks. They not only provide valuable observations, but show readers how the writer moves from description to explanation: from data to model of the world.

Barry Ritholtz recently mentioned that he has three objectives in market analysis: 1) determining objective reality; 2) determining consensus on market issues; and 3) identifying where consensus varies from reality. In other words, he builds the most accurate model of the world that he can and then tries to find where market prices are not factoring in that model. This is the essence of opportunity: points at which the majority of market participants have not adequately updated their own models of the financial landscape to account for new realities.

The financial blog attempts such updating--hence the popularity of links--but also illustrates how the blogger uses this information to generate his or her own map of the world. Specific trade ideas generated from this theory can be thought of as partial tests of the blogger's map; over time, it is objective reality itself that provides the tests of the trader's ideas. In that context, every trade is a hypothesis: the trader's P/L over time reflects the degree to which the trader is skilled at generating and updating models of the world that are superior to the models of the consensus.

How does one learn to become a scientist? In graduate school, you join a research lab and apprentice yourself to an experienced investigator and the senior students of that investigator. Such an apprenticeship teaches skills, but also produces a modeling of the scientific process. For many traders, reading the ideas of experienced market participants in the blogosphere is as close to an apprenticeship as they're going to get.

That is the value of the best blogs. They don't just produce thoughts about markets; they model how to think about markets.

Subscribe to TraderFeed

Thursday, September 14, 2006

Market Psychology AM Update for 9/14/06

10:25 AM CT - Note that our last TICK pullback took us to 1325.5. We need to hold above that level for the bulls to make their charge. Note how the TICK has shifted positively, with buying in NQ and ER2. It's those transitions you want to train your eye to see. Have a great day.

10:09 AM CT - Again, we seem to be struggling to put in lows in that 1325 region, but waiting for those pullbacks in the TICK and for averages to hold above their lows makes lots of sense if you're leaning to the upside. Note that we tested yesterday's lows in ER2; I'd want to see those hold if I'm going the bull way. NQ so far is strongest of the three. Volume at bid continues to outweigh volume at offer in ES and decliners lead advancers by around 900 issues. I continue to believe we'll take out AM highs if we hold above these lows on selling squalls; we're testing that as I write. A break to new lows target yesterday AM lows. I'll post later if major developments occur; otherwise, have a great day. Update tonite on the Weblog.

9:40 AM CT - Volume at bid continues to outweigh volume at offer in ES. The key to the next move, IMO, is whether we break down to new TICK lows and begin a more negative TICK distribution or whether we see selling dry up in this 1325 region and the market eventually break to new TICK highs and begin a process of higher highs, higher lows, etc. I'd like to see strength in the weakest of the three indexes (Russell) before committing major resources to the bulls.

9:24 AM CT - Just off the phone with a trader; hard to trade, talk with traders, and do the blog all at the same time! Talk about multitasking...but it's fun...Anyway, what I said to the trader is don't chase markets to the upside. If you think we've bottomed out around 1325, wait for the sellers to take their turn. You'll recognize that by the drop in the TICK. If the TICK drops and stabilizes and we hold above the lows, you have a nice entry to test the AM and overnight highs. Your stop can be below the AM lows. It's amazing how much of profitability is simply waiting for good prices. Let's see if the current drop in the TICK holds above prior TICK lows and at higher price lows.

9:13 AM CT - Volume remains solid for this time of day, suggesting we'll have decent volatility through the day trading session. The market is bravely trying to hold its own in this 1325 region, but volume at bid continues to outweigh that at offer in ES. We need to see that distribution shift toward the bulls before committing a great deal to the long side. Ditto the TICK distribution. Note how the buyers and sellers take their turns in the market, with the rises and falls of the TICK. We want to see those TICK declines occurring at less negative levels and at higher price levels to be aggressive on the buy side. The reverse would target yesterday's AM lows.

8:59 AM CT - Some buying interest has entered the market as we got near the 1325 area where we have done a fair amount of volume over the past three days. The X axis histogram on Market Delta shows that well. That buying has lifted the NQ and ER2, which had been leading the downside. Let's see if that 1325 area can hold on any fresh selling bouts; if so, we have an entry possibility to the long side to at least test AM highs.

8:45 AM CT - Volume is heavier than its recent average for this time of day, which means that we have more than just locals in there juking the market around. There has been meaningful selling from yesterday's highs as we approach bull market highs in the large cap indices. The usual pattern is for rising markets to sell off, bottom out, and then return for tests of highs as part of range-bound trading. In other words, bull runs normally transition into range bound markets, not bear runs. The key to trading a range bound market is finding its "fulcrum": the average trading point of the range as it emerges. Then you can frame meaningful trade ideas as you test highs and lows above and below that fulcrum. At this point, I'm still waiting for selling to dry up; then I'll worry about average prices and moves toward those.

8:36 AM CT - The broad market is weaker than the ES in very early trade. Declines lead advances by nearly 600 issues and the TICK is skewed negatively. ER2 and NQ are at AM lows, unlike ES. I'm going to wait for the broad market to show some drying up of selling before making any long side moves.

8:10 AM CT - On the heels of the retail sales report, we traded below the pre-opening range to that point and have gone slightly below yesterday's average trading price of 1327. We have upside resistance from the overnight session at 1331; we're below yesterday's midday support at 1326.75; 1322.75 was the AM low. My first priority will be to see if the selling dries up this AM or continues, so a reading of the Market Delta volume at bid/offer will be important. As mentioned on the Weblog, following a day of strength and low VIX, it's common to get near-term weakness before moving higher. That's the pattern I'll be looking for today and tomorrow. My update on the Odds Maker research will appear in tonight's Weblog and will tie into my last blog post. Back in a few after the open.

The Most Common Mistake Traders Make

What is the trader's most common mistake? Candidates abound: failing to diversify capital, adding to losing positions, trading through stop-loss levels, trading on hot tips and news items, revenge trading to recover losses, overtrading during slow periods: the list goes on and on.

I'd like to suggest, however, an even more fundamental error that gets traders into hot water: They confuse descriptive statistics with inferential ones.

Allow me to explain.

A descriptive statistic summarizes some characteristic of a sample of a population. Lets say I go out on the sidewalk and survey passers-by as to their political leanings. I find that 65% of the people in my survey support the mayor and plan to vote for him. That is a descriptive statistic. If I conduct the survey several times in a row and find that the percentage stays steady at 65%, this, too, provides a description of my sample.

Much of the information that traders work with is descriptive in nature. Consider these statements:

* The market trendline is up;
* Advancing stocks are ahead of declining stocks by 2:1;
* We are making new weekly highs in the market;
* Volatility is at a new monthly low;
* The market made a breakout from the trading range.

All of these are descriptive. They take a sample from a price or indicator series and describe characteristics of that sample.

All good science begins with observation and description. Such qualitative, descriptive analysis allows us to notice regularities--or patterns--in our data and frame meaningful hypotheses based upon these.

Descriptive statistics can lead us to the formulation of hypotheses, but they cannot provide tests of those hypotheses. That is the role of inferential statistics. To test a hypothesis, we must evaluate multiple samples and verify the existence of suspected patterns. My hypothesis, for instance, in the above example might be that the mayor will win the upcoming election. To test that hypothesis, however, I would have to conduct multiple surveys in different neighborhoods at different times.

It would be a mistake to assume that a description of a sample necessarily reflects the properties of the entire population. The sample of voters on my sidewalk may not reflect the composition of voters in the entire city. Generalizing from a single sample to an entire population is dangerous: it confuses a hypothesis with a conclusion.

But that is the mistake that many traders make: They proceed directly from descriptions of recent markets to assumptions about future ones. They assume that the sample of recent price changes can be generalized to the population of all price changes. Thus, they'll conclude that the market is going to rise because the trendline is rising; that we have a bull market because stocks have been advancing.

The only way to know that, however, is to test a number of rising periods and see whether indeed rising prices in the past lead to future rises significantly more often than not. That's the role of inferential statistics, such as tests of significance.

Jeffrey Miller, Ph.D., in his blog A Dash of Insight, neatly frames the issue: We need ways of deciding whether or not market moves (or trader P/L) are due to luck.

That is the most common mistake traders make. We assume that strings of events are meaningful, when--much of the time--they reflect the luck of chance. The patterns perceived by our minds are not necessarily patterns that exist in nature.

The quantitative, system trader trades patterns that have been tested with inferential statistics. The discretionary trader trades descriptive hypotheses that he/she validates with updated, real-time readings of market conditions. Is the discretionary trader justified in doing that? The same inferential tests that inform us of the validity of trading systems, when applied to the trader's trading results, will answer that question.

That is why I find programs that establish and evaluate trader performance metrics, such as Trader DNA, to be so important. Only by evaluating results can discretionary traders know whether or not their judgments are adding skill to luck. Of the discretionary traders I know personally who have made more than a million dollars a year for multiple years, one characteristic stands out: they obsessively keep score. They track their results carefully, figure out what they're doing right or wrong, and make periodic adjustments. As Bill Rempel perceptively noted, they, too, are trading systems.

Wednesday, September 13, 2006

Market Psychology AM Update for 9/13/06

10:36 AM CT - Very much a range bound market to this point. We finally got that move to AM highs above yesterday's highs after a local-driven shakout; we need NAZ, ER2, and TICK in upside gear to sustain those new highs. Have a great rest of the trading day.

9:45 AM CT - The erosion of the NAZ and ER2, along with the weakening volume at offer vs bid prevented the ES from breaking those highs. Always a danger sign when you see huge offers act as a brick wall to a rise. We're back to targeting that average price for the day if we take out the early AM lows. Off to do some work with traders; update tonight on the Weblog. Have a great day.

9:30 AM CT - Big offers holding market down at that 1325.5 level. Need to see good buying take those out to get the anticipated new highs. Lots of jockeying among locals here.

9:22 AM CT - Market trying to make a bottom at 1324 area. Watching order flow carefully.

9:16 AM CT - Not too much has changed; the TICK distribution remains positive, despite some resistance at that 1326 level and some recent TICK weakening. Russell and NAZ looking a bit heavy here. I'm watching carefully to see if selling dries up here or accelerates. As long as we stay above the early AM lows with a positive TICK distribution, I'd expect to take out that 1326 level and test the recent bull swing highs at 1327.75. A break below the early AM lows targets that 1320 average price from yesterday. The MDY trade worked out fine; I'll report on my Odds Maker work on my personal site for the next couple of days.

9:02 AM CT - Clearly the IWM short did not work out; in general, I hate taking trades that early in the session, because I don't yet have a good feel for who's in the market, how volume is distributed, etc. Odds Maker allows traders to filter that out. We got drying up of buying at the 1326 level in ES and that would have been a discretionary point to take profits on the MDY long trade. That one closes out at 9:12 AM. I'm going to work further with Odds Maker to refine signals and their timing before doing anything further in real time.

8:51 AM CT - Solid volume, volume at offer exceeding volume at bid for ES, and a positive TICK distribution. Similar to yesterday. That's why you'd take buy setups short-term more seriously than sell ones. We're getting that test of ES highs from yesterday; let's see how the volume distribution breaks down as we get up there.

8:42 AM CT updated 8:47 AM CT - Buy signal 30 min hold in MDY from Odds Maker 137.65; unfortunately Blogger problem prevented me from getting out quicker. Again for observation only. The IWM trade flew in the face of order flow, which supports my idea of filtering these trades for how the market is actually handling volume and orders at the time.

8:40 AM CT - Early volume decent, less strong so far than yesterday. Pretty flat in advance decline ratio; TICK a bit on the positive side. So far, nothing to dissuade me from an eventual move to test yesterday highs. I'll let the Odds Maker signal play out for observation only; close out at 9:02 AM. Given the positive TICK thus far, it's not a signal I would normally take.

8:32 AM CT - 30 min sell signal in IWM from Odds Maker 72.17.

8:20 AM CT - If you haven't yet read the blog entry on sport psychology and trading, I'd like to (humbly!) recommend it. I think the ideas are important. As the update noted yesterday, we had an uptrend day yesterday on the heels of the breakout move, and recognizing that early was a key to taking a little money out of the market. The odds are in favor of us taking out yesterday's nearby high of 1326.25; we're also looking at resistance at the 1327.75 area. The overnight range has been muted, and the VIX is back to below 12, so it would not be a surprise to see slow, range bound action. The first upside target is the 1325 area; to the downside, we have the overnight lows around 1323 and the 1320 average trading price from yesterday. Catching early strength/weakness for tests of these levels can frame early trades. I'll be watching for the Odds Maker setups. Back in a little while.

Research in Sport Psychology: What It Means For Traders

Of all the performance fields, sports have stimulated the most research. A 2001 review of findings in sport psychology, for example, takes up well over 800 pages and 30 chapters and already it is being replaced with a 900+ page volume in 2007. When I began writing my book Enhancing Trader Performance, I realized that traders--and mentors of traders--knew little about this research, and yet many of its findings are directly relevant to trader development.

One of my favorite researchers in the sport psychology field is Janet Starkes in the Department of Kinesiology at McMaster University in Ontario. Her research summary in the 2001 Handbook of Sport Psychology is a particularly clear integration of work in the areas of sport and dance.

Here are a few conclusions from the chapter by Drs. Starkes, Helsen, and Jack and what they might mean for traders:

** "The finding that experts in a particular sport are better than novices, not merely at physical skills but also on the underlying perceptual, cognitive, and strategic components of sport, is robust in both laboratory and field research" (p. 175). In other words, when people become skilled, they literally learn to see things in new ways and think in new ways. It's not just a difference of hardware (having better memory, vision, or concentration); experts develop their own software: internal programs that enable them to recognize patterns and act upon them rapidly.

** "The primary importance of the "10-year rule" is that it seems to hold up regardless of the domain investigated. As such, it is one of the most robust findings in expertise research to date" (p. 175). The development of the "internal software" that enables batters to recognize pitches, soccer players to seize openings in the field, and traders to find setups on the fly requires a lengthy process of development in which experience becomes internalized to the point where it is second nature. Structured practice, sustained over time, is essential to success.

** "Understanding what practice is best and how practice should be carried out are even more important questions than how much" (p. 175). As sport psychologists say, it's not that practice makes perfect. Rather, it takes perfect practice to make perfect. Practice that is effective provides immediate feedback and correction to learners and structures tasks in a logical progression, with skills broken down into components for repeated drilling. Sitting in front of a screen and trading is not practice; sitting in front of a screen and drilling placing and managing orders in the book based on readings of order flow is.

** "Data from sport studies also indicate that those practice activities that require the greatest physical effort and mental concentration are ultimately the most enjoyable" (p. 175). This gets at the heart of what develops expertise. The expert performer, in trading as in sport, is born with certain talents and finds the exercise of these to be fulfilling and enjoyable. This sustains the developing performer through the lengthy, 10-year learning curve. The "flow" state described by Csikszentmihalyi is also a state of enhanced information processing. A key to training success is structuring learning to sustain the flow state: that is a major function of coaches.

** "Whether one examines wrestling, figure skating, karate, soccer, or field hockey, there is a montonic relationship between the amount of practice in which one has engaged throughout one's career, and one's eventual athletic success" (p. 186). The way I stated this in my book is that, in every performance field, expert performers spend more time practicing and honing skills than in actually utilizing them in formal competition. Rarely, however, is this the case among traders. Is it so surprising that--according to industry insiders--the average trader blows out of their account within seven months?

On my personal site and in this blog, I cover a range of ideas related to the psychology of traders and the psychology of markets. Few of these ideas, however, are as important as the ones above. Trading psychology can be so much more than endless discussions of controlling emotions, instilling discipline, and thinking positively. The best trading psychology is training, properly structured and informed by research.

There are some good online trading rooms out there. I recently met Andy Swan of Daytrade Team, and it looks as though they're educating traders about trading patterns in real time. I have nothing but positive things to say about Woodie and the CCI Club, which is an unusually supportive and informative real-time forum for learning trading. John Carter's Trade the Markets service comes highly recommended as a place to observe and learn trading in real time. I've known Linda Raschke for quite a few years now and can only offer the highest praise for her continuing online, real-time efforts to educate traders in both futures and equities arenas.

Those are great places to start your training. Eventually you'll need a trading gymnasium: a place to practice skills, obtain feedback, and develop your own expertise. I'm pleased to see that the Chicago Mercantile Exchange, in partnership with the Chicago Board of Trade and the New York Mercantile Exchange, is taking a leadership role in addressing this need. With that kind of institutional support, we may yet get to the point where the development of traders can reach the level of sophistication that we're seeing in sports.

Tuesday, September 12, 2006

Market Psychology AM Update for 9/12/06

10:45 AM CT - Per my last entry, at the end of the day when you review charts, take a look at a 5 min chart of the NYSE TICK vs. the ES. You'll see how pullbacks in the TICK around the zero area represented good short-term entries to the long side once we had the upside breakout move. This is a pattern that you'll see during many uptrend days. Note also the tendency of those uptrend days to close near their highs and to make their highs in the last hour of trading. That means that you want to keep riding those short-term entries until the TICK and price take you out of the trade. The last trade of a trending move is always a loser... :-) Have a good one.

10:00 AM CT - One last note before I go off for my phone meeting. On a good breakout/uptrend day, what you'll see is a positively distributed TICK where the TICK will come down toward the zero area (not much below -200, certainly) on dips and then retest and take out highs on subsequent TICK rallies. You can think of an uptrending market as one in which successive dips in the TICK occur at higher price levels. With that in mind, those dips in the TICK become candidates for short-term entries to the long side. Have a great day--

9:38 AM CT - No Odds Maker signals so far this AM. We haven't gotten the pattern of thrust and then retracement needed for that signal; it's pretty selective. There were, however, a couple of signals among the Dow stocks. I might start tracking those here in the near future. I have to prepare for a phone conference with traders at an investment bank; will post again if any major new developments. Otherwise, have a great trading day. Update tonight on the Weblog.

9:30 AM CT - Once the Russell saw some lifting of offers, the averages moved in gear, with a continued positive TICK distribution. In general, when you see persistent positive TICK distribution, it will only be a matter of time before price catches up. Another important indication is persistent strength in advances vs declines, with 1200+ more issues now advancing than declining. As long as we stay above the recent trading range and see continued positive TICK and net volume at offer vs bid, the bias should be to the upside.

9:22 AM CT - The Russell and financials are lagging a bit here on this most recent ES runup. Be careful, despite very positive TICK distribution. I'm watching Russell closely for clues as to direction from here.

9:13 AM CT - Paper came in big and swiped a large offer from the locals at 1314.75, but since then we haven't seen persistence of buying (which surprised me). If we move back into the recent trading range, remember that 1309 as an average price would be a target.

8:55 AM CT - Huge battle between big bids and big offers at 1314.75. If we take out those offers, I'd expect some decent upside.

8:46 AM CT - You can see that the attempt at highs is labored here among the 3 indices, with volume at offer so far not getting it done. Interestingly, volume at bid was quite high even as we rose early, suggesting lots of selling into the rise. TICK distribution remains positive, however, so it will be tough to maintain solid downside as long as that's the case.

8:36 AM CT - We've opened strong; solid volume, positive TICK, advancing stocks lead by more than 750, but I need to see us break yesterday's highs in Russell and NAZ before I get too eager to chase highs.

8:28 AM CT - Good AM. A little data problem here, but not too serious. I'll be updating major shifts in volume this AM, along with any signals we might get from the Odds Maker setup described on the Trader Performance page. We dipped below the PM lows overnight, but since have recovered nicely and are trading near the highs of the afternoon. Note that we've had average daily prices of 1308-1309 for three days now: the big issue is whether or not this will be a magnet for current prices or whether we'll see an upside breakout from here. Update shortly after the open.

8:06 AM CT - Just a quick modeling note. Adam Warner notes that the volatility of the VIX itself recently reached a 52 week low. I examined 10-day average ranges in the VIX from October, 2003 to the present (N = 732 trading days). When the average daily range of the VIX was under 5% (N = 60), the next five days in SPX averaged a loss of -.52% (23 up, 37 down). That is much weaker than the average five-day gain of .17% (414 up, 318 down) for the sample overall. Returns seem to be better when there is volatility in the VIX itself.

When Oil and Gold Are Falling, What Happens Next?

As I mentioned quite recently, much has changed in the markets. The past 40 trading sessions have seen quite a change of fortunes. While the S&P 500 Index is up over 5% during that period, oil is down over 13% and gold is down over 8%. Is this bullish, indicating a lessening of inflationary forces, or is it bearish, suggesting an economic slowdown? I decided to take a historical look.

Going back to 1990 (N = 4170 trading days), we find 162 daily occasions in which oil has been down 10% or more over a forty-day period and gold has been down 5% or more. Forty days later, the S&P 500 Index has been up by a very healthy average of 3.87% (120 up, 42 down). That is much stronger than the average 40-day rise of 1.45% (2669 up, 1501 down) for the sample overall.

Of course, many of these days represent overlapping periods in SPX. Let's break it down:

* We had falling oil and gold in March and April, 2003. That was a great time to buy stocks.
* Falling oil and gold in November and December, 2001 was not a good time to own stocks.
* We had one day that qualified in July, 2001, and it was a very bad time to own stocks.
* A series of days in April, 2000 with falling gold and oil offered mixed opportunity.
* June, 1998 also offered most lower stock prices after falling oil and gold.
* December, 1997 and January, 1998 were excellent times to own the S&P.
* July, 1997 was most positive as a time to own stocks.
* February, 1997 was a losing time to own stocks during falling oil and falling gold.
* February and March, 1991 were excellent times to hold stocks when oil and gold fell.
* November and December, 1990 were also good times to hold the S&P.
* March through May, 1990 featured falling oil and gold and were mostly excellent times for stocks.

The pattern I notice here is that the occasions in which stocks performed best during periods of falling oil and gold were ones in which the significant declines in oil and gold were sustained over multiple months. Very short significant periods of falling oil and gold were not so favorable to stocks as lengthy periods that extended for more than a month. The longer oil and gold stay weak, it would seem, the better it is for stocks forty days hence. I will track this in the daily market summaries on the Weblog.

Monday, September 11, 2006

Market Psychology AM Update for 9/11/06

11:00 AM CT - OK, I'm glad we had at least one Trade Ideas setup from Odds Maker today. Turned out to be a pretty good signal, all in all, given the tail-off in market volume. You can see the tension between monitoring order flow/using discretionary exits vs. letting the trade play out for the full 30 minutes. I would have been content with four ticks profit in a slow market, but could have pulled more out if I had been more patient. Waiting the full 30 minutes would have not made a huge difference vs. exiting early, in the end. Let's continue to track the signals tomorrow. Have a great day.

10:45 AM CT - Volume has really tailed off here, so in reality I would probably take what the market gives me, work a bid for a point profit, and call it a win. Yes, it could always break down, but I don't see the sense of hoping for volume when you can take a point out relatively easily.

10:39 AM CT - The setup was triggered at 10:29 AM CT, so the time-based stop is 10:59. My idea was to use order flow to manage the position. For me, 1307.50 would be a "catastrophic stop" to the trade; I'd also rethink if we had another thrust of TICK above +1000. My preference is to let a negative TICK thrust take me out of the trade and only stay in for the full holding period if I'm seeing downside volume pick up.

9:58 AM CT - I continue to show the 1306.5 area as an Odds Maker sell signal if we seeing buying dry up around there. The market has been trying to hold lows in this low 1300s area, but we'll need much more sustained buying interest (TICK, volume at offer) to accomplish that. Watch that TICK distribution. I'm outta here for the day; update on the Weblog tonight. Have a great day.

9:49 AM CT - Some slowing of selling in ER2; keep an eye out.

9:43 AM CT - The move down qualifies as a downthrust. If we get a bounce to the 1306.5 area with buying drying up, that would trigger the Odds Maker sell signal. Note the continued Russell weakness, and the negative distribution of the TICK. That will need to change to break the significant upside resistance around 1307.5. Any test of 1303 will need to see expanded participation to create a downtrending move; be careful if we break that level but do not see an expansion of volume at the bid.

9:30 AM CT - Tough to trade this market if you're not a scalper who reads the order book. Some large offers stayed in the book as we broke 1305, and that pushed us down. Sellers in control; 1303 the overnight low; 1307.5 is the AM resistance.

9:27 AM CT - I'm not seeing the same big bids at 1305 so far; some flashing of big offers

9:22 AM CT - The big bids came back at 1305, so you can see what the locals are doing: pushing the market one way into their bids and then the other way into their offers. That creates the runs and the rangebound trade.

9:14 AM CT - Some flashing of big offers a few times at 1307; it's only if they stay in the book that they truly count. But so far they've warded buyers off.

9:02 AM CT - Some volume pickup when the market's moved down, but still very much a local dominated market, running up and down in that value range for the most part. Notice how the Odds Maker setup keeps you out of a slow, narrow market. There's no thrust up or down to begin the setup and thus no pullback from the thrust to trigger an entry. Obviously, we could widen the search by looking for volatile stocks or ETFs for the pattern, but that's for another day.

8:55 AM CT - What we're seeing is a lot more selling in the broad market than in the large caps. Note the Russell weakness and the declining stocks with a 1300+ lead over advances. TICK distribution has gone negative, and so has the balance of volume at bid vs offer. There's some real absorbing of selling around that 1305 level per my previous post.

8:52 AM CT - Some big bids defending the market at 1305.25 on a few occasions. Watch for a selloff if they can't hold the market.

8:45 AM CT - Volume is modest; certainly no great signs of either trending activity or heavy institutional involvement thus far. Note how we're traversing one end of the value range to the other, per the last update. Declining stocks lead advancers by nearly 1000 issues, and the TICK has stayed in a narrow range. Volume at offer has outpaced that at bid in early ES trade; NAZ showing a little strength here. More in a bit.

8:26 AM CT - I show the fat part of the value area over the past three sessions as running from 1306 to 1309.50. In a slow, rangebound market that region will serve as a magnet, and moves that fail to break out of that range will tend to test the opposite side as part of normal rotation. Note that we were unable to sustain a break below that range in the pre-open, so a move to new lows that shows strong participation would represent fresh supply hitting the market. Please note that any alerts generated from my Odds Maker screen are not intended as trade recommendations. This is simply a setup that I'm following in real time as part of learning the Odds Maker program and gauging its utility. Consider the information one input into your market thinking. It can't substitute for that thinking!!

8:10 AM CT - Good morning! We've traded lower in the preopening of the ES market, dipping below Friday's lows before recently moving back into Friday's range. We have overnight resistance at 1310 (Dec. contract) and the preopening lows represent our support. Recall that volatility in the overnight session is associated with greater movement during the regular day session, so I expect one of those levels to be taken out. We'll be watching to see if there are signs of institutional participation in such tests and if volume picks up at those extremes to handicap the odds of breakout vs. return to value. Meanwhile, if you haven't read the blog entry on combining system and discretionary trading and my Trader Performance page describing the Odds Maker setups I'll be tracking, please do so. I'll be watching this AM to see if we get any real time setups from the pattern I tested. Back after the open.

A Walk Along the Third Rail

Religion and politics are two topics to steer clear of if you're hosting a social gathering (or a financial blog!). There are just some third-rail topics where, if you stake out any position, you're going to be open to potshots. It's why the immigration topic has proven so contentious, along with the reform of Social Security and health care. Of course, some people have figured out that you can get a lot of attention by walking along the third rail and staking out positions guaranteed to offend people. From Ann Coulter on the right to Michael Moore on the left, the third rail has become a way of life.

The majority of us are finding it increasingly difficult to steer clear of the third rails, given the commingling of religion and politics. On this 9/11 anniversary, Michael Moore pictures bin Laden and asks us to love enemies and forgive trespasses. The Obsession movie, on the other hand, anticipates calamities far worse than 9/11 if we do not take the Islamic enemy seriously. Do we begin the pull out of Iraq, or do we commit further resources toward the "War Against Terrorism"? Is there truly a "War Against Terrorism" out there, or is it a war against Western occupation?

Sometimes markets shed light on issues. Eddy Elfenbein of Crossing Wall Street notes the superior performance of defense stocks and asks if defense might be the NASDAQ of the decade. He notes that defense stocks sold off in advance of the end of the Vietnam War and ahead of the fall of the Berlin Wall, anticipating an end to hostilities. Today, the anticipation seems to be much different. Elfenbein suggests that this means that we might be in Iraq for a while.

Maybe. I suspect that a continuation of our presence in Iraq would be sufficient to keep defense stocks at lofty levels. I'm not sure it's enough to keep powering them higher. No, I think--and here's that third rail--that perhaps the markets are anticipating an escalation of hostilities.

Let's give the conservative leadership the benefit of the doubt for a minute and assume that they truly believe what they say. They believe that Islamic fundamentalism represents a potent threat to Western civilization. They believe that World War III has already begun--a war that is every bit as important to freedom as the previous world conflict.

What do you do if your watch is coming to an end and you deeply believe that the future is at stake if you do not act?

Father Thomas Berg recognizes the gravity of the issue and asks who we can trust for guidance. Perhaps our leadership asks the same questions.

And the markets reflect their answers.

Sunday, September 10, 2006

Much Has Changed in Four Months

While the media divines the changes in the U.S. since 9/11 five years ago, I look back four months to 5/11 and see quite a few changes in the financial markets.

On 5/11, West Texas Intermediate Crude (cash) stood at $73.33 a barrel. Friday it closed at $67.33.

On 5/11, interest rates on the ten-year note were 5.15%. Friday, they were 4.79%.

On 5/11, gold was trading a bit over $715 an ounce. On Friday, gold closed at $621.

The CRB Index topped above 360 in May. On Friday, it closed a little over 320.

The Housing Index ($HGX) is down about 20% since May.

On 5/11, the S&P 500 Index had just hit a peak value for this bull market, a bit over 1325. As of Friday, the S&P is at almost 1299 and has not surmounted that May peak. The NASDAQ and Russell averages, in percentage terms, are even further from their May peaks.

M1 money supply also peaked in May, according to the Federal Reserve. M1 money supply, from late 2004 to the present, is down over a 20 month period. I last show that happening in late 2000, as the markets were topping, and in late 1997 in the lead up to the Asian currency crisis and market drop.

The good news is that the Fed seems to be having success in cooling the hot housing and commodity sectors. Such restraint of money supply needed to accomplish the cooling has only been reversed once we've had meaningful market drops. Let's see if this time is different.

Saturday, September 09, 2006

Blending System and Discretionary Trading

I've recently emphasized that the psychology of the marketplace is as important as the psychology of the trader. If you review my recent AM market updates, you'll see that the purpose of these is to track the market's psychology: the short-term sentiment of the large traders who account for only about 3% of ES trades, but 40% of its volume.

Two trading tools have very recently come out with new products that I'm working on integrating into my own trading (and also into the blog). The first one, Market Delta, is illustrated in my recent post on tracking volume and in my recent Trading Markets article. I find Market Delta to be most helpful in tracking order flow: the quantities of contracts traded, where they trade in the bid-ask matrix, where they trade relative to support/resistance/value area, and how these volume patterns shift over time. A review of the recent AM updates will illustrate this application.

The second tool is Odds Maker from Trade Ideas. To be honest, I've had a harder time integrating this tool into my trading. I'm not by nature a stock picker; I trade equity indices. I very much like using research into historical patterns to frame trade ideas, but have never gravitated to intraday research. Too much noise. As I've noted in my Trader Performance page, I've lengthened my time frame to focus on moves of several days rather than trade intraday patterns exclusively. That's given me the flexibility to do the market updates daily.

Still, Odds Maker is a powerful tool and not one that I wanted to ignore. What it does is go back three weeks (15 trading sessions) in time and scan for all occurrences of a pattern that you identify in the Trade Ideas program. It will then spit out a performance summary to tell you how many trades would have been made during that 15-session period, how many were winners and losers, the average size of winners and losers, and the net profit/loss trading that pattern. The performance summaries can be for the entire market, a selected basket of stocks, or an individual equity. User-controlled features help traders tweak entry and exit criteria and see how these impact profitability.

Major props to the Odds Maker programmers: the program accomplishes a tremendous amount of number crunching very quickly. Once you find a pattern that is promising, you can then track it in real time in Trade-Ideas to see how it performs. The goal, of course, is to not just curve fit patterns to the past 15 days, but find ones that are robust with respect to upcoming periods. (By running reports each day, you can update performance and see if your setups are stable or degrading).

The question, for me, is how do you integrate the Odds Maker setups with a reading of order flow? What I've done is develop Odds Maker setups that test well for equity index ETFs, providing trades lasting 30 minutes in duration. (My next post on the Trader Performance page will describe the setups more specifically). Once the trade is alerted by Trade Ideas, I then go into "order flow monitoring" mode. If the setup fits with the order flow patterns that I'm seeing with Market Delta, I go with the trade idea. If not, I pass it up. Similarly, if order flow shifts during the 30 minute holding period, I'll bail. If not, I'll use the time stop.

What this accomplishes, hopefully, is a combination of one source of edge with another, independent one. By trading a tested setup and then only following the setup when current market conditions are favorable, it may be possible to raise one's win/loss ratio and overall profitability. This blending of system and discretionary trading is what I pursue with my historical studies. Now, with Odds Maker, we can see if intraday historical studies can inform our reading of order flow.

The setups go live next week; stay tuned!

Friday, September 08, 2006

Market Psychology AM Update for 9/8/06

9:54 AM CT - OK, hopefully you were able to see that selling dry up after a big program (sell) hit the market and drove the TICK down sharply. None of the 3 main markets (ES, NQ, ER2) were able to make new lows for the AM on the downmove and subsequent selling was well absorbed. That provided a nice short-term trade back to the top of the AM range, where we'll see if any demand comes into the market. I'm outta here for some research. Once again, thanks for the feedback; have a great weekend. Wrapup tonite on the Weblog.

9:31 AM CT - Notice the drying up of selling at 1306.5, the lifting of the big offer at 1307.5, and then the aggressive buying on the heels, once that level was taken out. And now it's back in the preopening range. Very much a locals' market. I do think that, if we hold above yesterday's lows, we'll eventually take out the pre-open highs, FWIW. Watch for a positive skew to the TICK to validate. Back in a while.

9:29 AM CT - Whoa, someone lifted a big offer at 1307.5.

9:20 AM CT - The same pattern below occurred at 1306.25, with a big bid absorbing selling. If we can hold above yesterday's lows, I'd expect to see some volume come in as we test the overnight highs. Just an idea for the back of the mind.

9:15 AM CT - Interesting patterns at 1307.75. Several times we had a large bidder just sitting on that bid, absorbing selling, willing to get hit. Very shortly after, the selling abated and the market bounced a few ticks higher. This last time, however, a big seller took out that bid and selling volume rushed in taking us down several ticks quickly to 1306.50. That 1307.75 now becomes resistance; it's the level that sellers were willing to lean on before and--if the demand/supply equation does not change--that level should hold as an upside ceiling. If we move above that level, back into the early AM trading range, you know we have a rangebound market and tepid follow through among sellers. So far, however, volume has picked up on selling.

9:07 AM CT - What happens in markets like these is that you have large locals working big orders above and below the market. So they'll buy 'em up and push the market into their offers and whip 'em down and push the market into their bids. Until paper comes into the market and runs them over. If they don't see signs of institutional participation, they just get bolder with the whipping of the index in a range. That creates the unusual pattern you sometimes see of the market sitting, sitting, sitting, and then running up a few ticks at a time (usually in my face!). I just took half a point profit on a short position and just got out until the market decides to show its hand (if it does at all). Unless you have rapid-fire order execution and a keen sense for where to work orders, playing very narrow, slow, range bound markets is a great way to get chopped up.

8:58 AM CT - So far, the locals are playing ping pong with the market in a tight range, but the distribution of the TICK is pretty positive, and the proportion of volume at bid vs offer in ES is relatively even. It continues to look like a range bound market. I am not impressed with the bulls ability to push the market above preopen levels so far, but we're not seeing much from sellers in terms of TICK either.

8:42 AM CT - Moderate volume; we opened with a bit of a bounce--advancing stocks are slightly ahead of decliners--but locals have leaned on the market since the open. So far looks like a local dominated market, which suggests a possible rangebound market. The new Market Delta shows actual bid and offer in the book, and if you're familiar with reading depth of market displays, you can see the games that the locals play. It's a very advanced topic, however, so if you're just getting used to reading volume patterns, I wouldn't put too much energy into reading the actual order book. Better to focus on what actually trades, where it trades, and the flow of volume from bid to offer.

8:25 AM CT - Two trading events from the Chicago Mercantile Exchange that you might want to note if you're around:

November 2nd - I'll be part of a three-person panel in Chicago at the CME presenting on the topic of peak trading performance. I'll post specific times on my personal site.

November 15/16 - This is the Futures Trading Summit in Las Vegas, with quite a roster of presenters. I'll be presenting the first day and hanging out at nite with whomever is interested in the psychology of the markets and the psychology of traders.

8:14 AM CT - Good morning! Some volatility has come into the market, and that's made for good trading. We've had two consecutive days in which a large proportion of stocks have shown strong downside momentum, as measured by the Weblog's Demand/Supply numbers. That has occurred 26 times since 2004. The normal pattern is to get some follow through weakness the next day, before a bounce on day two. Interestingly, though, during 2006, we've seen that bounce the next day on 4 of 6 occasions. We twice have bounced off the 1304-1305 level (Dec. contract ES), so that is our support. Yesterday's afternoon highs (see the previous post and my Trading Markets article) provide upside resistance (1312.50-1313.75). The overnight range has been more muted than in the past two days, and that might provide us with more of a rangebound trade today. The key will be tracking volume patterns as we approach the edges of the support-resistance range. Back after the open; check out that Trading Markets article if you need a jolt of music to keep you awake.

Breaking It Down: Analyzing Market Volume

Here's the "brick wall" chart I posted last night in the Trading Psychology Weblog. This is the new version of Market Delta; let's take a look at the information we can glean from the chart.

As the arrows indicate, once we hit new highs for the day above 1313 in the December ES, large volume came in at the bid. We can see this from the red shading of the bars in the 13:00 CT time period and also from the magnitude of the numbers. At three different price levels, we saw more than 3000 contracts hitting the market at its bid price.

Now let's think like a professional trader for a moment. If you think a market is stalling out and you might want to lighten your long position, you are not going to rob yourself of a tick and bail out at the market. Rather, you'll expect that the market will trade at the bid, then the offer, then the bid, rotating back and forth as it stalls out. You'll work an order in the book, offering some of your inventory for sale to see if residual buyers will do your work for you.

On the other hand, if you're in a rush to get out of the market and think we're going lower, you're not going to play games and work an order to get an extra tick. "Don't be a dick for a tick" is what you'll tell yourself and you'll take what the market gives you, unloading some of your holdings at the bid.

That's pretty much how a market maker thinks. Now there's another class of trading professional that is less concerned with the moment to moment flow of prices around the bid and ask. This is a longer-timeframe participant who trades with an opinion. A hedge fund trader, for example, might have research that tells him or her that the odds of the market breaking its low for the day over the coming three sessions are quite high. That trader will use the rally--and the market's enhanced liquidity during the rise--to get into a short position and ride the anticipated move. Given the expectations of a 10+ point move in ES, the longer timeframe trader isn't going to get cute and work orders for an extra tick. If the bids are there in the book to be had, they'll hit them and get the position established.

When we see 5000+ contracts trading at a level over multiple price levels, we know that this is above average volume for this time of day. The odds are great that both of these groups of professional market participants are active. The skewing of volume from the green to the red--from the willingness to take offers to the need to sell shares--tells us clearly that their sentiment has taken a sharp U turn. That's the brick wall I referred to in my post.

When you see a brick wall, you note the price level and say "Sayonara". There is just too much supply relative to demand to sustain that price level. Conversely, in later market action, if we *do* take out that price level, what better market indicator could you have that the demand/supply equation has changed?

Now let's go to a different portion of the chart. Along the left side, you'll see a volume histogram and numbers along the chart's Y axis. What that's telling us is the volume that has printed at that price cumulatively through the day. When the numbers are green, we can see that the majority of the volume at that price during that day was at the market's offering price. Red indicates that the volume was at the bid. The histogram is broken down into green and red so that we can see, not only total volume relative to neighboring prices, but also the distribution relative to bid and offer.

Notice what happens to the histogram as we move from 1309 to the market's high price. We're seeing less cumulative volume at higher prices. What that tells us is that the market has not facilitated trade north of 1309. High volume at any price level tells you that, over time, the marketplace is accepting that price as value. What we have with the brick wall pattern is a rejection of value at a given price range. The "tail" left by a Market Profile (not displayed here) is also a tell-tale: a sign that supply overwhelmed demand on that occasion.

We also, if you notice, rejected value at the lower end of the market's range. That was a brick wall in a different direction: supply overwhelmed by demand. The observant trader will note those price levels well to see which side of the range will facilitate trade in the coming session. That will provide the demand/supply shift cues that alert you to a market breakout.

Props, BTW, to Market Delta for the major upgrade. There are a lot of features to the new version I haven't yet toyed with, but the triple display of volume breakdown--within bars at bid/offer; vertically by time (displayed on the X-axis); and horizontally by price (displayed by the histogram on the Y-axis)--provides a great deal of information that is relevant to short-term traders.

Thursday, September 07, 2006

Market Psychology AM Update for 9/7/06

10:40 AM CT - Just a parting note. Take a look at the previous entry and notice how we made the low in ES around 9:50 AM, but did not make AM lows in the NQ or Russell (ER2). My hope is that you can take away from these updates at least one useful idea per day. The important idea here is to watch sectors and other indices: not just the one you're trading. A move to new highs or lows that displays poor participation (see my recent post) is less likely to continue in its direction than one that is confirmed across the board. Update on the Weblog tonite.

9:46 AM CT - Notice that, after the bounce, we're getting lows in ES but not so far in Russell. Keep an eye on such divergences. The best breakout moves don't have those kinds of divergence. I'll be working on the Odds Maker setups this AM and the new version of Market Delta. Hope to have more to report tomorrow. Have a good one.

9:30 AM CT - We're seeing an attempt to put in a short-term bottom around the 1295 (Sep) 1305 (Dec) level. A breakout to new highs in the TICK would support such an effort. I'll post further if I see major developments; otherwise it's back to the research. Have a great rest of the AM.

9:20 AM CT - It's the absence of buyers rather than the onslaught of sellers that is notable here. Right after my last entry, the TICK faltered at +200 and could not sustain further buying. The volume at the bid and distribution of the TICK are dominating, with decliners now leading advancers by over 1600 issues. Selling the bounces will continue to work as long as those bounces in the TICK are so anemic.

9:10 AM CT - Once again, you can see how the absence of strong buying finally got the bears testing those overnight lows and taking us to new AM lows. The TICK, so far, is more positively skewed than yesterday and some sectors are showing some buying interest here. Volume at the bid modestly outweighs volume at the offer, and the TICK is moderately negative. I'm alert for the possibility of a reversal this AM, especially if we see sectors unable to make AM lows even as the major averages make or test lows. That distribution of the TICK will tell us a lot. It's when those thrusts to negative TICK extremes no longer produce new price lows that you want to think long and hard before chasing lows.

9:00 AM CT - Volume is a bit tough to read here because only about 2/3 of volume has migrated over to Dec. But you can see from the muted range of the TICK that we have very modest volume and rangebound trade--a surprise, given the drop yesterday and overnight. I hope you were able to see what I referred to in my last entry re: the muted response of the bulls. Buying dried up as we tried to break 1299 on the Sep contract. 1310 is the equivalent Dec. level. So far, however, we're also not picking up meaningful volume to the downside; nor is the TICK going significantly negative. We'll keep probing the highs and lows of this muted range until one side gets some volume going. I like to watch the distribution of the TICK for clues as to possible breakouts. In general, however, I avoid this kind of slow, rangebound action. Russells still look heavy.

8:47 AM CT - Please note that I'm still quoting levels from the September ES contract, though a good deal of volume has migrated to the Dec contract. Russell's a bit weak here, and decliners outnumber advancers by over 1200 issues. Note the difficulty so far in breaking that resistance at 1299; and how that set us up for the downside test. Establishing those trading ranges and tracking attempts to test the edges of those will often set up good initial AM trades. We have a nice range mentioned below, and the edges should give us a clue if bulls can muster strength here. So far, their counter has been muted.

8:35 AM CT - I think all trading should be done with lasers and glow sticks. And 135 bpm. Anyway, recent pre-opening selling has held in that 1296.50 area and we see pre-opening resistance in the zone from 1299.25 - 1299.75. So let's see the bulls take their turn and try to break that resistance. That will set up an initial trade for the short-term folks--either to test overnight highs just above 1301 or to retest the lows and the 1294.50 lows from late August. Back to the lasers.

8:00 AM CT - Good morning. The music is blaring in my office (although it's hard to hear the singer from the audience; but, hey, what's a club for?!) and the market's trading, so what can be bad? Check out the Weblog if you haven't already; it notes the very broad downside momentum in yesterday's market. After such a broad momentum down day, returns 1-5 days out are subnormal. And that's what we're seeing so far this AM: a continuation of the short-term downtrend noted on the Weblog. Recall that volatility in the pre-opening market tends to correlate well with volatility during the day session, so we're once again setting up for some movement here. We're well below yesterday's average price, and the general rule during downtrends is to sell bounces that stay below that average. My leaning on mornings like this is to not chase weakness, but to wait for the buyers to take their turn and show what they've got. If we get another situation like yesterday where the buyers try to take the market up and large sellers hit bids in force, then it makes sense to ride the downtrend. My posts this AM will be limited; I'll be spending time with research and new software that, hopefully, will contribute to the blog over time. OK, back to the music; see you after the open.

Why Is It So Difficult to Change Time Frames?

When professional traders find that the patterns they've been trading no longer confer an edge in the marketplace, they try to make changes. Typically, they either try to change their time frame (go from shorter-term trading to a longer timeframe), change the patterns they look at, or change the markets they trade.

As I mentioned recently on my Trader Performance page, all such changes are difficult. That is because the changes entail unlearning old patterns--not just acquiring new ones.

In all my work with traders, I would say that the most difficult transition they've attempted is a transition from a short time frame to a longer one within the same trading instrument.

To trade a longer time frame means that you must let winners ride longer than you ordinarily would. It also means tolerating larger drawdowns and living with uncertainty longer. The instincts that help a scalper--getting out of losers quickly, for example--wreak havoc with efforts to trade longer time frames.

Once you have a "feel" for a market--which, really, is also a feel for a time frame--it is very difficult to unlearn that feel and develop a new one. The majority of traders, I find, do not navigate that change successfully. The rate of success is greater in applying the old time frame to a new instrument than in finding a new time frame in a familiar market.

Perhaps, however, there's another reason that it's so difficult to change time frames: Patterns that exist on an intraday time frame may be very different from those over longer periods.

Here's an example. As I mentioned recently in the Weblog and my market update yesterday, I've been playing with a trade setup in the Odds Maker program from Trade Ideas that involves buying pullbacks from upthrusts and selling bounces from downthrusts. The pattern tests out quite well on intraday data across a variety of stocks and markets. When I tested a similar pullback pattern over multiday periods, however, the buy setup actually yielded a negative edge!

Specifically, I went back to 2004 and looked at four-day periods in SPY that rose more than 1.5%. I then identified four-day periods that retraced a portion of that gain, but not all of it. Over the following four days, SPY did not resume its upthrust. Indeed, the average change over the next four days was -.30% (19 up, 19 down), weaker than the average four-day change over the 2004-2006 period.

Could it be that markets are more mean-reverting over short time frames than over longer periods? Might this help to explain why the transition from daytrading to swing trading is so difficult for many traders? As we extend the time frame, we go from markets in which locals are dominant to ones in which institutions determine the big moves.

Perhaps who dominates markets determines how markets move.

Changing from intraday to multiday trading might entail shifting from thinking like locals to thinking like institutions.

And that's very difficult for market makers.

Wednesday, September 06, 2006

Market Psychology AM Update for 9/6/06

11.10 AM CT - Per my initial update note, we are indeed testing the lows from late last week, where there's some good support. The continued volume at the bid and negative TICK have made the "sell the bounce" mode the way to go all AM--especially once we saw large volume beat down that rally attempt and cap the market in the 1308 region.

I've been working furiously with the Odds Maker program and am finally coming up with some signals that are working across multiple symbol lists and time periods. That suggests that the signals are robust and not just curve-fit artifacts. My experience, FWIW, is that you have to think like a market maker to come up with the good patterns. If you think like a trend follower or retail trader, you get randomness. The patterns I'm finding involve countertrend trading: buying dips under overall conditions of strength and selling bounces under conditions of weakness. Holding period is 30 min. I'll tweak and hopefully have something to share later this week. Have a great day.

9:58 AM CT - Sorry about the Blogger problems; my previous post below never got through. I'm retaining it nonetheless. The TICK continues its negative skew and volume picks up on the declines. The key, however, was seeing the large selling come in around that resistance point. That really put a lid on any possible early AM strength.

I'll be working with the Odds Maker program from Trade Ideas today, conducting some research. One nice feature of the program is that you can see it calculate the % winning trades as it scans the market. During the scan, sometimes the % will decline or rise quite a bit. That's telling you that the odds are changing as you test the pattern on the most recent data. That is very good information. I see Blogger is down again; I'll try to get this through. Have a great day; I'll post later if any major developments.

9:37 AM CT - Having Blogger problems; will update later. We're seeing persistent selling as we get into that 1308 region, and it's large selling--much of it executed by automated programs. This is keeping a lid on the market and, as long as we see a negative distribution to the TICK and more volume hitting bids than offers, we should stay below that resistance and look at bounces as selling opportunities. A move above the resistance would bring in quite a bit of buying/short covering.

9:23 AM CT - Yowza. Someone unloaded over 3000 contracts (sold at bid) around 1307.75-1308 at 9:20:35 - 9:20:47. That's not a small retail trader, folks. Someone is defending that resistance area with real size. The market absorbed it well, and that tells you something.

9:05 AM CT - One other thing: There's juicy resistance at 1308.75-1309. I want to see if the locals push that level to set off stops. If they can't pull that off, that would be a key sign that the bears have the upper hand.

9:00 AM CT - Volume picked up to the downside, and notice how different the distribution of the NYSE TICK is from recent sessions. What that tells us is that traders are tending to sell bounces, not buy dips. It doesn't mean we can't have short-covering rallies from here, but it does mean that market bounces in which buying dries up will make for candidates for selling. Volume remains moderate, but--reflecting the weak TICK--we're seeing more selling in the broad market than in the large caps. Notice, too, that the NAZ did not follow the other indices to lows on this most recent bout of selling. I'm cautious about selling into new lows when not all sectors are in gear.

8:45 AM CT - No question we have market weakness, with declining stocks outnumbering advances on the NYSE by over 1600 issues. I'm surprised volume has been stronger in the early going and will want to track that as the day goes on. We're less likely to get sustained (down) trending action if we see volume dry up in the AM. The NYSE TICK is clearly skewed to the sell side, and we're seeing more ES volume at the bid than offer, though not by a huge margin thus far. A few early attempts could not get the market below that 1307.50 area; I'm alert to the possibility that selling volume could dry up here and lead us to a bounce.

8:15 AM CT - Good morning. Looks like that loss of upside momentum tracked last night in the Weblog and mentioned in my last post is finally catching up to stocks. The immediate cause of the weakness is bonds. For the second straight day, we're seeing a selloff in U.S. fixed income, creating rising interest rates. This is taking a toll on the pre-opening S&P 500 Index, which is already below Tuesday's lows. Let's see how volume looks (magnitude and proportion at bid vs. offer) early in trade to see if we're likely to trade back into yesterday's range vs. test Friday's lows. My early hypothesis is that we put in a short-term high yesterday and should work off the recent overbought condition, eventually taking out Friday's lows. One last note: there is a decent correlation between the trading range of the overnight session and the trading range for that next day. If that holds, we should see a pickup of volume and volatility today. I'll post early after the open to see if that is indeed the case.
