Showing posts sorted by relevance for query market patterns. Sort by date Show all posts

Tuesday, May 04, 2010

Core Ideas in Trading Psychology: Identifying Historical Patterns in Markets


One of the core themes that runs through the TraderFeed blog is the importance of identifying historical trading patterns in the markets. I owe an appreciation of this theme to the influence of Victor Niederhoffer, whose blog and books have added greatly to the market literature.

The key idea is that, as a trader, you want to think about markets like a scientist. You make observations, you formulate theories about what is happening in markets, you express those theories as hypotheses, and you test those hypotheses with specific trades that you place. Over time, your trading experience either validates your market understanding or contradicts it, supporting or leading to modification of your basic theories.

We know that historical observations of market patterns can help generate successful mechanical trading systems. Less well appreciated is that those observations can generate hypotheses for discretionary traders. Knowing, for example, that in 17 of 20 recent occurrences where the market has made an X day low it has ended up Y% higher in the next X days does not, in itself, necessitate that you take that trade. It does, however, help you frame a trade idea if you perceive that we are in a correction within a bull market (your underlying theory).

Should the historical patterns hold, you might gain confidence in your assessment of the market's strength and trend. Should the pattern not hold, you now have concrete evidence that the market is not living up to its historical script. That could suggest that the market trend is turning: some unique factors may be at work in generating recent returns. As a scientist, you are benefiting from hypotheses that are disconfirmed as well as those that are confirmed: losing trades that were placed with a positive expectancy may be providing unique market information.

When traders identify multiple historical patterns that are independent but that point to the same anticipated market outcomes, that can provide an added measure of conviction to trades: those are strong hypotheses.

Among resources for identifying historical market patterns are the excellent Quantifiable Edges, Market Tells, Market Rewind, SentimenTrader, MarketSci, Vix and More, and CSS Analytics sites. If you check out the blogrolls for those sites, you'll see many more good resources.

If you have an interest in testing historical patterns, do investigate the resources at the excellent
Vertical Solutions site. And if you're a do-it-yourself type, the Trading Coach book has a chapter devoted to using Excel to identify historical market patterns.

For more on this theme, check out the posts on Trade Like a Scientist: Parts One, Two, and Three.
.

Friday, March 16, 2007

Learning How To React To Changing Markets


Back in the late 1990s, I decided to take trading very seriously. I began to archive market data in Excel, starting a collection of one-minute price and indicator data that I have maintained faithfully since 1998. I also printed out charts such as the one above, in which I viewed each major indicator vs. stock index price and identified patterns that occurred at important turning points. To this day, I have a stack of printed charts that fills quite a few filing cabinets.

When you notice a pattern and then notice it again, and again, and again in different variations, eventually you become sensitive to what is pattern and what is noise. The process is very similar to the training of a radiologist, who learns to read X-rays or scans by seeing very many normal and abnormal ones, or a pathologist, who--after seeing many normal and abnormal tissue samples--becomes very sensitive to what is disease and what is expectable variation in health.

Most important, seeing patterns again and again enables a trader to recognize those in real time as they are forming. As I stress in my book, I have found simulated trading--particularly simulators that enable you to play and replay market days--to be especially powerful as learning devices. Seeing patterns unfold again and again significantly reduces one's learning curve. Once you've seen a trading pattern unfold dozens and dozens of times, you develop a feel for its future unfolding. That's the process of implicit learning I've described in past posts.

And that is how you learn to react to changing markets: By experiencing many, many market changes.

Wednesday was a particularly valuable day for observing patterns, because so many of them occurred within the span of a single trading session. I have labeled the above chart with four letters to indicate some of the more noteworthy patterns:

Point A) Notice how, in the opening minutes of trade, the market is much more reactive to the drops in the NYSE TICK than to the bounces at the very start of the session. When we jumped to positive TICK readings, these were followed by immediate selling that took us back into negative TICK territory. By the time we saw buying at point A, even the strong TICK of +1000 couldn't vault us above the opening highs in the S&P index futures. I refer to this pattern as inefficiency: Quite simply, if we measure the amount of upward price movement we are getting per unit of NYSE TICK, it is quite low. It's like a runner who is huffing and puffing, but getting nowhere. Such inefficiency is common at market turning points: sentiment is no longer able to sustain a short-term trend. Before we see a surplus of selling, we'll see buying sentiment (positive TICK) that no longer can move price higher. I generally sell those inefficient TICK bounces, particularly when they're occurring near tops of ranges.

Point B) Commencing at point B, we see that we get a pattern of lower highs and lower lows in the NYSE TICK. That is the classic pattern of a short-term market decline. As long as that pattern holds, you keep selling the TICK bounces. The thrusts to negative TICK, especially on elevated volume, are opportunities for the active trader to take some short-term profits off the table, even as he or she might ride a core position toward a designated target (such as the pivots mentioned in the Weblog). Recall that the NYSE TICK is telling us the relative balance of stocks trading at their offer price (upticks) vs. bid price (downticks). When we see a distribution of TICK values that is tilting downward (lower highs, lower lows), it means that bearish sentiment is trending. Those are markets we can ride lower.

Market Low) The market low for the day occurred on a very negative thrust in the TICK. A pattern that doesn't show up on the above chart, but that I had mentioned in my blog post that day was that, while the ES contract was making new lows for the correction, other stock indices (such as NQ and ER2) were not. If a majority of issues are not participating in a move, there's an enhanced likelihood that the move will not be sustained. Notice, however, that someone *only* looking at intraday data (such as the above chart) would have missed this vital longer-timeframe pattern. The important point here is that patterns are generally nested within larger patterns, and it's those larger patterns that create trends. Even very active traders need to train themselves to see patterns present in daily and even weekly data. Someone with their nose in the one-minute data on Wednesday would have been completely run over at the market low if they were short, oblivious to why the market had suddenly turned.

Point C) Notice the shift that occurs following the market low. We quickly go from a downthrust toward -1000 TICK to an upthrust above +1000 TICK. This creates a breakout in TICK, revealing a sudden surge in bullish sentiment. Even more important, we're no longer seeing the inefficiency associated with Point A. Rather, price is quite responsive to the broad upticking among stocks. By the time you get another thrust down below -500 TICK, price is well off its lows. What that tells us is that, unlike early in the day, high TICK readings are being followed by further high TICK readings: the bullish sentiment is sustained from minute to minute. This tells us that longer time frame participants have identified the market lows as value and are jumping into the market, lifting offer, to take advantage of bargain prices. This transitional pattern--from TICK extreme to opposite TICK extreme, with price responsive--does not occur very often, but can be seen at major market turns and at times when the market is roiled by unexpected news and economic reports.

Point D) At Point D we have the pattern from Point B, but in reverse. Now we're seeing higher TICK highs and higher TICK lows. Bullish sentiment is now uptrending. That is a great indication that we can afford to ride long positions and even add to them on TICK pullbacks. In an uptrend, successive TICK lows will occur at higher price lows; in a downtrend, successive TICK highs will occur at lower price highs. By the time we hit Point D, bouts of selling can no longer move the market lower. They merely serve as further encouragement for the bargain hunters.

Seeing patterns on a chart is only the first step in learning how to react to changing markets. The chart review tells you what to look for. The hard part, then, is to make the transition from chart review after the fact to recognition of patterns in real time. That's a frustrating time in the learning process, as you'll first make progress by recognizing patterns a bit too late to truly profit from them. But it is better late than never. Eventually the patterns become such second nature that you can see them well in advance, just as I noted the emerging divergences minutes before the market low.

No amount of positive thinking or empty-headed glorification of "you are what you believe" can substitute for knowing what patterns to look for and then immersing yourself in those patterns so thoroughly that they become part of your perceptual apparatus. That is true whether you're a scalper noting patterns in a depth-of-market screen; an active trader trading off the one-minute NYSE TICK; or a swing trader playing off Woodie's CCI patterns: learning to react to changing markets means that you shift your perception before the market makes its shift.

Tuesday, February 06, 2007

Deepening Our Understanding of the Stock Market's Personality

When we refer to the "personality" of an individual, we're creating a shorthand that describes that person's tendencies: How they think, feel, behave, and relate to others. Our categories of personality--such as calling someone "Type A" or "narcissistic"--help us understand that person, predict their behaviors, and communicate our understanding to others. To be sure, personality traits don't capture all of the variance in human behavior; much is determined situationally. Still, human behavior is sufficiently patterned that we benefit from our various categories.

When we perform studies of historical market behavior--or when we create a mechanical trading system--we are attempting to capture some aspects of the stock market's personality. Each study or system is looking for a recurring pattern. We might say that the sum of patterns across multiple time frames defines the personality of a given market. Some markets have "trending" personalities; others are "volatile". With markets, as with people, such personalities don't capture all the variance in the behavior of a stock or index. Situational factors, from interest rate movements to geopolitical developments, play important roles. Still, we see sufficient patterning of markets that it is meaningful to say that, for example, we've been in a low volatility bull market.

When we deal with a person, we do not expect that his or her personality will radically shift from day to day. The tendencies that have stood out in the recent past are assumed to hold for the immediate future unless we have some reason to believe that the person has changed or that the situational influences are unique. Similarly, traders assume that past patterns will carry forward to the immediate future. This is just as true for discretionary traders as mechanical systems ones: whether we trade off of chart patterns or quantitative relationships, we are assuming that patterns we've noticed in the past will, in the absence of situational influences to the contrary, carry forward to the near-term future. Without that assumption--the assumption of some patterned nature to markets--trading makes no sense whatsoever.

We tend to think of discretionary trading--trading based on the real-time judgment of the trader--and mechanical trading--trading based on a defined system of entries, exits, and money management--as opposite sides of the trading spectrum. In reality, however, both are undertaking the same thing: capturing market patterns. It is for this reason that the development of trading systems greatly benefits from the expertise of traders who employ their judgment and discretionary traders benefit from the decision support of knowing quantitative market patterns. As I suggested in a post a while back, the ideal is a trader with both head and gut: someone who has a feel for market patterns and a head for market odds.

During my morning trading sessions, I have sometimes referred to the Odds Maker module of the Trade Ideas screening program as one bridge between discretionary and system trading. Indeed, today's Weblog entry mentions an Odds Maker pattern regarding downside breakouts of opening trading ranges. I am a discretionary trader, but I find it helpful to know that, during the past three weeks of trading, the great majority of downside breaks of the opening trading range have been reversed. Indeed, on balance, one would have made nice money buying such breaks rather than joining the sellers. Knowledge, indeed, is power.

What Odds Maker is doing is capturing a piece of recent market personality. A broader piece of market personality is captured by a trading system that has been tested over many years, such as the one recently mentioned in my post. Such patterns and systems won't account for all market behavior--their absolute edge might be relatively small--but followed consistently over time, they can yield major profits. The bullish trader who has bought market weakness has consistently outperformed the bullish trader who has bought strength: knowing the market's short-term personality has been crucial to the success of the active trader.

The bottom line? Two important implications:

1) Quantitative assessment can aid subjective judgment. The psychologist relies on psychological tests; the fighter pilot relies on radar readings; the poker champion knows the odds of each hand. Knowing patterns--whether of clients in therapy, opposing football teams, or markets--helps professionals make better decisions.

2) The expertise of subjective decision makers can aid the development of quantitative tools. I have seen many programmers at trading firms who have programming expertise and no feel whatsoever for *what* to program. It's when the expert trader shares patterns with the programmer that a superior trading system can be developed--the kind of system that, then, can offer the aforementioned decision support.

Can discretionary traders form partnerships with quantitative system developers for their mutual benefit? My next post will propose a vision for just such an arrangement.

Sunday, December 22, 2019

Trading the Psychology of the Market

In the recent Forbes post, I discuss the importance of setting goals for the New Year that are truly effective, by engaging our motivation and providing us with an inspiring vision for our future.  Dry, laundry list goals may capture worthwhile "to-do's", but we rarely end up actually doing them, because they don't give us energy.  Ineffective goals are energy takers; effective goals inspire, drawing upon energy we never realized we had.

So here's one potentially effective goal for 2020:  Trading the psychology of the market and not your own psychology.

Many trading decisions are colored by the fear of loss, the need to make money, the impulse to be involved in each move, etc.  Those decisions are suboptimal because we're actually trading our psychology and not the psychology of market participants.

Above is a chart of the recent ES futures market.  In this post, we'll take a look at what's happening in terms of market psychology.

First, you might want to check out previous, related posts:

Getting Past Trading Illusions - This is what kicked all this off, with my going undercover and seeing what "trading education" sites were actually teaching.  Yikes.

Understanding the Psychology of the Market - How what we think of as "choppy" markets may display meaningful cyclical patterns.

Tracking the Psychology of the Market - How patterns of upticks and downticks across market sectors deepens our view of buyers and sellers.

The Importance of Context in Trading - How viewing the current market relative to longer time frames helps us see who is in control of price action.

What is Really Important in the Market - An actual example of recent market behavior and what it was telling us.

Learning to Trade:  Building Market Understanding - How we can integrate price, volume, and time into coherent views of the market.

Learning to Trade:  Understanding Cycles and Market Context - How we can integrate our views of the market over new and different scales to generate meaningful trading views.

Learning to Trade:  Tracking Market Cycles Using Breadth, Strength, and Momentum - How we can look at waxing and waning patterns of buying and selling to track market trends and cycles.

Learning to Trade:  Going From Market Analysis to Synthesizing Trade Ideas - A real time practical example of using market information to inform a trading view

All of these posts are relevant to understanding and trading the psychology that moves the marketplace.

Above we see the recent ES market with volume-based bars in the top panel; volume transacted at the market offer versus bid price in the bottom panel.  The left hand graphic captures the amount of volume transacted at each price, similar to Market Profile.  The price action represents the period of time from December 16th through the 20th. (Chart is from Sierra Chart).

Note how much of the price action occurs in a narrow range, from Monday morning (12/16) through Thursday morning (12/19).  If we look at price behavior alone, the market seems narrow and choppy.  More than one trader told me that "This market isn't tradeable!"  And, yes, if you impose your time frame and trading preferences on the market, opportunity may not be there.  But what if your job is not to trade your favorite time frames, but adapt to how the market is actually behaving?

Once we integrate the information from the bottom panel, we can see that there is net selling pressure throughout this narrow period.  The red bars (volume transacted at the bid) exceed the green ones (volume transacted at the offer) over that period.  Despite the selling pressure dominating, price is not moving meaningfully lower.  Sellers are there in the market, but can't get anything done.  These are the participants who are potentially trapped when buyers finally step in (blue arrows).  Moreover, when sellers take their turn after the upside break (yellow arrows), note that they cannot retrace much of the upside move at all.  Again the sellers can't get it done and will be trapped for the next round of buying (pink arrows).

Folks, this is a tradeable market, but not if you only look at price action, not if you don't see the auction process between sellers and buyers, and not if you are wedded to particular time frames.  These patterns of market psychology occur at multiple scales and require an openness to trading the patterns that actually set up.  Trading your psychology and not the market's will not be helped by doubling down on your self-focus with self-help techniques.  One of the best things we can do for our trading psychology is immerse ourselves in the market's psychology.

.

Tuesday, October 09, 2007

How Do You Know You Have A Trading Edge?

Once again, the comments to recent posts have been most enlightening. The topic for the present post came from a penetrating set of questions asked by NQ Trader in response to my "Wonderland" post.

NQ Trader was asking an epistemological question: a question about the state of our knowledge as traders. We often hear of trading edges, but how do we *know* we have an edge when we trade? How do we know that results aren't merely the result of chance?

It seems to me that there are two answers to that question:

1) Defining Edge in Terms of Backtesting - One tradition examines trading patterns over a historical period that includes a variety of market conditions (bull swings, bear swings, high volatility, low volatility) and determines whether the distribution of price changes following these patterns displays a positive expectancy (i.e., a non-random directional bias). Such an approach is most commonly seen in the development and testing of mechanical trading system with such software as TradeStation. The definition of edge is thus historically based. True, the future may not mirror the past, and care must be taken to not curve-fit historical tests. Still, the backtesting of patterns over market history has led to significant profits for a variety of quantitative funds.

2) Defining Edge in Terms of Trading Outcomes - Defining the edge of a discretionary trader is a somewhat trickier matter. The discretionary trader, by definition, is not relying upon fixed signals for trading decisions. Instead, he or she is reading market patterns from experience and acting accordingly. The edge of the successful discretionary trader is something akin to the edge of a highly successful athlete: it may be felt, but it is ultimately known only in retrospect. When we analyze a discretionary trader's results, we can see if the trader differs from chance in terms of the proportion of winning trades, the earning of profits, etc. For a trader who makes, say, 1000 trades, we can even conduct simulations and determine the probability that a random series of 1000 trades would achieve or exceed that trader's results. Indeed, by treating the discretionary trader as if he or she was a trading system, we can analyze results and identify an edge.

Speaking solely for myself and my own trading, I occupy a space somewhat between these two definitions of edge. I investigate historical patterns in the markets and factor those into my decision making. Ultimately, however, this factoring is discretionary and my decisions to enter and exit trades are made on a discretionary basis as unfolding market conditions dictate.

Let's take an example from the current market:

I tend to seek patterns with an edge by asking myself: "What is distinctive about the market's recent behavior?" I then test to see how the market has behaved over the past several years when that distinctive element has been present.

On Monday, for example, we made an inside day. I went back to 2004 in the S&P 500 Index (SPY) and found 119 occasions (out of 945 trading days) of inside days.

The day after the inside day, SPY averaged a loss of -.09% (51 up, 68 down). That's notably weaker than the average one-day gain of .06% (470 up, 356 down) for the remainder of the sample.

What happens, however, when the inside day follows a strong up day (as is the recent case)? It turns out that there have been 31 occasions since 2004 in which an inside day has followed a daily rise in SPY of over .50%. The next day, SPY has averaged a loss of -.26%, with only 7 occasions up and 24 down. That is quite a negative skew (which can be formally established with the use of statistical tests).

When I find patterns such as this--particularly multiple patterns pointing in the same direction--that provides a framework for thinking about the next day's trade. I then wait for the market open and see how the market is trading relative to value, how traders are hitting bids and lifting offers, etc. If I see signs of early weakness--buying that cannot, say, move the market above its overnight highs--I will act upon the historical pattern and try to profit from the edge.

Do I *know* I have an edge with such a trade? I may feel confident in my reading of the current day's trading patterns, and I may feel confident in the historical pattern I'm leaning on. Ultimately, however, the arbiter of whether or not I possess an edge lies in my trading results. What is the likelihood that those results could have been obtained randomly? That, it seems to me, is the gold standard.

If my results are consistent with those achievable by chance, then either I'm trading methods and patterns without an edge or my execution is erasing the edge contained within my methods and patterns.

In other words, we either have a logical problem (no edge to our methods) or a psychological one (inability to capitalize on an existing edge).

In the end, edge boils down to non-randomness, whether we're testing historical patterns or present market performance--and whether we're testing mechanical systems or discretionary traders.

RELATED POST:

Historical Patterns as a Heads Up in Trading
.

Sunday, April 16, 2023

How to Assess the Personality of the Stock Market

 
Unsuccessful traders look for markets to trade in a style that fits *their* personality.  They look for momentum or trend or reversals of "overbought" or "oversold" moves.  By imposing their biases on markets, they become inflexible and unable to adapt when the market's personality changes.  

Lately, we've seen the stock market's personality shift literally from day to day, as range-bound action has alternated with strong directional moves.  Traders who expect the market to follow themes related to macro and fundamental developments (shifts in inflation, interest rates, economic data, earnings, etc.) have found this rapid shifting of market action to be challenging.  Many traders look for consistency from day to day--thematic continuity--when the market is behaving more like a market of stocks than a unified stock market.  Consider:  over 70% of consumer discretionary stocks (XLY) and energy shares (XLE) closed over their respective five-day moving averages on Friday, but that was true for only a bit over 30% of consumer staples stocks (XLP) and only 20% of real-estate shares (XLRE).

The opposite of a trending stock market is not a choppy market.  The opposite of a trending market is a rotational market.  Many times, the market will indeed follow themes, but the themes play themselves out in relative terms.  Perhaps growth stocks are outperforming defensive sectors; perhaps small caps are outperforming large cap stocks.  The patterns of what is strong and what is weak define the themes for a given market session.  

Part of the challenge of short-term trading is that we cannot blindly assume that yesterday's patterns of strength and weakness will play themselves out today.  Rather, we have to first sit back and observe the various components of the market and how they're behaving to identify today's market personality.  This is key to trading psychology:  an active trader (as opposed to an investor) does not attempt to predict market action based on top-down criteria.  The active trader waits to see the bottom-up activity that reveals the patterns of trading here and now.

Several tools are helpful in assessing the market's personality from day to day:

1)  Volume (and especially relative volume) - How does the volume at a give time of day today compare to yesterday's volume at that time of day and the usual volume at that time of day?  If volume expands meaningfully, we want to see how stocks are behaving with the new market participation.  This will tell us who is participating and whether that participation is showing up in trending behavior or in the relative strength of one market segment vs. another.  Conversely, when volume dries up, we want to see how different parts of the market are impacted by the lack of participation.  What moves directionally in a quiet market tells us an important story.

2)  NYSE TICK - How many stocks are trading on upticks vs. downticks as we move forward in the session and--most crucially--how is the upticking or downticking impacting the price of various segments of the market?  We recently had a range-bound day in the morning that displayed strong selling pressure with negative TICK numbers.  Many parts of the market failed to make new lows on this selling.  The absorption of the selling pressure alerted the savvy trader that sellers would be trapped and, sure enough, their covering helped create a trending move during the day.  Very often, new extremes in the TICK numbers alert us to strong buying or selling interest--and how that interest moves the market (and different parts of the market) tells an important story.

3)  Short-term overbought/oversold readings - I use the adaptive moving average system from John Ehlers, which shows how shorter-term moving averages cross below and above longer-term ones.  The adaptive part is that the readings for short-term and longer-term change depending upon the cyclical character of the market.  As Ehlers has pointed out, this helps remove whipsaws from the indicator.  Basically I want to see short-term oversold levels occurring at successively higher price lows or short-term overbought levels occurring at successively lower price highs.  When sector ETFs show different patterns of overbought and oversold, that highlights a rotational market.  In a strongly trending market, the cyclical quality of the price action will break down and we will get prolonged overbought or oversold readings across multiple market sectors.

An important edge comes from being quicker than other participants to see how the market's character is playing itself out--and how it might be changing over time.  Many traders underperform because they fail to see relative themes playing out in real time.  If your trading is habitually bullish or bearish, you know that you're not doing a good job of assessing and following the personality of the market.

Further Reading:

Adapting to Changing Markets

.   

Wednesday, May 05, 2010

Core Ideas in Trading Psychology: Reading Market Psychology With Volume and Price


An important theme throughout the TraderFeed blog is that reading the psychology of markets is a core trading skill. Markets, like people, behave in patterns. Those patterns shift over time, with shifts accompanied by markers that accompany changes in state: changes in direction and changes in volatility.

The first important state marker to be able to read is volume. Volume tells us *who* is in the marketplace. Volume also correlates highly with volatility. When volume jumps, it tells us that institutional participants have become more active. When volume dries up, it tells us that the market is dominated by market makers: the liquidity providers. Is a news item or price movement to a new level significant? Volume will typically provide us with an answer: events are significant if they can attract the participation of large traders. It is their revaluation of assets that creates market trends.

What is most important about volume is relative volume: the degree to which current volume diverges from recent volume. If we want to know if the volume from 11 AM to 12 Noon is high or low, we should compare it to the median volume posted during that hour. If we want to know if today's volume is high or low, we should compare it to the most recent median volume. Because relative volume is so closely connected to volatility, reading volume and its shifts provides important clues as to how far markets can go for or against us. That is useful information in setting stop loss points and profit targets.

Equally important, the astute trader wants to see the total volume that transacts at each price over the course of a trading day or week. The range at which the lion's share of volume has transacted defines a market's value area. Many trade ideas--at short and longer time frames--can be formulated by handicapping the odds that a market will return to a value area (if higher or lower prices cannot attract volume) or that a market will accept prices higher or lower than value (if those prices attract volume). The former situation defines a range market in equilibrium; the latter defines a trending market. In the former market, traders make money by fading strength and weakness; in the latter, they make money by going with market direction.

It is the oscillation of price between range and trending modes across a variety of time frames that defines the market's complexity, as market participants reveal their sentiment: either accepting value or redefining it.

The astute trader can also read the psychology of markets by seeing whether volume is dominantly transacted at the market's bid price (suggesting that sellers are willing to take lower prices to get out of their trades) or at the market's offer (suggesting that buyers are willing to pay up for higher prices to get into trades). This measure of sentiment, which is effectively gauged by the Market Delta tools, can be tracked over time to see if buyers or sellers are becoming more or less aggressive.

We can also track market sentiment to see if more transactions across the broad stock market universe are occurring on upticks vs. downticks. When buyers are more aggressive, we will see more transactions occurring on upticks; when sellers are more aggressive, we will see more transactions occurring on downticks. This measure of sentiment, captured in the NYSE TICK, can be tracked over time to reveal whether sentiment in the market is waxing or waning.

When we read these shifts in sentiment over time and combine them with a reading of shifts in relative volume, we can determine whether the largest market participants are becoming more or less bullish. That will tell us if volatility (volume) is expanding with direction (sentiment) and whether moves to new price levels are likely to result in market trends.

Much of the skill of reading these shifts is placing market dynamics at a shorter time frame within the context of the longer time frame. What is a trending market at the short time frame may be a movement within a range at the longer time frame. A breakout at the short time frame may be trend continuation at the longer time frame. Context rules. A great deal of developing a feel for markets is a recognition of the patterns that occur as market participation (volume) and market sentiment (direction) shift, with longer time frames exercising impact over shorter ones.

.

Monday, May 03, 2010

Core Ideas in Trading Psychology: Market Structure and Adapting to Market Change


A key idea running through the TraderFeed blog as well as my books on trading psychology is that markets play out the same patterns as people: they exhibit particular states, provide markers for when they are shifting those states, and change their behavior when transitioning to new states. (See The Psychology of Trading for a detailed presentation of states and state shifts).

The states exhibited by markets are range modes (periods in which value is established in a relatively narrow band of prices and price does not move far from this value area) and trending modes (periods in which value is established at successively higher or lower price levels until fresh supply or demand from longer time frame participants enters the market and creates a range equilibrium). Every market state can be described as a joint function of directional tendency and volatility. Thus we can have volatile and non-volatile range markets, and we can have volatile and non-volatile trending markets.

Because markets change states at multiple time frames, the time series of price changes in markets is non-stationary. That means that the mean price change (direction) and standard deviation of price changes (volatility) in one period can vary significantly from those in the next period. If we think of price movement as generated by a process, then non-stationarity means that there is not a single, unchanging process generating all price changes. Markets, like people, display "multiple personalities": they behave differently when occupying different states.

Many of the market patterns described by technical analysts, including breakouts, double tops and bottoms, etc., represent transitions from one state to another. Some of the best profit opportunities occur in markets when traders behave like psychologists: reading patterns and transitions and timing actions accordingly.

A major reason that traders do not succeed is that they fail to read market structure--the states that markets are in--and thus are not sensitive to the shifts in structure that mark transitions between trending and non-trending modes. This leaves traders placing stop loss points and profit targets at levels that do not reflect the market's most recent levels of directionality and volatility.

Skilled, experienced traders learn to sense shifts in market states and thus recognize when trends are slowing down and turning into periods of consolidation; when range markets are heating up and ready to break out. When new participants enter the market and influence the pace of state change, as in the case of algorithmic trading occurring at short time frames, this can disrupt the implicit learning and pattern recognition of even those skilled traders, necessitating new periods of observation and internalization of patterns.

Failure to restrain risk during such periods of structural change in markets is a major reason why traders who made money consistently during one market epoch fail to sustain success during later periods. The challenge of trading is not only to learn market patterns, but also to adapt to new patterns as the drivers of price change (the themes dominating markets, the participants active in markets) shift over time.

For more on the topic of market structure, see the posts (including links) on Strategies and Tactics in Trading, Calculating Price Targets, and Three Basic Trade Setups.
.

Sunday, April 06, 2008

What Are You Doing Between Trades?

I want to thank readers for excellent comments and perspectives on my recent post that addressed the question of why trading is so difficult. In particular, I thought that Charles and Ziad identified a most important issue: the trader's engagement with markets *between* trades.

To take a step back, if I were asked the question, "What makes trading so difficult?", my response would echo Victor Niederhoffer: "Trading is difficult because of the ever-changing nature of market patterns".

In statistical terms, this is called nonstationarity; in my previous writings I described it as playing blackjack when the number of decks in the "shoe" periodically changes. You the card counter are keeping track of the number of picture cards dealt, not knowing that the supply of picture cards has just increased multi-fold.

Similarly, from one time period to the next, market patterns can change: we can see altered patterns of trending and altered patterns of volatility. This occurs within the day--the market's behavior is different in morning than midday--and across days, weeks, months, and years. (We currently are experiencing far more volatility than a couple of years ago).

A nice example of Niederhoffer's "ever-changing cycles" is the recent shift in one-sided days that I wrote about. When we get such shifts, traders who internalized the previous patterns (and, in this case, fade opening strength or weakness) become caught in the new patterns and lose money. This is a major cause of frustration in trading, and it is a major reason that successful traders can rather quickly become unsuccessful ones.

It is because of these changing cycles that traders need to stay actively engaged with markets *between* trades. At any time, trends can reverse, breakouts can occur, markets can become quiet, etc. Only by following the market's emerging patterns can traders hope to adapt to them and eventually profit. Charles provided an excellent example in his comment to the post: because he is actively figuring out what the market is doing, he avoids what I called the "fireman" syndrome among traders, in which periods of boredom oscillate with periods of intense emotion and action.

Ziad makes the valuable point that one does not need to approach the markets quantitatively to stay actively engaged. In my own trading, for example, I stay engaged by watching unfolding sentiment (NYSE TICK, Market Delta), seeing how price and volume behave at the edges of market ranges, and by seeing how markets correlated to my own are behaving. The time between trades is never boring, because my interest is captured by reading the emerging market patterns.

Herein lies the problem beneath the fireman syndrome: If the trader is more interested in trading than in understanding markets, the period between trades will not be productive. That period will either be boring (which will incite overtrading), or it will be dominated by negative thinking about recent performance (which will color future decision making).

This is why structuring one's time between trades with processes to examine markets--and to examine oneself, when needed--is very helpful for trading. The mind, like nature, abhors a vacuum. If we aren't prepared with constructive activities between trades, the mind will latch onto non-constructive ones.

I strongly suspect that a reliable way to identify a good trader is to observe what he or she is doing *between* trades.
.

Wednesday, September 20, 2006

The Structure of Market Reversals: What We Can Learn From Yesterday's Market


Yesterday's reversal in the ES market had an almost aesthetic beauty: it so nicely captured the dynamics of market reversals.

What I'd like to propose is that important turns in the market possess a common structure. Once you understand that structure, it's easier to recognize its formation in real time and profit from those reversals.

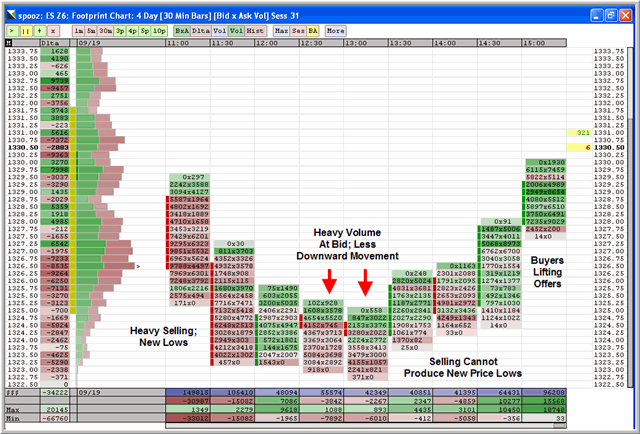
The chart above was the Market Delta screen I tracked in the afternoon. The first phase of the turnaround is heavy volume at the bid, leading to sharply lower prices. This means that sellers are eager to exit the market--they're not even willing to work orders at the offer to get out--and they outnumber buyers (those willing to take the offer price). Remember that the volume at bid vs. offer is telling us about the very short-term sentiment of market participants. The first phase in the market move above is negative sentiment and downward price movement.

In the second phase, the negative sentiment continues--we still get a preponderance of volume at the market bid--but now there is less downward price movement per unit of downside volume. I used the term "efficiency" in my Psychology of Trading book to describe this relationship between market inputs (volume, for instance) and outputs (price change). The market is becoming less efficient. It is not moving as far in price terms per unit volume as it did earlier. Very often the market makes its ultimate price lows at this phase. Divergences with the NYSE TICK and among sectors are often apparent.

This drop in efficiency precedes major market turnarounds. It can be quantified. Very often, the efficient and inefficient phases are separated by a significant bout of counter-trend activity. We see this in the chart during the 12:00 bar. Buyers took the market higher, with much more lifting of offers than we had seen in prior bars. This tells us that a group of market participants are perceiving value at the new, lower prices.

The third phase is accompanied by significant cross-currents of buying and selling, with the market ultimately unable to print new price lows. During this phase, we typically see many divergences and a positive shift of the distribution of the NYSE TICK. This tells us that, across the universe of NYSE issues, an increased number of stocks are being purchased at their offer price. From the first through third phases, it's not uncommon to see a decline in market volume as selling dries up.

The final phase of the turnaround occurs when selling is exhausted and buyers are emboldened, pushing prices higher on increased volume. Much more volume is transacted at the offer price and now the market gains efficiency to the upside. This upside efficiency will continue until the rise, like the prior decline, faces serious countertrend resistance and begins its own second phase of less efficient, higher prices.

One of the great challenges of trading is recognizing this basic structure across multiple time frames. Note how we made a bottom from July, 2002 to October, 2002 to March, 2003. You'll see a similar process. The recent market bottom in June and July also possessed a similar structure. The longer it takes for the market to go through its phases, the more extended the move in the opposite direction. This, too, can be quantified.

Many of the classic chart patterns (double tops/bottoms, head and shoulders, etc.) are simply price-based depictions of what is occurring in the market auction over time, capturing the movement from phase to phase in market transitions. Pattern recognition is a function of multiple exposure to different varieties of patterns: that's how radiologists learn to read X-rays, for instance. Once you become sensitive to the shifts between efficiency and inefficiency, you'll be able to see patterns set up in real time. I will try to highlight some of these patterns in the Weblog and in my updates.

And that, as in yesterday's trade, can make the difference between profiting from turnarounds and getting run over by them.

Thursday, July 14, 2022

The Key to a Successful Trading Psychology

 
In recent posts, I have shared my framework for thinking about trading and trading psychology.  I've also explained a few core concepts central to this approach, including how active traders can diversify their risk-taking; how to deal with stress in trading; and why volume is key to understanding trading opportunity.  In this post, I will explain the single most important psychological factor in active trading and why it is crucial to performance:  open-mindedness.

Pattern recognition is the core cognitive skill involved in active trading.  One mistake many beginning traders make is that they equate patterns in markets with chart patterns.  For the rational, evidence-based trader, patterns are only meaningful if they have explanatory value.  

When trading short time frames, the patterns in markets that are meaningful are ones that track actual supply and demand among market participants.  From the sequencing of trades in a market, we can observe increasing or decreasing volume and whether the volume has a directional bias.  Across many trades, we can detect trends and cycles.  When there is relatively stable participation in markets, we can expect the patterns of trending and cycling that we've observed in the recent past to continue in the immediate future.  That sets up potential opportunity.

One of the challenges of financial markets is their complexity.  Patterns show up across differing time frames, with trends and cycles nested within one another.  Thus, at one time frame, we may observe a trend, but at a longer time frame we can see that this trend is simply a directional move within a larger cycle.  A true understanding of market patterns requires the ability to place price behavior in proper context.  Successful pattern recognition is not merely seeing a trend or cycle on one time frame; it is the understanding of price behavior across multiple time frames.

In practice, that means our tracking of markets needs to be dynamic, not static.  We need to be tracking what is happening across shorter, medium, and longer time frames in order to detect the opportunity in their alignment.  Meaningful market patterns do not "set up" at any single period, but rather derive their meaning in how they are nested within one another.  I recently noticed the ES market cycling on a higher time frame (using charts where each bar represents 20,000 contracts traded) and making a clear higher oversold low on a shorter time frame (each bar was 5000 contracts traded).  That led to a profitable trade buying the oversold low and holding until we tested the high of the longer-term range.

At other times, those kinds of patterns will set up in the nesting of much longer time frames and even shorter ones.  Only if I am dynamically scanning the market across multiple time horizons can I begin to detect how the longer-term and shorter-term movement are meaningfully related.  During that dynamic scanning, I am not looking for trades and I am not at all focused on what I think the market will do or should do.  Rather, I am watching across the time horizons with a completely open mind, much as I (as a psychologist) might start a first meeting with person by listening, listening, listening.  Eventually, if I observe and listen long enough, a pattern--something meaningful--will jump out at me.

This is why maintaining an open mind is the key to a successful trading psychology.  Great trade ideas can't come to us if we are not open to them.  Pattern recognition, whether in a therapy office or in trading, means that we see relationships unfold.  This is why intuition is central to successful active trading.  The goal is not to have an optimistic mindset or a mindset filled with "conviction".  The goal is to be have a quiet and open mind, dynamically observing the interplay of markets and time frames.

The truly great trades are the ones that come to us.

Further Reading:


.

Monday, June 29, 2026

Key Insights From The Latest Market Wizards

 
7/6/2026 - The epilogue to the most recent Market Wizards book explains that "Two critical factors limit the possibility of becoming a Market Wizard:  1) Not everyone possesses an ineffable talent and the emotional composition that would make this goal possible, just as not everyone has the innate genes and skill to be a world-class athlete; 2) Achieving extraordinary performance in the markets requires tremendous dedication, passion, hard work, and forgoing other interests and endeavors--a sacrifice that most people are not willing to make" (p. 318).

It's easy to see how the shortcuts developing traders often take to achieve success--watching videos and following the social media postings of gurus--just don't work.  It is only when we draw upon our "ineffable talent" that we develop the drive to hone our skills and become the best we can be.  Then, the hard work is not a sacrifice--it's fulfilling.

I'm working with someone currently who is working on a large research project to track swing patterns in the stock market.  The goal is to automate this research so that there is a constant flow of signals across multiple patterns and stocks.  The quant signals thus act as an analyst, informing when and where there is opportunity, when to step aside, etc.  The trader follows the best historical signals by looking at the charts of past successful trades and developing criteria for entering, exiting, etc.  Market history thus becomes his mentor.

What's the "ineffable talent" in this case?  It's the love of learning.  It's the joy of discovery.  When our process draws upon what truly speaks to us, the hard work becomes absorbing play and we can achieve amazing results.  That's the lesson of market wizardry.

====================      

7/5/2026 - Jason Berry's interview in the latest Market Wizard book contains a number of insights.  He mentions that he trains traders to "find triple-F trades: fantastic fill feeling.  These are trades where the market instantly goes in your direction" (p. 238).  He points out that he trades by following a trend "on different short-term time intervals, using 1-, 2-, and 5-minute bars.  By breaking down market activity into multiple short-term intervals, he is able to see quickly when trades are likely to go his way and when they are failing.  This allows for unusually good risk management.  If the trade doesn't work right away, it's not an A+ trade.

Berry also offers a unique perspective on trend behavior.  Markets don't trade the same at every hour of the day.  There are certain time periods for each market each day in which trends are most likely to continue.  "I trade each market during specific times every day.  I know how the markets move during those times.  I don't trade during the times of day when a market typically experiences choppy bars" (p. 238).  

Berry's trading is anything but mechanical.  He explains that "Innovation is one of my secrets to longevity in the markets.  My best trades often result from thorough research, where the findings are so compelling that they lead to trades with a high probability of success" (p. 241).  He reviews his trades each day and then again at month's end to refine his process.  

George Coyle, reflecting on Berry's interview, observes that the "gut feel" from repeated market study and experience allows Berry to quickly recognize when a market is behaving normally and when it isn't (p. 252).  Jack Schwager explains that Berry's ability to sustain "a trainee mindset" (p. 254), continually learning from changing market patterns, is essential to his success.

The idea that markets trade differently at different times of day and that certain times offer particular opportunity is, in my view, a game changer.  Success results from trading only when the odds are in your favor...not so unlike poker.

==================

7/3/2026 - Lukas Frohlich, interviewed in the most recent Market Wizard book, asserts that "If you don't have the willpower to fight through the pain, you shouldn't be a trader" (p. 164).  He observes that "The trading landscape is constantly changing, especially when moving between different liquidity brackets.  My job is simply to find the opportunities with the best expected value" (p. 166).  George Coyle, reflecting on Frohlich, points out that "It is unusual to find traders who can switch trading styles successfully, especially when the styles are radically different" (p. 167).  Jack Schwager, noting Frohlich's flexibility, observes "To succeed as a trader, you not only need strategies with an edge, but also the ability to use the right strategies in the right environment" (p. 169).

The clear implication is that even the best traders need to "have the willpower to fight through the pain", because there will always be pain (i.e., drawdown) when regimes change and what had been working no longer succeeds.  Psychologically, what is outstanding about Frohlich is that, not only does he not wilt under the pain of drawdown, he draws upon it to feed his creativity and trade with a radically different style.  Drawdown, for the trader who follows rules well, is a sign that the market has changed.  This requires rapid adaptation.

Great traders, like great companies, are adaptive.  They make and remake themselves to fit the new demands of the environment.  For the excellent rule follower, drawdown signals the end of one opportunity set and triggers the search for new ones.  Instead of viewing the drawdown as failure, the great trader responds to it as a call for creativity and adaptation.

===================  

7/2/2026 - In his interview in the new Market Wizards book, Kenny Sharkness observes that "Another pattern I've noticed is that many successful traders are former gamers, and they look at the market and speculation as a game.  They're more focused on winning the game than the money that results from winning" (p. 284).  In my research regarding success at hedge funds, this theme also came up.  Interestingly, the games that were most popular with active/day traders were different from those that appealed to portfolio managers with longer holding periods.  The active group loved video games, for example.  The money managers loved slower games of strategy such as chess and poker.

There's an important insight here.  Whatever will fuel your trading success will draw upon something you already do and have a passion for.  Yes, we learn unique skills as traders, but ultimately we channel our talents and interests to create our success.  One of the greatest challenges of trading psychology is to identify what we do well, how we do it well, and how we can draw upon those strengths to fuel our development as traders.

Sharkness also offers something revealing when he was asked what he would do if he were starting out today.  He responded, "I would try to get a seat somewhere with exceptional traders so that they could instill in me a sense of what is possible.  Seeing others achieve greatness inspires people to strive for the same level of excellence" (p. 286).  It is not just talent and skill that make for great traders; it's also a vision "of what is possible".  This is one of the great shortcomings of traditional mentoring and coaching in trading:  It focuses on correcting weaknesses, but rarely offers models of elite success.  A continual emphasis on problems cannot create a visionary mind frame of success.

====================

7/1/2026 - Lance Breitstein, in his interview in the latest Market Wizards text, makes a very interesting point regarding edges in trading.  He points out that "Most patterns are indeed noise, but when you align enough nuances, there are very specific moments in time that provide tremendous positive expected value" (p. 46).  And how did Breitstein identify these specific moments of opportunity, particularly after 11 consecutive months of losing money?  He spent his Sundays watching recordings of the trading sessions, focusing on "the most critical points each day" (p. 47).  He watched these at advanced speeds, thereby exercising his pattern recognition ability.  When patterns then showed up in live trading his "real-time trading felt slowed down" (p. 47).

What's the key insight here?  Once again we see the value of immersion in developing real-time pattern recognition.  To trade all week and then immerse oneself on Sundays to hone one's game takes determination and a real love for markets.  But the most important insight is that success does not rely on indicator patterns, but on "nuances" within these indicators that occur at "very specific moments in time".  In other words, what Breitstein found were the patterns within patterns:  the nuances.

The nuances that offer "tremendous positive expected value" can only be identified through extensive, focused exposure to market turning points.  George Coyle, in the book, points out Breitstein's "commitment to work harder than anyone else...He adhered to his plan regardless of whether he felt amazing or awful" (p. 77).  The insight here is that it is the intensity and consistency of effort that produces unusual returns.  We cannot find and exploit subtle nuances if we are only casually engaged with markets.

======================

6/30/2026 - It is fascinating to see that many themes cut across the most recent set of Market Wizards.  A few of these are demonstrated by Kristjan Kullamagi in his interview:

1)  Learning by immersion - Kullamagi insists that there is nothing original in the patterns he successfully trades.  He indicates that "I got them from other people...I haven't invented anything" (p. 27-28).  But he also explains, "I looked at thousands of historical charts and verified that these patterns occurred repeatedly" (p. 27).  Seeing firsthand that these patterns are reliable gave him the confidence to trade and bounce back from losses.  

2)  Innovation - George Coyle points out that "Kullamagi's amazing results came from playing where many say you shouldn't play" (p. 29):  very high volatility situations.  Jack Schwager explains that Kullamagi spent 60-80 hours a week for a decade honing his skills (p. 30) with patterns that only make money 25-30% of the time (p. 31).  Most traders would avoid such patterns, but Kullamagi has succeeded with them because of his ability to tolerate--and control--losses.  He's not playing the game better; he found a better game that works for him.

3)  Persistence - Schwager explains that "One of the critical qualities of Market Wizards is that they refuse to give up" (p. 33).  Their resilience comes from a deep belief in the rightness of what they are pursuing:  they see something unique and distinctive in markets and are not willing to walk away from that.  Kullamagi experienced several early setbacks, but retained his confidence and his quest.  

Great traders are intellectual entrepreneurs.  They delve deeply into markets and perceive unique opportunity.  It is the depth and beauty of their vision that provides them with the drive to overcome their learning curves and achieve success in their own, distinctive ways.

======================= 

6/29/2026 - One of the most insightful interviews in the latest Market Wizards book is with Simon Russo, who first became passionately attracted to music and then to financial markets.  Like many of the greats, he blew up multiple times in his early trading development, but retained the sense that "I had learned a lot about how to make money in the markets".  He wrote a letter to his parents explaining his decision to drop out of school and pursue trading.  In that letter, he explained that "It has never been about the money for me; it is about the path of self-discovery and mastery necessary to become proficient" (p. 97).  

Comparing music and trading he told his parents, "That is what attracts me so much to these two areas; you can never master them, and you have to be self-aware to excel at them.  You can't be a sheep or sell out to become a good musician or trader; you have to put in hard work and countless hours to get where you want to be.  And guess what?  Hard work and countless hours are the best part; it's what fires me up" (p. 97).

Later he noted to his parents, "I will not go with a Plan B because I am worried I will fail.  I have learned to accept and even welcome failure because I don't think you can ever truly succeed without failing first" (p. 126).  Jack Schwager quotes Russo, "I love every part of the process, the entire journey, not just the results.  I love studying and doing the research" (p. 129-130).  

What's the key insight here?  Passion comes from mission.  When we find something that speaks to us deeply, it becomes our purpose, our mission.  Quite literally, Russo found two areas that he fell in love with, so that "hard work and countless hours" did not tire or overwhelm him; they fired him up.  A mission is an organizing principle in our lives.  It is what gives us purpose and meaning.  It is what we are meant to do.  An important challenge for those who wish to excel in markets is to find something so meaningful in your trading that it becomes your guiding principle, your mission to develop.  Then the work will give you energy; it will never exhaust you.  

This is what positive trading psychology is all about:  discipline comes from love.  When we fall in love--in any sphere--our effort fuels our passion and our passion fuels our effort.


Saturday, March 17, 2007

Oversold Stock Market, Or First Leg Of A Bear?

A question I'm hearing again and again from traders is whether we're starting a bear market or completing a normal bull market correction. Few current questions are more relevant for traders and investors alike.

Let's take a look at what the data are telling us.

Suppose we describe each day's price change in the S&P 500 Index (SPY) as a function of its average daily price range over the past 200 days. We thus adjust price changes for the volatility occurring at that time and measure change in terms of "range units". A market that goes up .50 range units thus rises by an amount equivalent to half the average daily price range over the prior 200 days. A market that goes down by -.50 range has fallen by an equivalent amount.

Such a measure enables us to more directly compare price changes from historically volatile market periods to those from markets, like the present one, that have been non-volatile.

Now we will construct a very simple overbought-oversold (OB-OS) indicator by summing the daily range unit changes over the past 20 trading sessions. The result, plotted from 2004 to the present, can be seen in the chart above.

Several patterns are evident in the chart. First, we have seen important market bottoms when the OB-OS measure has dipped below -3.0. Second, we've seen sharp rises off the market lows confirm that we, indeed, have seen lows. Those sharp rises indicate that buyers are jumping into the market to obtain bargain prices. Third, we see that upside momentum in the OB-OS tends to peak ahead of price, as indicated by the blue arrows. That tells us that we tend to see smaller upside thrusts as bull swings age.

At an OB-OS reading of -6.0 recently, we touched oversold levels not seen since the important June/July 2006 market lows. Note that each oversold reading in OB-OS has occurred at higher price lows. That, by definition, occurs in bull markets. Nothing thus far in the current market decline has violated that pattern.

Indeed, going back to the start of 2004 (N = 785), we find 84 occasions in which OB-OS has been below -3.0. Twenty days later, SPY averages a healthy gain of 1.88% (64 up, 20 down). That is much stronger than the average 20 day gain of .44% (442 up, 259 down) for the remainder of the sample. If the bull market is intact, we should see higher prices shortly.

Ah, but here's the rub: If we examine the data going back to 1998 rather than back to 2004, we see that 20-day returns following OB-OS readings of -3.0 or lower are actually negative. What gives?

The answer lies in the difference between bull and bear markets. What makes a bull market is that relatively mild downturns in the OB-OS are taken as buying opportunities by investors. During bear periods such as late 1998 and the 2001-2002 period, those same downturns in the OB-OS become much deeper. To give just a few examples, OB-OS reached -14.0 in July, 2002; -10.0 in September, 2001; and -11 in late August, 1998.

Notice that we can't attribute the difference between those periods and the recent ones simply to market volatility. Each decline is measured in units derived from the volatility of the market as it traded then. No, what makes bear markets--even adjusted for volatility--is that what had been a normal, corrective buying opportunity in the bull market now no longer attracts the same buying. This lack of demand, in turn, stimulates further sales and deeper OB-OS lows.

So what does this mean for the current market?

It is the quality of the next market rise--not anything we can crystal ball at this moment--that will probably tell us whether or not the bull market is alive. If this is a normal correction in an ongoing bull market, we should see investors jump into bargains and drive prices sharply higher. If we get only a tepid bounce from these lows that cannot make new price highs, that will embolden the bears for another round of selling.

In practical terms, that means I take the Missouri approach to the bull market: show me that something has changed since 2004. Until I see distinct evidence of change in actual market patterns--not just fears of mortgage lender bankruptcies, inflation, or a runaway Yen--I will assume that the current regime (trend) is intact. The market will have to show me that something has changed before I alter my investment strategy. It can do that in one of two ways: by producing a subnormal bounce from these lows or by resuming a decline to distinctively more negative OB-OS levels.

At the June/July, 2006 lows, we saw over 50 S&P 500 stocks make fresh 52-week lows. After the recent market tumble, we've seen 8 S&P stocks make annual lows. This time may indeed be different, but the current market will need to show me more before I come to that conclusion.

In an upcoming post, I will update my assessment of Dollar Volume Flows into the large cap stocks to see if institutions are using these lower market prices to pick up bargains. After the initial large market drop, if you recall, Dollar Volume Flows told us that we were *not* seeing bargain hunting. That turned out to be a helpful indication that further weakness was ahead. If we continue to see weak money flows into stocks, even at continued oversold levels, that would trigger my Missouri skepticism about the bull.