
Beginning with a review article that I published in 1992, I focused my career on brief therapy: techniques for accelerating emotional, cognitive, and behavioral change. My co-edited textbook on the topic has become a standard training text for residents in psychiatry, and I've written articles for traders to teach them some brief change techniques. Most recently, my book on Enhancing Trader Performance contains two chapters with self-help manuals to help traders become their own short-term cognitive and behavioral therapists.
Many trading problems related to emotional disruptions can benefit from short-term work, but not all of them. How you trade affects your emotions just as much as emotions affect trading. This is why it is important to distinguish when frustrations are the cause of trading problems and when they are the result.
When I tried to summarize my reasons for writing my first book for traders, The Psychology of Trading, I emphasized the neurophysiology of risk and reward. Quite simply, when we encounter conditions of uncertainty and risk, the blood flow patterns in our brain facilitate our "flight or fight" response patterns. Blood flows away from the frontal cortex, our executive center, and toward motor areas and lower brain structures. That means that we are least likely to activate our judgment, planning, reasoning, and analysis when we most need it.
Brief therapy techniques help people remain grounded in their executive cognitive functions under conditions of high emotional arousal. Stated otherwise, these short-term methods help you stay calm and focused during situations that normally evoke anxiety, impulsivity, negative thinking, or greed.
This series of posts will introduce some of the basics of brief therapy in hopes that you can become your own trading coach. I often stress to traders I work with: my goal is to get fired. I want you to be your own counselor, not to become reliant on me. With practice, any trader can learn techniques for short-term change that have been validated by scores of outcome research studies. My hope is that this series of posts can begin the process for interested market participants.
Friday, November 10, 2006
Market Update for 11/10/06
We came into the day on Thursday with a bit of a bearish bias, as noted in the recent posts, and, indeed, the sellers came out in the afternoon. Altogether, we saw 1159 stocks make fresh 20-day highs across the major exchanges and 618 register new lows. This continues to be a source of concern; it is a much higher level of new lows than we typically see near market peaks and suggests possible distribution among shares. My Demand measure, reflecting the number of stocks trading above their moving average volatility envelopes, was 44; Supply (index of stocks trading below the envelopes) was 89. This suggests continued weak momentum among stocks. If you check out the Weblog and the link to the Adjusted TICK, you'll see that the recent rise has been very unimpressive in terms of buying pressure. We're in a trading range between, roughly, 1380 and yesterday's highs. Unless we can establish greater buying interest, momentum, and strength, I will continue to view this action as part of a topping process. My next full Weblog update will be Sunday.


Thursday, November 09, 2006
Testing Out The Beach Ball Pattern In The Stock Market
We have head-and-shoulders patterns, double tops and bottoms, and flags and pennants. Why not beach ball patterns? You know how beach balls are in the water: You push them down, and they bounce right up.
Wednesday we had a beach ball day, as investors sold stocks on the election news but rallied them higher in the afternoon. What happens after such bouncy occasions?
It turns out that, since 2004 (N = 717 trading days), we've had 16 beach ball days in the S&P 500 Index (SPY), in which the market opened down by more than -.30%, but rallied to close higher than the previous day's close. The next day, the market has been down by an average -.16% (6 up, 10 down). That is notably weaker than the average one-day gain of .03% (390 up, 327 down) for the sample overall.
There's an interesting pattern within the pattern, however. When the market has a beach ball bounce following a five-day period of rising prices (N = 7), as at present, the market has been down an average of -.64% (1 up, 6 down) the next day. That is quite a weak performance.
Conversely, when the beach ball day has follwed a five-day decline (N = 9), SPY has been up by an average of .22% the next day (5 up, 4 down)--stronger than normal.
These are small samples, so must be taken with a grain of salt. Two lessons, however, follow from this little exercise:
1) Subjective impressions in the market aren't always accurate - Before doing any testing, I would have predicted that the beach ball pattern would have been bullish for next-day performance. That seems logical: the market was rejecting lower prices. In fact, if anything, the pattern has been bearish--especially when it follows a period of strength.
2) Context matters - Many chart patterns test out differently depending upon what has happened leading up to the patterns. This is restating something veteran technicians have always known: what's happening on the longer time frame really is important. The beach ball pattern tested out quite differently when it followed strength vs. weakness.
Just about any market pattern you can identify can be tested out. All of my testing is done in Excel with simple open-high-low-close data. Such tests won't always show you a significant edge, but they can be helpful in alerting you to occasions where none exists. In this case, I'm alert to the possibility that the beach ball's bounce may be more of a last gasp for air than a sign of continued buoyancy.
Wednesday we had a beach ball day, as investors sold stocks on the election news but rallied them higher in the afternoon. What happens after such bouncy occasions?
It turns out that, since 2004 (N = 717 trading days), we've had 16 beach ball days in the S&P 500 Index (SPY), in which the market opened down by more than -.30%, but rallied to close higher than the previous day's close. The next day, the market has been down by an average -.16% (6 up, 10 down). That is notably weaker than the average one-day gain of .03% (390 up, 327 down) for the sample overall.
There's an interesting pattern within the pattern, however. When the market has a beach ball bounce following a five-day period of rising prices (N = 7), as at present, the market has been down an average of -.64% (1 up, 6 down) the next day. That is quite a weak performance.
Conversely, when the beach ball day has follwed a five-day decline (N = 9), SPY has been up by an average of .22% the next day (5 up, 4 down)--stronger than normal.
These are small samples, so must be taken with a grain of salt. Two lessons, however, follow from this little exercise:
1) Subjective impressions in the market aren't always accurate - Before doing any testing, I would have predicted that the beach ball pattern would have been bullish for next-day performance. That seems logical: the market was rejecting lower prices. In fact, if anything, the pattern has been bearish--especially when it follows a period of strength.
2) Context matters - Many chart patterns test out differently depending upon what has happened leading up to the patterns. This is restating something veteran technicians have always known: what's happening on the longer time frame really is important. The beach ball pattern tested out quite differently when it followed strength vs. weakness.
Just about any market pattern you can identify can be tested out. All of my testing is done in Excel with simple open-high-low-close data. Such tests won't always show you a significant edge, but they can be helpful in alerting you to occasions where none exists. In this case, I'm alert to the possibility that the beach ball's bounce may be more of a last gasp for air than a sign of continued buoyancy.
Stock Market Sentiment Is Not Necessarily A Contrary Indicator
Sometimes the crowd gets it right.
Let's take the current market. We've been up over a three-day period in the S&P 500 Index (SPY) by over 1.5%. During those three days, the ratio of put volume to call volume among equity options has been .72. That's pretty much the average put/call ratio that we've seen since 2004 (N = 717 trading days) and slightly bearish for periods of solid three-day gain.
Since 2004, we've had 67 occasions in which SPY has been up by more than 1.5% on a three-day basis. The next day, SPY has averaged a loss of -.04% (32 up, 35 down), which is weaker than the average one-day gain of .03% (390 up, 327 down) for the sample overall.
But let's break it down by put/call ratio. When the ratio is greater than .70 over those three days (N = 33), it suggests that put buyers are more aggressive relative to call buyers. The next day, SPY averages a loss of -.22% (12 up, 21 down)--much weaker than average. When the ratio is less than .70 (N = 34) and call buyers are relatively more aggressive, SPY averages a next-day gain of .14% (20 up, 14 down).
In other words, relatively bearish sentiment from options traders during a large three-day rise has led to a correction the next day. Relative optimism among options traders during a three-day advance has carried over to greater strength the next day.
Sometimes, I guess, a true contrarian has to fade even a contrary indicator.
Let's take the current market. We've been up over a three-day period in the S&P 500 Index (SPY) by over 1.5%. During those three days, the ratio of put volume to call volume among equity options has been .72. That's pretty much the average put/call ratio that we've seen since 2004 (N = 717 trading days) and slightly bearish for periods of solid three-day gain.
Since 2004, we've had 67 occasions in which SPY has been up by more than 1.5% on a three-day basis. The next day, SPY has averaged a loss of -.04% (32 up, 35 down), which is weaker than the average one-day gain of .03% (390 up, 327 down) for the sample overall.
But let's break it down by put/call ratio. When the ratio is greater than .70 over those three days (N = 33), it suggests that put buyers are more aggressive relative to call buyers. The next day, SPY averages a loss of -.22% (12 up, 21 down)--much weaker than average. When the ratio is less than .70 (N = 34) and call buyers are relatively more aggressive, SPY averages a next-day gain of .14% (20 up, 14 down).
In other words, relatively bearish sentiment from options traders during a large three-day rise has led to a correction the next day. Relative optimism among options traders during a three-day advance has carried over to greater strength the next day.
Sometimes, I guess, a true contrarian has to fade even a contrary indicator.
Wednesday, November 08, 2006
What's Up, Doc?
I'll tell you what's up this morning in the wake of Democratic celebration and a down S&P 500 Index: some of those favorite names in alternative energy.
Ballard Power Systems (BLDP) is up over 4% as I write. Plug Power (PLUG) is up over 3%.
The alternative energy sector has long been a darling of speculators, but nothing was going to happen in a sustained way while an administration dominated by oil executives and supported by Congress was dictating policy.
With this election, that scenario is changing.
Energy independence will be the mantra of the next party in power. It will frame a response to terrorism, human rights, and the Middle East--and it will capture patriotic appeal. It will address growing concerns with global warming and the environment and will promise economic security. It will bring us closer to our allies abroad and ease some of the tensions with countries that compete with us for oil.
A few traders in that alternative energy space seem to have figured that out.
Ballard Power Systems (BLDP) is up over 4% as I write. Plug Power (PLUG) is up over 3%.
The alternative energy sector has long been a darling of speculators, but nothing was going to happen in a sustained way while an administration dominated by oil executives and supported by Congress was dictating policy.
With this election, that scenario is changing.
Energy independence will be the mantra of the next party in power. It will frame a response to terrorism, human rights, and the Middle East--and it will capture patriotic appeal. It will address growing concerns with global warming and the environment and will promise economic security. It will bring us closer to our allies abroad and ease some of the tensions with countries that compete with us for oil.
A few traders in that alternative energy space seem to have figured that out.
What Drives Investor Sentiment?

After my recent post on bullish market sentiment, a reader expressed surprise that we were seeing such protracted optimism. After all, weren't housing prices falling? Isn't the war going poorly? Aren't we reacting to geopolitical problems in North Korea, Iran, and the Middle East more widely?
My response was that, perhaps, sentiment is simply a function of price. We haven't seen a 10% correction in the Dow since the 2003 start of the bull market. Perhaps that's why sentiment has remained elevated. It's not just that bullish sentiment leads people to put their money on stocks; rising stocks also might generate bullish sentiment.
Such a conclusion would fit with the interesting research noted on the excellent CXO Advisory blog, which found that margin debt actually slightly lags stock index price: people borrow money for investment when they see rising prices.
Above we see a chart of weekly data from 2003-present. The red line is a detrended composite measure of sentiment taken from the three surveys from my prior research. The blue line represents weekly 52-week new highs minus new lows in the NYSE, adjusted as a percentage for the number of issues traded. Note that there is a strong correlation between new highs/lows and sentiment. Indeed, from July, 1987 to 2006 (N = 980 weekly periods), the correlation between new highs/lows and sentiment has been .54. When we have many stocks making new highs, sentiment tends to be more bullish; when we have many stocks making annual new lows, sentiment tends to be less bullish.
Viewed another way, we can say that the new highs/lows account for almost 30% of the variance in investor sentiment. That still leaves a chunk of variance unexplained--and room for sentiment to diverge from the new highs/lows.
Might there be trading patterns in such divergence?
When bullish sentiment across the three surveys runs 10% or more above average (N = 124), the next 20 weeks in the Dow Jones Industrials average a gain of 1.46% (70 up, 54 down). That is weaker than the average 20-week gain of 3.67% (682 up, 298 down) for the entire sample. Very bullish sentiment leads to inferior returns in the intermediate term.
But wait! Let's divide the bullish sentiment periods in half based upon the new highs/lows. When new highs are strong *and* we have high bullish sentiment, the next 20 weeks in the Dow average a gain of .28% (28 up, 36 down). When new highs are not strong and there is bullish sentiment, the next 20 weeks in the Dow average a gain of 2.63% (42 up, 22 down).
What that says is that markets yield subnormal returns when lots of stocks are making new highs and investors are very bullish. When investors are bullish in the absence of great strength in new highs, that bullishness is associated with much more normal returns going forward.
How about when sentiment is bearish? When bullish sentiment has been 10% or more below average (N = 114), the next 20 weeks in the Dow average a gain of 7.30% (94 up, 20 down), much stronger than the average 20-week Dow gain. That tells us that very bearish sentiment leads to superior returns in the intermediate term.
When we have weak bullish sentiment *and* a high level of stocks making new lows (N = 57), the next 20 weeks in the Dow average a gain of 9.1% (50 up, 7 down). That's stronger than the performance when we have weak bullish sentiment and a low level of stocks making new lows (5.49%; 44 up, 10 down).
In short, sentiment is highly but not perfectly correlated with price and market strength. It's when sentiment is highly bearish and lots of stocks are making new lows that returns are most favorable for investors.
Tuesday, November 07, 2006
This Market Is Full Of Bull!
In my recent post, I averaged the bullish stock market sentiment from three well-regarded and longstanding surveys and found unprecedented bullishness during the past two years. My latest article for Trading Markets found that the peaks and valleys of sentiment across the three surveys have tracked intermediate-term market swings quite nicely. A chart of those data can be found on the 11/7 Trading Psychology Weblog.
Going back to mid-1987 (N = 1006 weekly periods), I created a composite measure of investor sentiment by averaging the bullish percentages from the American Association of Individual Investors survey, the Investors Intelligence poll, and the survey from Market Vane. Over that period, these measures of sentiment are positively correlated with each other, but do not have huge areas of overlap. The AAII and Investors Intelligence polls are most closely related, with a correlation of .52. Those two polls correlate with the Market Vane measure by only about .26. Altogether, the polls share less than 30% of the total variance in reported sentiment. That suggests to me that the surveys may be tapping different kinds of traders: some shorter-term, some longer-term, some index traders, some traders on individual equities.
By averaging the three surveys and focusing on when they are all bullish or bearish, we can obtain a good sense for when a variety of traders are leaning the same way in the market.
What we find in doing so is that, since 1987, the 2004-2006 is unprecedented in its persistent bullishness. Specifically, the average bullish percentage from 2004-2006 has been 53%. The average bullishness from 1987-2003 has been 43%. To put that into perspective, 71% of all weekly periods since 2004 have seen bullish readings over 50%. Prior to 2004, only 20% of readings exceeded 50%.
But now the big question: Does investor sentiment have an impact upon future price changes?
When composite bullishess has exceeded 55% (N = 108), the next 10 weeks in the Dow Jones Industrial Average have averaged gains of only .57% (60 up, 48 down). That is considerably weaker than the average ten-week gain of 1.70% (640 up, 366 down) for the entire sample. Indeed, when bullishness has exceeded 60% (N = 22), the next ten weeks in the Dow average a loss of -2.51% (7 up, 15 down)--a remarkable finding, given the long-term bullish bias in the Dow over that period.
How about when bullishness has been below 40% (N = 308)? The next ten weeks in the Dow average a robust gain of 3.0% (217 up, 91 down)--much stronger than average.
It does, indeed, appear that investor sentiment possesses some contrary value. Consider the outcomes when we look 20 weeks out: When sentiment is bullish (over 55%), the average gain over the next year is a subnormal 1.44%; when there are relatively few bulls (under 40%), the average gain is a robust 5.34%.
The present market, hovering near that 60% level, has some uncomfortable company in market history, including January, 2000; April, 1998; and August,1987. Not every period of very high bullishness has led to a market crash, but only 6 of the 22 highly bullish periods were higher 20 weeks later. And that's no bull.
Going back to mid-1987 (N = 1006 weekly periods), I created a composite measure of investor sentiment by averaging the bullish percentages from the American Association of Individual Investors survey, the Investors Intelligence poll, and the survey from Market Vane. Over that period, these measures of sentiment are positively correlated with each other, but do not have huge areas of overlap. The AAII and Investors Intelligence polls are most closely related, with a correlation of .52. Those two polls correlate with the Market Vane measure by only about .26. Altogether, the polls share less than 30% of the total variance in reported sentiment. That suggests to me that the surveys may be tapping different kinds of traders: some shorter-term, some longer-term, some index traders, some traders on individual equities.
By averaging the three surveys and focusing on when they are all bullish or bearish, we can obtain a good sense for when a variety of traders are leaning the same way in the market.
What we find in doing so is that, since 1987, the 2004-2006 is unprecedented in its persistent bullishness. Specifically, the average bullish percentage from 2004-2006 has been 53%. The average bullishness from 1987-2003 has been 43%. To put that into perspective, 71% of all weekly periods since 2004 have seen bullish readings over 50%. Prior to 2004, only 20% of readings exceeded 50%.
But now the big question: Does investor sentiment have an impact upon future price changes?
When composite bullishess has exceeded 55% (N = 108), the next 10 weeks in the Dow Jones Industrial Average have averaged gains of only .57% (60 up, 48 down). That is considerably weaker than the average ten-week gain of 1.70% (640 up, 366 down) for the entire sample. Indeed, when bullishness has exceeded 60% (N = 22), the next ten weeks in the Dow average a loss of -2.51% (7 up, 15 down)--a remarkable finding, given the long-term bullish bias in the Dow over that period.
How about when bullishness has been below 40% (N = 308)? The next ten weeks in the Dow average a robust gain of 3.0% (217 up, 91 down)--much stronger than average.
It does, indeed, appear that investor sentiment possesses some contrary value. Consider the outcomes when we look 20 weeks out: When sentiment is bullish (over 55%), the average gain over the next year is a subnormal 1.44%; when there are relatively few bulls (under 40%), the average gain is a robust 5.34%.
The present market, hovering near that 60% level, has some uncomfortable company in market history, including January, 2000; April, 1998; and August,1987. Not every period of very high bullishness has led to a market crash, but only 6 of the 22 highly bullish periods were higher 20 weeks later. And that's no bull.
Monday, November 06, 2006
The Most Promising Application of Psychology to Trading
If trading firms managed money as scientifically as they conduct their hiring, most would be out of business quickly.
The problem is prevalent in the business world. We have sophisticated tools for accounting, process control, and marketing, but hiring practices remain mired in the subjectivity of personal interviews and reviews of resumes.
Hiring new traders poses special challenges. Without an established track record of success, how can firms determine if candidates have the skills and talents needed to succeed?
Few people are aware that research in psychology has led to the creation of highly realistic simulations that allow firms to directly measure the competencies needed for success. The studies of Drs. Siegfried Streufert and Usha Satish are particularly noteworthy in this regard. Their Strategic Management Simulations put candidates through a series of scenarios that require decision making. The decisions made and rationales for these are used to create a web-like diagram of the candidate's cognitive functioning. What the diagram actually measures, the researchers note, are aspects of frontal activity in the brain.
The brain's frontal cortex is called by cognitive neuroscientist Elkhonon Goldberg our executive center. It is responsible for much of our reasoning, planning, judgment, analysis, and problem-solving. By creating standardized tasks for a variety of professions--from CEOs to physicians--Streufert and Satish in essence have designed a methodology to match people's brains to the work they will be doing.
The implications for trading are immense.
It is not difficult to create highly realistic trading simulations utilizing actual historical market data. By asking traders to trade a standardized set of markets and track news and market events as they occur, we can analyze their reasons for decisions. This analysis will generate cognitive maps that display how candidate traders think and behave under varying conditions of challenge, complexity, and stress. We can directly observe how people handle risk, how their emotions aid or hinder their objectivity, and how they manage change and new information.
If simulations on a computer can accurately predict the performance of surgeons, perhaps they can unlock some of the factors that account for trading success. Perhaps, too, they can help identify future superstar performers.
The most promising application of psychology to trading--and many other fields--comes, not from the therapy couch, but from cognitive neuroscience. Quietly, in a variety of fields, matching brains to tasks is revolutionizing hiring practice.
The problem is prevalent in the business world. We have sophisticated tools for accounting, process control, and marketing, but hiring practices remain mired in the subjectivity of personal interviews and reviews of resumes.
Hiring new traders poses special challenges. Without an established track record of success, how can firms determine if candidates have the skills and talents needed to succeed?
Few people are aware that research in psychology has led to the creation of highly realistic simulations that allow firms to directly measure the competencies needed for success. The studies of Drs. Siegfried Streufert and Usha Satish are particularly noteworthy in this regard. Their Strategic Management Simulations put candidates through a series of scenarios that require decision making. The decisions made and rationales for these are used to create a web-like diagram of the candidate's cognitive functioning. What the diagram actually measures, the researchers note, are aspects of frontal activity in the brain.
The brain's frontal cortex is called by cognitive neuroscientist Elkhonon Goldberg our executive center. It is responsible for much of our reasoning, planning, judgment, analysis, and problem-solving. By creating standardized tasks for a variety of professions--from CEOs to physicians--Streufert and Satish in essence have designed a methodology to match people's brains to the work they will be doing.
The implications for trading are immense.
It is not difficult to create highly realistic trading simulations utilizing actual historical market data. By asking traders to trade a standardized set of markets and track news and market events as they occur, we can analyze their reasons for decisions. This analysis will generate cognitive maps that display how candidate traders think and behave under varying conditions of challenge, complexity, and stress. We can directly observe how people handle risk, how their emotions aid or hinder their objectivity, and how they manage change and new information.
If simulations on a computer can accurately predict the performance of surgeons, perhaps they can unlock some of the factors that account for trading success. Perhaps, too, they can help identify future superstar performers.
The most promising application of psychology to trading--and many other fields--comes, not from the therapy couch, but from cognitive neuroscience. Quietly, in a variety of fields, matching brains to tasks is revolutionizing hiring practice.
Are The Bulls Stampeding?
I know that sounds like a crazy question, but I like to listen to the data.
Let's take three measures of investor sentiment: the polls of the American Association of Individual Investors, Investors Intelligence, and Market Vane. What we find across all three is that more than 50% of survey participants are bullish on the stock market.
Going back to 1987 in all of those polls (N = 1006 weeks; the extent of my data set), we only find 86 weekly periods in which this has been the case.
Three clusters of those occasions fell during August, 1987; April, 1998; and January, 2000. Not exactly great times to be owning stocks.
But here's the really unusual thing: 64 of the 86 weekly periods of unanimous bullishness since 1987 have occurred during this bull market: since June, 2003.
We have never had such a protracted period of bullishness in the surveys in recent history.
Tonight I'll break it down and post my analyses tomorrow AM. Odd that this isn't on the radar for more traders and investors.
Let's take three measures of investor sentiment: the polls of the American Association of Individual Investors, Investors Intelligence, and Market Vane. What we find across all three is that more than 50% of survey participants are bullish on the stock market.
Going back to 1987 in all of those polls (N = 1006 weeks; the extent of my data set), we only find 86 weekly periods in which this has been the case.
Three clusters of those occasions fell during August, 1987; April, 1998; and January, 2000. Not exactly great times to be owning stocks.
But here's the really unusual thing: 64 of the 86 weekly periods of unanimous bullishness since 1987 have occurred during this bull market: since June, 2003.
We have never had such a protracted period of bullishness in the surveys in recent history.
Tonight I'll break it down and post my analyses tomorrow AM. Odd that this isn't on the radar for more traders and investors.
Testing The Market's Winds
Much of my morning routine consists of looking at a few core measures of market sentiment, participation, momentum, and strength and seeing what stands out in the recent market. Once I find something that stands out, I go back in time and see what happened following similar episodes. This gives me an initial idea of whether this historical pattern might be associated with a directional trading edge.
The historical pattern is just that. Such patterns do not last forever, and--at best--they can put probability on your side, not certainty.
I treat these patterns like a scientist treats a hypothesis: an idea that will have to be supported by further investigation before it is accepted. Each day in the market, in that sense, is a kind of laboratory experiment, either supporting or failing to support history's hypothesis.
This morning, one pattern that I'm looking at is four consecutive days of negative daily readings in the Adjusted NYSE TICK. The Adjusted TICK is quoted daily in the Weblog and reflects whether more stocks were trading at their offer prices or at their bids. This is an excellent short-term measure of sentiment, because it captures the willingness of buyers to pay up to acquire stocks and the willingness of sellers to bail out at market prices.
The first thing we see in the data is that four consecutive days of negative TICK (bearish sentiment) is relatively unusual. We've only seen 45 such occasions since the beginning of 2004 (N = 709). The next day in the S&P 500 Index (SPY), the market was up by an average of .29% (31 up, 14 down), much stronger than the average one-day gain of .03% (382 up, 327 down). Stated otherwise, the odds of an up day following a four-day period of persistent bearish sentiment have been better than 2:1.
Sometimes we'll see more than one historical pattern point toward the same general conclusion. That provides us with a bit more confidence in our hypothesis. Still, it is just a hypothesis. If today is going to be an up day from open to close, we need to see a net positive TICK. That means an abundance of high readings (above +500) and very few weak ones (below -500). If we see selling in the ES futures--traders hitting bids--but TICK staying relatively strong, I'll conclude that the selling is not spilling over into the broad market, and I'll be willing to go with my hypothesis on the long side.
Should selling in ES spill over to the broad market, I will entertain the notion that this market is not living up to its historical norms. That, too, is valuable information.
The good scientist is open minded. Carl Swenlin of the Decision Point service makes a fine point when he says that indicators are windsocks, not crystal balls. They tell you which way the market wind is blowing. All history can do is prepare you just a bit for those winds.
The historical pattern is just that. Such patterns do not last forever, and--at best--they can put probability on your side, not certainty.
I treat these patterns like a scientist treats a hypothesis: an idea that will have to be supported by further investigation before it is accepted. Each day in the market, in that sense, is a kind of laboratory experiment, either supporting or failing to support history's hypothesis.
This morning, one pattern that I'm looking at is four consecutive days of negative daily readings in the Adjusted NYSE TICK. The Adjusted TICK is quoted daily in the Weblog and reflects whether more stocks were trading at their offer prices or at their bids. This is an excellent short-term measure of sentiment, because it captures the willingness of buyers to pay up to acquire stocks and the willingness of sellers to bail out at market prices.
The first thing we see in the data is that four consecutive days of negative TICK (bearish sentiment) is relatively unusual. We've only seen 45 such occasions since the beginning of 2004 (N = 709). The next day in the S&P 500 Index (SPY), the market was up by an average of .29% (31 up, 14 down), much stronger than the average one-day gain of .03% (382 up, 327 down). Stated otherwise, the odds of an up day following a four-day period of persistent bearish sentiment have been better than 2:1.
Sometimes we'll see more than one historical pattern point toward the same general conclusion. That provides us with a bit more confidence in our hypothesis. Still, it is just a hypothesis. If today is going to be an up day from open to close, we need to see a net positive TICK. That means an abundance of high readings (above +500) and very few weak ones (below -500). If we see selling in the ES futures--traders hitting bids--but TICK staying relatively strong, I'll conclude that the selling is not spilling over into the broad market, and I'll be willing to go with my hypothesis on the long side.
Should selling in ES spill over to the broad market, I will entertain the notion that this market is not living up to its historical norms. That, too, is valuable information.
The good scientist is open minded. Carl Swenlin of the Decision Point service makes a fine point when he says that indicators are windsocks, not crystal balls. They tell you which way the market wind is blowing. All history can do is prepare you just a bit for those winds.
Sunday, November 05, 2006
Tracking Market Psychology With NYSE Margin Debt
In my recent post, I tracked margin debt on the NYSE back to 1970 and found a consistent pattern across bull and bear markets. During cyclical declines, we tend to see year-over-year declines in margin debt. During bull market peaks, we tend to see substantial annual gains in margin debt. It is this tendency to borrow money to buy stocks when markets are already high and refrain from borrowing when markets are weak that makes margin debt a worthy contrary indicator.
From the vantage point of market psychology, margin debt is one of the purest measures of fear and greed. When investors are greedy, they will go beyond their cash balances to buy stocks. When they are fearful, they will refrain from leveraged positions. The big question, however, is whether future market returns are impacted by the fear and greed of margined investors.
Going back to 1970 (1818 weekly periods) in the Dow Jones Industrial Average, we find that, when annual changes in margin debt exceed 30% (N = 445), the next 52 weeks in the Dow average a gain of only 1.39% (209 up, 236 down). That is much weaker than the average 52-week gain of 9.05% (1285 up, 533 down) for the entire sample. In short, periods of greed lead to subnormal market performance.
How about fear? When the annual rate of change in margin debt has been -25% or less (N = 128), the next 52 weeks in the Dow average a gain of only 1.14% (57 up, 71 down). Again, that is much weaker than the average yearly gain for the Dow since 1970.
Indeed, when we have neither fear nor greed--when the annual rate of change in margin debt is less than +10% but greater than -10% (N = 427), the next year in the Dow brings an average gain of 13.91% (357 up, 7o down)--considerably stronger than average. Given that we are neither seeing extreme fear or greed at present in margin debt, we'd have to say that there are no immediate bearish indications.
In short, extremes of investor fear or greed have led to subnormal returns in stock prices. It is when sentiment has been moderate that returns have been best.
Let's however, consider the trajectory of margin debt at recent market peaks. The annual rate of margin debt peaked in March/April, 2000, near the peak in the NASDAQ but prior to the Dow peaks later that year and in May of 2001. The annual increase in margin debt peaked in May/June, 1998, a month or two ahead of the sharp decline. The peak in August, 1989 preceded the price peak of 1990 by nearly 11 months. The margin debt rate peak of December, 1986 preceded the price peak of 1987 by about 9 months. The annual peak in November, 1983 preceded the price peak of 1984 by about 2 months. The late April peak in 1981 was only about 2 months ahead of the price peak.
What is clear from this little excursion is that annual rates of change in margin debt are not precise market timing tools, but there is a tendency for these rates of change to top out ahead of the Dow stocks. In other words, investors reduce the growth in their margin accounts as markets are topping. This is relevant because we saw our maximum annual rate of change in margin debt all the way back in April, 2004. The most recently reported rate is well below that recorded in May of 2006. The slowing of growth in margin debt following a multi-year rise is a yellow--not a red--light for stocks going forward.
From the vantage point of market psychology, margin debt is one of the purest measures of fear and greed. When investors are greedy, they will go beyond their cash balances to buy stocks. When they are fearful, they will refrain from leveraged positions. The big question, however, is whether future market returns are impacted by the fear and greed of margined investors.
Going back to 1970 (1818 weekly periods) in the Dow Jones Industrial Average, we find that, when annual changes in margin debt exceed 30% (N = 445), the next 52 weeks in the Dow average a gain of only 1.39% (209 up, 236 down). That is much weaker than the average 52-week gain of 9.05% (1285 up, 533 down) for the entire sample. In short, periods of greed lead to subnormal market performance.
How about fear? When the annual rate of change in margin debt has been -25% or less (N = 128), the next 52 weeks in the Dow average a gain of only 1.14% (57 up, 71 down). Again, that is much weaker than the average yearly gain for the Dow since 1970.
Indeed, when we have neither fear nor greed--when the annual rate of change in margin debt is less than +10% but greater than -10% (N = 427), the next year in the Dow brings an average gain of 13.91% (357 up, 7o down)--considerably stronger than average. Given that we are neither seeing extreme fear or greed at present in margin debt, we'd have to say that there are no immediate bearish indications.
In short, extremes of investor fear or greed have led to subnormal returns in stock prices. It is when sentiment has been moderate that returns have been best.
Let's however, consider the trajectory of margin debt at recent market peaks. The annual rate of margin debt peaked in March/April, 2000, near the peak in the NASDAQ but prior to the Dow peaks later that year and in May of 2001. The annual increase in margin debt peaked in May/June, 1998, a month or two ahead of the sharp decline. The peak in August, 1989 preceded the price peak of 1990 by nearly 11 months. The margin debt rate peak of December, 1986 preceded the price peak of 1987 by about 9 months. The annual peak in November, 1983 preceded the price peak of 1984 by about 2 months. The late April peak in 1981 was only about 2 months ahead of the price peak.
What is clear from this little excursion is that annual rates of change in margin debt are not precise market timing tools, but there is a tendency for these rates of change to top out ahead of the Dow stocks. In other words, investors reduce the growth in their margin accounts as markets are topping. This is relevant because we saw our maximum annual rate of change in margin debt all the way back in April, 2004. The most recently reported rate is well below that recorded in May of 2006. The slowing of growth in margin debt following a multi-year rise is a yellow--not a red--light for stocks going forward.
Solution Focused Trading
What is the one thing we see among successful traders, artists, athletes, executives, researchers, and companies?
They build upon their strengths and don't become bogged down trying to invent new ones or attempting to improve their weaknesses. In so doing, they become learning machines.
Consider a simple example. When I first began this blog not quite a year ago, I averaged about 7500 visits per month. This continued for the first few months.
I then began to study the daily statistics of how many people were accessing the site, which pages they went to, and where they were referred from. What I found was that certain topics interested readers and other bloggers quite a bit. Other topics fell flat and generated little interest.
Did I spend time trying to make the unpopular topics more palatable or trying to convince other bloggers to link to my less desired work? No, I took what brief therapists call a solution focus instead. The readership was telling me what their needs and interests were. I needed to do more of what was already working, not fiddle with topics that weren't relevant for readers.
With a shift in emphasis toward highly practical research findings and psychology themes, I found that readership had tripled by May. Feedback from reader comments and emails led me to build further on strengths, adding the morning market updates to help readers apply information from the blog in real time. With that, readership has undergone a doubling from May levels.
By gathering information every day on how the blog was performing and using the data to identify and build upon strengths, I've been able to make the site more useful for readers. Every post, popular and unpopular, became a learning experience. The trajectory of growth in readership, which had been flat prior to my studying the statistics, took a significant upward turn.
This is the process by which all elite levels of success are achieved: identify core competencies and build upon them, constantly assessing what is working and what is not. Figure out what you're doing right--and then become very intentional in doing it more often, more consistently. Don't invest your limited time and effort in areas that don't represent what you do best.
This is why it is vital to study your best trades, not just write in a journal about your worst ones. Find the trades where you had an excellent plan or read of the market and where you were able to execute the idea well. What patterns did you pick up on? How did you act upon the pattern? Were the patterns more apt to appear in certain stocks or at particular times of day? Such questions will lead you to what works best for you.
You may find that just one or two patterns in one or two markets at one or two time frames account for a large part of your success. Don't try to tweak what isn't working: figure out ways to capitalize on your core success in related markets, with steadily increased size. Build upon what you do well; don't try to remake yourself based on preconceived notions.
The solution focus is evolution in real time. We are selecting the strongest of our behavior patterns and allowing the weakest to become extinct. Over time, our own guided natural selection enables us to become learning machines, capable of superior adaptation.
Think about how a solution focus could guide your trading development, your career development, and your relationships. Think of yourself as an engine of continuous evolution. How far we could go if we provided every facet of life with an emotional P/L statement and just focused on doing more of what makes us happy, fulfilled, and successful!
They build upon their strengths and don't become bogged down trying to invent new ones or attempting to improve their weaknesses. In so doing, they become learning machines.
Consider a simple example. When I first began this blog not quite a year ago, I averaged about 7500 visits per month. This continued for the first few months.
I then began to study the daily statistics of how many people were accessing the site, which pages they went to, and where they were referred from. What I found was that certain topics interested readers and other bloggers quite a bit. Other topics fell flat and generated little interest.
Did I spend time trying to make the unpopular topics more palatable or trying to convince other bloggers to link to my less desired work? No, I took what brief therapists call a solution focus instead. The readership was telling me what their needs and interests were. I needed to do more of what was already working, not fiddle with topics that weren't relevant for readers.
With a shift in emphasis toward highly practical research findings and psychology themes, I found that readership had tripled by May. Feedback from reader comments and emails led me to build further on strengths, adding the morning market updates to help readers apply information from the blog in real time. With that, readership has undergone a doubling from May levels.
By gathering information every day on how the blog was performing and using the data to identify and build upon strengths, I've been able to make the site more useful for readers. Every post, popular and unpopular, became a learning experience. The trajectory of growth in readership, which had been flat prior to my studying the statistics, took a significant upward turn.
This is the process by which all elite levels of success are achieved: identify core competencies and build upon them, constantly assessing what is working and what is not. Figure out what you're doing right--and then become very intentional in doing it more often, more consistently. Don't invest your limited time and effort in areas that don't represent what you do best.
This is why it is vital to study your best trades, not just write in a journal about your worst ones. Find the trades where you had an excellent plan or read of the market and where you were able to execute the idea well. What patterns did you pick up on? How did you act upon the pattern? Were the patterns more apt to appear in certain stocks or at particular times of day? Such questions will lead you to what works best for you.
You may find that just one or two patterns in one or two markets at one or two time frames account for a large part of your success. Don't try to tweak what isn't working: figure out ways to capitalize on your core success in related markets, with steadily increased size. Build upon what you do well; don't try to remake yourself based on preconceived notions.
The solution focus is evolution in real time. We are selecting the strongest of our behavior patterns and allowing the weakest to become extinct. Over time, our own guided natural selection enables us to become learning machines, capable of superior adaptation.
Think about how a solution focus could guide your trading development, your career development, and your relationships. Think of yourself as an engine of continuous evolution. How far we could go if we provided every facet of life with an emotional P/L statement and just focused on doing more of what makes us happy, fulfilled, and successful!
Saturday, November 04, 2006
Stock Market Margin Debt: An Indicator That Hasn't Lost Its Value for Investors
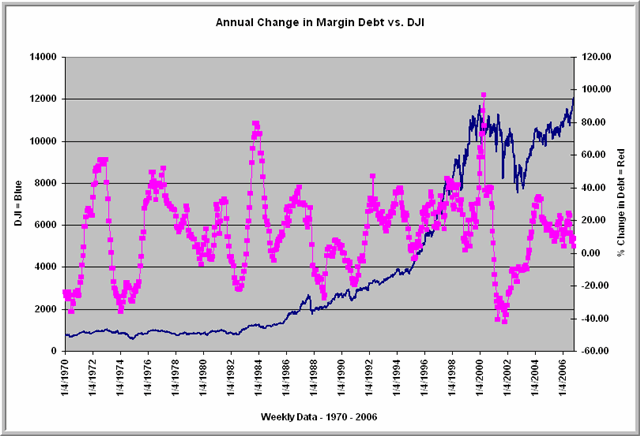
One of the best indicators of speculative sentiment among investors is margin debt. This doesn't measure what participants think will happen in the market; it assesses their actual commitments to the market. A sharp rise in margin debt means that investors are eager to get into stocks. A sharp contraction in debt suggests that investors are loathe to commit funds. When all the speculative money has piled into stocks--or has pulled out--what will sustain future rises or declines? It's for this reason that margin debt is a consummate contrary indicator.
Let's check the historical track record:
* During the large market drop in 1970, margin debt plunged year over year by over 35%
* With the market recovery in 1972, debt had risen by over 50%.
* During the large market drop in 1974, margin debt fell by 30%.
* By the market's recovery early in 1977, margin debt rose by over 50%.
* During the 1982 market decline, debt fell by over 22%.
* By the market peak in 1987, market debt had risen over 30%.
* With the 1987 crash, debt dropped by over 25% in 1988.
* Margin debt was slow to recover after that crash and rose only 8% by 1989.
* With the 1990 drop, debt dropped by nearly 20%.
* By early 1994, speculators were back and margin debt was up by 40%.
* Speculators were reluctant to leave the market and, by late 1994, margin debt was down only about 4%.
* With the market's speculative binge in 2000, margin debt had risen by 90%.
* The ensuing crash in tech stocks took margin debt down over 40% by 2001 and cut total margin debt in half from 2000 peaks by 2002.
* Since that drop, we saw a year-over-year peak in margin debt change of over 30% in early 2004 and over 20% in 2006, although we are not yet at the 2000 level of margin debt.
In my next post, I'll see if some guidance for long-term investment can be gained from the margin debt figures.
In the interim, several conclusions stand out:
1) Spikes in annual changes in margin debt have been associated with market tops.
2) Large declines in annual changes of margin debt have been associated with most major market bottoms.
3) Speculators have been relatively slow to jump on board the stock market following the drop of 2000-2002. In that sense, the response to the decline has been similar to the response following the drop of 1987 and, to a lesser degree, 1970 and 1974. Large bear markets appear to affect the behavior of speculators over the next business cycle.
Interestingly, margin debt is below the levels recorded in May, despite the market's recent rise. Year over year, we're up about 9% in margin debt, down from the 2006 peak of over 24%. It is hard to believe this bull swing will have legs if it continues to fail to attract speculative interest. If history is a guide, it will take a significant year-over-year drop in margin debt to usher in a cyclical market bottom.
Friday, November 03, 2006
How Can I Join A Trading Firm?
There are many disadvantages to trading independently. Many independent traders cannot command the same low commissions received by exchange members and member firms. Trading on your own may also be isolating. At a firm, you have dedicated support teams handling equipment, software and hardware upgrades, and developing/acquiring new trading tools. That is beyond the budget of many independent traders.
It is natural, therefore, that many independent traders consider joining a trading firm. Having coordinated a training/hiring program for a Chicago-based proprietary trading firm, I have some familiarity with the challenges and issues involved in making such a move. Here are a few items for your consideration:
1) Many of the best career opportunities for traders are at large institutions, such as investment banks and hedge funds. These are often very well capitalized and able to invest in training and development of traders. The catch? These organizations like to hire graduates of finance and financial engineering programs. Quantitative and programming skills are in demand. If you're looking to build a long-term career in the financial world, I'd strongly encourage you to consider an MBA program with a finance concentration or a Master's program in financial engineering to provide yourself with the competencies and skill sets that are increasingly in demand. In such firms, you'll be an employee with benefits and a salary.
2) Can you afford to start out by trading your own capital? If so, this opens several doors. There are trading "arcades" that provide you with office space, tech support, equipment, and trading platforms and pass along economies of scale to you. These shops generally can command low commission rates and may or may not pass along some of their own commissions to you on top of monthly fees for the service, rent, and equipment. Note that in this structure, you are a customer of the firm, not an employee. That means no salary and, in all likelihood, no draw against future earnings. The upside is that you keep the lion's share of your trading profits. One nice variation on the arcade is the trader's co-op, in which a few experienced traders go in together to share equipment, office space, and other overhead, but trade their own accounts.
3) Do you need capital to get yourself started? Then you might be looking at a proprietary trading firm, in which you trade the firm's capital. The firm provides you with all equipment, space, tech support, software, and platforms. At some of these firms, you may be charged a commission on top of monthly fees. The firm, because it takes 100% of risk, will also take a good chunk of profits. You may qualify as an employee of the prop firm, which means that you would be eligible for normal employee benefits. A monthly draw against future profits may provide you with some stable income; straight salaries are not the norm.
You'll be more competitive to join a bank or hedge fund if you have the education and internship placement experience. You'll be more competitive to join a prop firm if you already have an independent track record of trading success. The education departments at the major exchanges, such as the Chicago Mercantile Exchange and the Chicago Board of Trade, publish lists of member firms and often are aware of training programs and hiring among these. Googling "Master's of Science in Financial Engineering" and looking into MBA programs with strong finance components (see who is publishing in the Journal of Finance!) will give you leads for training for institutional positions.
The bottom line is that few organizations will take you off the street and put capital into your hands to trade. If you're not an experienced trader with your own capital, my advice is to find a graduate program or a training program within a proprietary firm and learn the business from the ground up. Think about building a career, not just getting a job.
It is natural, therefore, that many independent traders consider joining a trading firm. Having coordinated a training/hiring program for a Chicago-based proprietary trading firm, I have some familiarity with the challenges and issues involved in making such a move. Here are a few items for your consideration:
1) Many of the best career opportunities for traders are at large institutions, such as investment banks and hedge funds. These are often very well capitalized and able to invest in training and development of traders. The catch? These organizations like to hire graduates of finance and financial engineering programs. Quantitative and programming skills are in demand. If you're looking to build a long-term career in the financial world, I'd strongly encourage you to consider an MBA program with a finance concentration or a Master's program in financial engineering to provide yourself with the competencies and skill sets that are increasingly in demand. In such firms, you'll be an employee with benefits and a salary.
2) Can you afford to start out by trading your own capital? If so, this opens several doors. There are trading "arcades" that provide you with office space, tech support, equipment, and trading platforms and pass along economies of scale to you. These shops generally can command low commission rates and may or may not pass along some of their own commissions to you on top of monthly fees for the service, rent, and equipment. Note that in this structure, you are a customer of the firm, not an employee. That means no salary and, in all likelihood, no draw against future earnings. The upside is that you keep the lion's share of your trading profits. One nice variation on the arcade is the trader's co-op, in which a few experienced traders go in together to share equipment, office space, and other overhead, but trade their own accounts.
3) Do you need capital to get yourself started? Then you might be looking at a proprietary trading firm, in which you trade the firm's capital. The firm provides you with all equipment, space, tech support, software, and platforms. At some of these firms, you may be charged a commission on top of monthly fees. The firm, because it takes 100% of risk, will also take a good chunk of profits. You may qualify as an employee of the prop firm, which means that you would be eligible for normal employee benefits. A monthly draw against future profits may provide you with some stable income; straight salaries are not the norm.
You'll be more competitive to join a bank or hedge fund if you have the education and internship placement experience. You'll be more competitive to join a prop firm if you already have an independent track record of trading success. The education departments at the major exchanges, such as the Chicago Mercantile Exchange and the Chicago Board of Trade, publish lists of member firms and often are aware of training programs and hiring among these. Googling "Master's of Science in Financial Engineering" and looking into MBA programs with strong finance components (see who is publishing in the Journal of Finance!) will give you leads for training for institutional positions.
The bottom line is that few organizations will take you off the street and put capital into your hands to trade. If you're not an experienced trader with your own capital, my advice is to find a graduate program or a training program within a proprietary firm and learn the business from the ground up. Think about building a career, not just getting a job.
Sell Stocks After A Week of Weakness?
Two measures of buying and selling activity tracked on the Trading Psychology Weblog each day are the Adjusted NYSE TICK (a daily summed measure of number of stocks on NYSE trading at offer minus those traded at bid, adjusted for a zero mean) and the Institutional Composite (the same measure, but with the Dow Jones Industrial Average stocks). During the past five trading sessions, we've had four net selling days in the TICK and all five showing net selling in the Composite. I decided to investigate what happens after we get similar periods of significant weakness in both measures (average daily Adjusted TICK < -300; average daily Composite < -200).
It turns out that we've had 20 such occasions since 2004 (N = 708). Three days later in the S&P 500 Index (SPY), we've seen an average gain of .44% (15 up, 5 down). That is a meaningful bullish edge compared to the average three-day gain of .10% (397 up, 311 down) for the sample overall.
The market, of course, is on edge this AM awaiting the big jobs numbers. Keep an eye on the interest rate and currency markets to see if the news pushes us to new levels of valuation in those markets. If so, the news really is economic news and the adjustments of macro traders could lead to a sustained downward revaluation of equities as well. If the news doesn't really change the outlook for rates or the dollar, I'm going to question whether we'll sustain a major revaluation of stocks. In that scenario, the odds tell us that, as a whole, selling into a week of weakness is not a good bet.
It turns out that we've had 20 such occasions since 2004 (N = 708). Three days later in the S&P 500 Index (SPY), we've seen an average gain of .44% (15 up, 5 down). That is a meaningful bullish edge compared to the average three-day gain of .10% (397 up, 311 down) for the sample overall.
The market, of course, is on edge this AM awaiting the big jobs numbers. Keep an eye on the interest rate and currency markets to see if the news pushes us to new levels of valuation in those markets. If so, the news really is economic news and the adjustments of macro traders could lead to a sustained downward revaluation of equities as well. If the news doesn't really change the outlook for rates or the dollar, I'm going to question whether we'll sustain a major revaluation of stocks. In that scenario, the odds tell us that, as a whole, selling into a week of weakness is not a good bet.
Thursday, November 02, 2006
Addictive Trading: Getting Your Life Back
My recent post on out-of-control trading brought many email inquiries and insightful comments on the blog. One of the common questions voiced was: How can you tell when a trader is passionate about trading vs. addicted to it?
The first step in dealing with any addictive pattern is identifying it--and identifying it as a problem. Here are a few questions that you might ask yourself:
* Have there been times when I told myself to stop trading, but still found myself placing trades any way?
* Do I find myself overtrading by putting on positions with too large size or by trading during periods when nothing is happening?
* Have my trading losses created problems for me in my relationship(s), or have they caused financial problems for me?
* Have people close to me told me that I need to stop trading?
* Is the pain from losing more extreme than the satisfaction from winning?
* Do I find my moods fluctuating with my P/L?
* Do I trade simply out of boredom sometimes?
* Do I find myself preoccupied with trading outside of market hours at the cost of other work and relationships?
Notice that, for many of these questions, you could substitute the word "drinking" or "gambling" for "trading". The dynamics of addictions are the same across the board. If you answered yes to three or more of these questions, I would suggest that trading has become a problem for you.
How does one deal with addictive trading? The first step is to identify it, but the second--and harder--step is to acknowledge that you need help for it. It's pride that tells us we can handle it on our own through will power, but addictions wouldn't occur in the first place if will power were sufficient to prevent consequences.
Telling yourself you can manage your own addiction is itself a form of denial.
That is why a key step in Alcoholics Anonymous is acknowledging that you are powerless against alcohol.
That is why AA substitutes mutual support for drinking and advocates abstinence as a goal.
Through books, self-help groups, and counseling, you learn to identify the thought and behavior patterns that drive your addictive behaviors. You also learn to identify cravings in advance and channel these in productive directions.
Most of all, you regain a measure of control over your life and end the negative consequences of the addiction.
If you find yourself unable to control your trading and you find the emotional, financial, and social consequences mounting, that's not a passion for trading. It's an addiction.
Do the right things:
1) Close your account.
2) Get help.
I do not provide private counseling myself, but will be happy to assist with a referral in your region. If these posts help just one person turn his or her life around, that will be one of the best returns on investment I've ever achieved.
The first step in dealing with any addictive pattern is identifying it--and identifying it as a problem. Here are a few questions that you might ask yourself:
* Have there been times when I told myself to stop trading, but still found myself placing trades any way?
* Do I find myself overtrading by putting on positions with too large size or by trading during periods when nothing is happening?
* Have my trading losses created problems for me in my relationship(s), or have they caused financial problems for me?
* Have people close to me told me that I need to stop trading?
* Is the pain from losing more extreme than the satisfaction from winning?
* Do I find my moods fluctuating with my P/L?
* Do I trade simply out of boredom sometimes?
* Do I find myself preoccupied with trading outside of market hours at the cost of other work and relationships?
Notice that, for many of these questions, you could substitute the word "drinking" or "gambling" for "trading". The dynamics of addictions are the same across the board. If you answered yes to three or more of these questions, I would suggest that trading has become a problem for you.
How does one deal with addictive trading? The first step is to identify it, but the second--and harder--step is to acknowledge that you need help for it. It's pride that tells us we can handle it on our own through will power, but addictions wouldn't occur in the first place if will power were sufficient to prevent consequences.
Telling yourself you can manage your own addiction is itself a form of denial.
That is why a key step in Alcoholics Anonymous is acknowledging that you are powerless against alcohol.
That is why AA substitutes mutual support for drinking and advocates abstinence as a goal.
Through books, self-help groups, and counseling, you learn to identify the thought and behavior patterns that drive your addictive behaviors. You also learn to identify cravings in advance and channel these in productive directions.
Most of all, you regain a measure of control over your life and end the negative consequences of the addiction.
If you find yourself unable to control your trading and you find the emotional, financial, and social consequences mounting, that's not a passion for trading. It's an addiction.
Do the right things:
1) Close your account.
2) Get help.
I do not provide private counseling myself, but will be happy to assist with a referral in your region. If these posts help just one person turn his or her life around, that will be one of the best returns on investment I've ever achieved.
Wednesday, November 01, 2006
What Happens After A Bearish Engulfing Pattern?
I notice that Brian Shannon, in his fine video review of the market, observed that Wednesday's action constituted a bearish engulfing pattern. Now I'm not exactly an expert on candlestick patterns, but the basic notion of a bearish engulfing pattern makes sense to me. We rise above the previous day's high, decline below the prior day's close, and close near the bottom of the day's range. On the face of it, that should be bearish, as we rejected higher prices. Brian notes that he doesn't put much stock in the pattern, preferring to focus on the longer time frame. In the end, as Victor Niederhoffer emphasizes, we must always do our counting and verify any conclusions with hard data.
I went back to 1996 in the S&P 500 Index (SPY; N = 2694 trading days) and found 45 occasions (like Wednesday) that met the following criteria: 1) today rose above yesterday's high; 2) today declined below yesterday's low; 3) today was the largest range of the past five trading sessions; and 4) today closed in the bottom 10% of its day's trading range.
Interestingly, the next trading day in SPY sports an average gain of .10% (31 up, 14 down), notably stronger than the average daily change of .04% (1405 up, 1289 down). Since 2004, we've only had 12 such bearish engulfing days, but--incredibly--11 of them have closed higher the following day for an average gain of .32%.
Clearly there is no next-day bearish edge to outside days that finish near their daily lows. Indeed, there has been a nice bullish tendency following such one-day declines. Once again, we find that anecdotal reasoning has its limits when it comes to market intelligence.
I went back to 1996 in the S&P 500 Index (SPY; N = 2694 trading days) and found 45 occasions (like Wednesday) that met the following criteria: 1) today rose above yesterday's high; 2) today declined below yesterday's low; 3) today was the largest range of the past five trading sessions; and 4) today closed in the bottom 10% of its day's trading range.
Interestingly, the next trading day in SPY sports an average gain of .10% (31 up, 14 down), notably stronger than the average daily change of .04% (1405 up, 1289 down). Since 2004, we've only had 12 such bearish engulfing days, but--incredibly--11 of them have closed higher the following day for an average gain of .32%.
Clearly there is no next-day bearish edge to outside days that finish near their daily lows. Indeed, there has been a nice bullish tendency following such one-day declines. Once again, we find that anecdotal reasoning has its limits when it comes to market intelligence.
Dr. Brett's Heartfelt Plea: When Trading Gets Out of Control
What I love most about trading is that it exercises the brain and the will. It involves ongoing analysis and problem solving, and it requires the steady development of performance-based skills. I'm sure serious players of chess and poker enjoy similar benefits. Talk to any successful athlete and you'll find someone who has cultivated themselves, not just their bodies.
There are times, however, when trading becomes a vehicle for destroying mind and soul. You won't hear brokerage firms, trading publications, or seminar producers talking much about this problem, because their common aim is to keep the public trading and buying trading-related products. But, as someone who has worked with many independent traders and traders at firms, I've seen this problem far too often: trading becomes an addictive activity.
Oh yes, trading coaches and psychologists will talk about losing "discipline", but rarely will they use the "A" word. Discipline you work on, addictions you get rid of. If you get rid of a trading addiction, there goes the trading coach.
Many times, however, losses of discipline in the markets are related to addictive patterns of behavior.
An addiction occurs when an activity provides a strong source of stimulation that, over time, a person becomes psychologically and sometimes physically dependent upon. We generally label a behavior as an addiction when people seek out the activity even in the face of demonstrable negative consequences. It is the inability to stop the activity when those consequences interfere with life that marks any addiction.
Let's look at the facts:
* According to research cited by the National Council on Problem Gambling, 2 million adults (1% of the population) meet the diagnostic criteria for pathological gambling. Another 4-8 million adults (2-4% of the population) can be considered problem gamblers who are experiencing direct problems as a consequence of gambling.
* Research in psychology and psychiatry reported in the Oxford Textbook of Psychopathology finds that between 14 and 16 million Americans meet diagnostic criteria for alcohol abuse or dependence. Between 4-6 million Americans are dependent upon illegal drugs.
* Rates of substance abuse among men ages 18-44 are double those of the general population.
* A family history of addictive problems is one of the best predictors of risk for addiction. Peer influence is another significant risk factor.
* According to a research review in the Oxford Textbook, rates of depression are significantly higher among people with addictions than in the general population, with indications that people are using the addictive activities to medicate themselves for the pain of depression.
* Addictions are also most common among individuals with attention deficits and hyperactivity problems and appear to be related to sensation-seeking among those needing stimulation.
Even if we assume that traders do not have more frequent addictive behaviors than the general population, the statistics tell us that, in all likelihood, nearly one trader in every ten has a diagnosable addictive problem.
For the trader with attention deficits who cannot tolerate boredom or lack of stimulation, trading provides action.
For the trader who is depressed, trading can provide an escape from the self and a sense of immediate gratification.
Such traders need to trade and keep trading when they have no edge whatsoever.
They lose their money, generate failure experiences for themselves, and create hardships for their families.
For them, it's not about "discipline" and following trading rules. It's about getting their lives back. And getting the right kind of help. If you see any aspect of yourself in this portrait, do the right thing. For you, and also for those who love you. Trading should expand your control and self-mastery, not become an instrument for its destruction.
There are times, however, when trading becomes a vehicle for destroying mind and soul. You won't hear brokerage firms, trading publications, or seminar producers talking much about this problem, because their common aim is to keep the public trading and buying trading-related products. But, as someone who has worked with many independent traders and traders at firms, I've seen this problem far too often: trading becomes an addictive activity.
Oh yes, trading coaches and psychologists will talk about losing "discipline", but rarely will they use the "A" word. Discipline you work on, addictions you get rid of. If you get rid of a trading addiction, there goes the trading coach.
Many times, however, losses of discipline in the markets are related to addictive patterns of behavior.
An addiction occurs when an activity provides a strong source of stimulation that, over time, a person becomes psychologically and sometimes physically dependent upon. We generally label a behavior as an addiction when people seek out the activity even in the face of demonstrable negative consequences. It is the inability to stop the activity when those consequences interfere with life that marks any addiction.
Let's look at the facts:
* According to research cited by the National Council on Problem Gambling, 2 million adults (1% of the population) meet the diagnostic criteria for pathological gambling. Another 4-8 million adults (2-4% of the population) can be considered problem gamblers who are experiencing direct problems as a consequence of gambling.
* Research in psychology and psychiatry reported in the Oxford Textbook of Psychopathology finds that between 14 and 16 million Americans meet diagnostic criteria for alcohol abuse or dependence. Between 4-6 million Americans are dependent upon illegal drugs.
* Rates of substance abuse among men ages 18-44 are double those of the general population.
* A family history of addictive problems is one of the best predictors of risk for addiction. Peer influence is another significant risk factor.
* According to a research review in the Oxford Textbook, rates of depression are significantly higher among people with addictions than in the general population, with indications that people are using the addictive activities to medicate themselves for the pain of depression.
* Addictions are also most common among individuals with attention deficits and hyperactivity problems and appear to be related to sensation-seeking among those needing stimulation.
Even if we assume that traders do not have more frequent addictive behaviors than the general population, the statistics tell us that, in all likelihood, nearly one trader in every ten has a diagnosable addictive problem.
For the trader with attention deficits who cannot tolerate boredom or lack of stimulation, trading provides action.
For the trader who is depressed, trading can provide an escape from the self and a sense of immediate gratification.
Such traders need to trade and keep trading when they have no edge whatsoever.
They lose their money, generate failure experiences for themselves, and create hardships for their families.
For them, it's not about "discipline" and following trading rules. It's about getting their lives back. And getting the right kind of help. If you see any aspect of yourself in this portrait, do the right thing. For you, and also for those who love you. Trading should expand your control and self-mastery, not become an instrument for its destruction.
Tuesday, October 31, 2006
Finding Your Performance Niche
 I'm pleased to report that my new book is now shipping and is available at discount via Amazon. Here's an excerpt that introduces the notion of the performance niche.
 My review of expert performers in such fields as chess, military, athletics, and performing arts--as well as my research review of exemplary performers--suggests that success is not simply a function of qualities of the individual. Rather, it is the fit between the talents (inborn abilities), skills (acquired competencies), interests, and opportunities afforded by a field that creates accelerated development and eventual mastery.
What does this mean for trading?
It means that success will not be found in better indicators, improved self-help techniques, or any of the endless parade of chart patterns, wave formations, numerology schemes, or moving average arrays.
Rather, success is achieved when we find markets and styles of trading that take maximum advantage of our skills and talents. That keeps us focused on markets and absorbed in them, enabling us--over time--to internalize their patterns.
Many, many times, traders do not live up to their potential simply because they are trading markets and methods that do not draw upon their strengths. Without that fit, they are not absorbed in what they do; frustration replaces focus and learning suffers.
If my book accomplishes nothing else, I hope that it assists you in thinking about where your niche might lie, not just in trading, but in life. The days pass by quickly; life is too short to waste on anything that you're not passionate about and good at.
My thanks to the many readers and traders who contributed directly and indirectly to the ideas in the book. You have been a source of insight as well as inspiration.
Morning With the Doc - 10/31/06
11:24 AM CT - That TICK distribution has taken a negative turn, and we're testing yesterday lows in ES. Note that we are not making lows in the other major indices. It would take a drying up of selling to have me testing the upside here, however. The weak dollar and falling rates are not signs of economic robustness and macro traders obviously did not step up to the plate and buy this AM after the numbers came out. While I keep the longer-term research in mind, it will take a pronounced upward shift in TICK and participation lifting offers by large traders to have me buying again today. It's not an exciting way to trade, but over the years it's preserved capital for me. Thanks for the interest; I'll do another morning session later in November.
10:53 AM CT - Well, that's where stops come in handy. It's disappointing to scratch a couple of promising trades, but I don't know of any way to pursue the large gains without risking some of those profits in hand. But when we saw fresh selling drive the Russells and TICK down, that was the cue that we could not sustain the uptrend. Tonight I'll review my decision making and probably kick myself for not more proactively recognizing that we were in a rangebound market oscillating around that average price. That would have allowed for taking of profits as we traded above 1383 and stalled out. I've been trading since the late 1970s and continue to learn, continue to make mistakes, continue to search and re-search patterns. My longer term picture remains intact, but we'll need more participation to the upside to make that happen. Volume really tailed off as the morning wore on, and we could see some rangebound and slow trade ahead of economic numbers later in the week. Have a great one.
10:36 AM CT - Trade has slowed down and we're seeing those runs up and down initiated by the locals. I will not add to positions in that environment, but so far I'll need more concerted selling to take me out of the positions. The TICK distribution for today continues to look favorable relative to the last two days and note that, so far, we've held above yesterday's lows. Still, the 1383.25 average price is acting as a magnet on prices and we'll need volume to vault us to new value areas. I hope today's session has shown you a bit about money management, framing trade ideas, framing when to stay in trades vs. pull out, and how to coordinate a longer-term perspective with a shorter one. Arguably, I've gotten too caught up in the big picture today and missed some short-term trades. My hope is that you can learn from my mistakes as well as my wins. Have a great rest of the day.
10:25 AM CT - I have not added to positions on this pullback, as stocks in the basket have been weak and NQ is looking heavy. I could get stopped out at breakeven here, and that would just put me back in the mode of assessing the market, developing new ideas, etc. Back in a few.
10:05 AM CT - Stocks in the basket still look OK; a few making 5 min lows here. As long as those TICK pullbacks are shallow and occur at higher price levels, they are candidates to add to positions. But if we get aggressive selling (hitting of bids with size) and very negative TICK, that's a different matter altogether. I'll update at least once more before calling it a morning.
9:58 AM CT - Stops raised to breakeven. No sense letting good trades turn into losers. All part of the money mgt. I added the Russells because of the positive shift in the TICK distribution. Russells correlate about .78 with TICK. I keep all sorts of stats like that in my head to aid decision making. I might be a piggy here, but I think we have a shot to break the day's morning highs and get a flurry of buying as a result. So I'm holding on here and not taking profits. If I do take profits, I'll take off one unit at a time when TICK gets extended and if stocks in the basket aren't doing a good job making new highs.
9:50 AM CT - Added Russells to the position. Tight stop 772.2.
9:45 AM CT - Note the strength in energy issues. Why? Weak dollar: oil is dominated in dollars. Ditto gold. Not good, not good for the longer run, even though the big traders are lifting offers and the TICK has shifted dramatically upward. I've raised my stop to the day's lows (note that I'm giving this trade plenty of room to breathe, as it's designed to be held overnite) and will add to positions when selling bouts fail to take us to new lows. In a nice trending market (which this isn't so far!!), retracements of the TICK back toward zero (or modestly negative) make good candidates for entries. I'll see how we hold up in price on the next such retracement before adding to the position, quite possibly with Russells.
9:40 AM CT - I'm not gonna lie. Having my initial position go under didn't bother me particularly. Seeing the dollar tanking and bond yields plummeting makes me really uneasy. That's traders anticipating recession, folks. We've gotten some nice buying, expansion of TICK, and stocks in the basket making fresh 5 min highs on a broad basis, returning the core position to breakeven. Now let's have sellers take their turn and see if we can hold at higher lows in TICK and price. That would get me adding to the position, but I still don't like that falling dollar.
9:28 AM CT - This is where money management is crucial. I took a small position with one unit of capital. I divide my trading capital into 4 units. If I'm wrong by buying (and my position *is* under water at this time), my losses won't be extreme. If the market is proving me right, I have plenty of opportunity to scale in. At present, it's not that we're seeing heavy selling so much as the absence of buying in the face of the weak economic numbers, rising bonds, etc. Declining issues only lead advancers by about 250 issues. But there's no way I'll add to the long position until the TICK distribution turns positive with readings over +800.
9:17 AM CT - I have a small core position long at this point and it's mainly playing for that edge over the next 5 days, as mentioned on the Weblog. As long as the TICK distribution stays more positive today than yesterday (and yesterday was stronger than Friday) and as long as we stay above yesterday's lows, I'll look for the Friday-Tuesday sequence as a transitional structure creating a market bottom. If we get fresh selling and extended negative TICK, I'll be stopped out. A few issues in the basket are perking up and showing new highs, but we need to see large traders lifting offers to confirm the long idea.
9:05 AM CT - Ok, we see signs of a bit of weakness, rates coming down, Euro strong against the dollar, some selling of stocks, but TICK holding up well. Basket of stocks making more 5 min lows than highs, large traders not hitting bids in force. I've been nibbling long as TICK went negative, but we need to stay above yesterday's lows to make this a longer term buy.
8:54 AM CT - Selling so far is modest in the TICK and volume continues strong. More than just locals in this market, and that usually leads to good movement. We're seeing some hitting of bids in Market Delta among large traders; that's kept me out of the long side. New 5 min lows in my basket have dominated new highs recently. The basket's weakness has kept me out of the long side as well. Patience, so far. Let's see how those numbers look and develop an idea from there.
8:41 AM CT - Remember that strong volume generally correlates with high volatility, so if our 5 minute volume readings stay high, I'd expect decent market movement this AM and today in general. I'm also tracking the net NYSE TICK, which has been positive so far; the volume at offer vs. bid in Market Delta (also positive so far); and the net new 5 min highs vs. lows in Trade Ideas (pretty even at this point). Note how the new highs/lows kept me from chasing the opening upmove. Staying out of bad trades is as important as making good ones. I'm flat and may well stay that way until the numbers come out; sellers taking their turn.
8:35 AM CT - Solid volume to open, particularly considering we're awaiting some numbers. We're seeing solid net lifting of offers among large traders, and that's showing up in a positive NYSE TICK and advancing stocks solidly leading decliners by over 600 issues. We've taken out yesterday's highs in NQ and Russell; so far the bullish bias is playing out. My basket of stocks is showing some issues making 5 min lows even as ES made its opening run, so I'm waiting for sellers to take their turn.
8:30 AM CT - Here's what I'm looking at on my screens: e-Signal tracks the NYSE TICK, TIKI, DAX, Russell, NASDAQ, and ES futures, along with sector ETFs. Trade-Ideas is tracking fresh five-minute highs and lows in my basket of stocks (see the Trader Performance page for details). Market Delta is tracking volume at the bid and offer and is alerting me to what large traders are doing. I also maintain a cumulative volume at price histogram on Market Delta that gives a rough reading of where our value area is at, a la Market Profile. That's it. The value area is approximately between 1381.75 and 1384.75. The big question for the open is whether we can get quick buying pressure to sustain us above that range, or whether we'll return toward the average price around 1383.25.
8:10 AM CT - Couple of quick announcements before the open. My new book, Enhancing Trader Performance, will be shipped in the next week. Initial comments from reviewers have been very positive; it's the first book I know of that tackles the issue of how traders can develop systematic programs of training for success. Also check out the Chicago Mercantile Exchange's free panel presentation on Peak Performance Electronic Trading this Thursday (11/2) at 2:30 PM CT, which I'll be part of. Registration is required; the session will be live at the Merc auditorium, but also Webcast for those unable to attend in person. I also want to offer a note of thanks to Brian Shannon, another trader devoted to the training of traders, for giving his blog readers a heads up on this morning's session. Brian's innovative use of video as a teaching tool, on his blog and in his online classes, is worth checking out. For other unique training tools, check out what Charles Kirk is quietly doing with the portion of his site devoted to members, in which he makes his trades, results, and trading journal available for readers. Also take note of what Howard Lindzon, Trader Mike, and others have put together in the video world with Wallstrip. Back after the open.
7:45 AM CT - The ECI report came in pretty much in line, and we're not seeing any radical moves in bonds, stocks, or the dollar as a result. Monday's average trading price was 1383 in the Dec. S&P emini futures, and we're trading above that level. Note that the Russell futures are closer to yesterday's highs than either the ES or NQ. With ES, we're looking at Monday highs of 1387 and lows of 1378.75. Given the bull bias of my research, my initial trading plan is to buy bouts of selling that hold above the Monday lows in anticipation of taking out Monday highs. A great setup would be to see early selling scare off bulls but hold above yesterday's lows, completing one of those transitional market structures spanning Friday through today. If that occurred, I would probably leave a piece on for a potential several-day move that would test the recent bull highs. My plan B kicks in if we get fresh selling pressure, perhaps as a result of those 9 AM CT economic reports. Fresh selling that breaks yesterday's lows with broad participation would target the cluster of daily lows we've seen in the 1369-1369.75 region and would flip me to the sell side. The important point here is that you rely on research for a leaning, but you don't get so wedded to that opinion that you ignore how the market is *actually* trading. I will start the morning flat. Back before the open.
7:00 AM CT - In my haste, I forgot to mention the Employment Cost Index report at 7:30 AM CT, which tracks the cost of labor. A very strong figure would be taken as inflationary and would likely lead to a jump in interest rates and pressure on the Fed to tighten monetary conditions. With economic reports before the open, I like to note the high-low range of the overnight market prior to the report and then the high-low range after the report until the open. That is a quick gauge of whether the report has fundamentally altered market participants' estimates of value. If the news is truly news, we should see a considerable adjustment in the bonds and currencies.
6:50 AM CT - Good morning and welcome to the Halloween AM session, in which we'll track markets and take a look at decision support for traders. Here are three reading assignments prior to the market open: 1) Take a look at my latest Trader Performance page entry in which I explain how I track intraday new highs and new lows with my basket of 17 stocks. I'll be referring to this during our AM session; 2) Note the research reported on the Trading Psychology Weblog. This is one reason I have moderately bullish expectations over the next several trading sessions; and 3) Check out the excellent Briefing website and click on their economic calendar, and then click on the economic reports due out today. At 9 AM CT, we'll have consumer confidence and Chicago PMI. The markets will be looking for signs of economic strength to see if we might get future rate hikes and interest rate firmness. Keep an eye on bond yields and the dollar when those numbers come out. If we get major moves in those markets, the odds are greatly enhanced that we'll see a trending move in equities, as markets price in fundamental, new information. All things being equal, we've been seeing sustained strength across a broad range of sectors and that normally leads to upside follow through in the near-to-intermediate term. But this is Halloween, and we could get some tricks along with promised treats. Back before the open.
10:53 AM CT - Well, that's where stops come in handy. It's disappointing to scratch a couple of promising trades, but I don't know of any way to pursue the large gains without risking some of those profits in hand. But when we saw fresh selling drive the Russells and TICK down, that was the cue that we could not sustain the uptrend. Tonight I'll review my decision making and probably kick myself for not more proactively recognizing that we were in a rangebound market oscillating around that average price. That would have allowed for taking of profits as we traded above 1383 and stalled out. I've been trading since the late 1970s and continue to learn, continue to make mistakes, continue to search and re-search patterns. My longer term picture remains intact, but we'll need more participation to the upside to make that happen. Volume really tailed off as the morning wore on, and we could see some rangebound and slow trade ahead of economic numbers later in the week. Have a great one.
10:36 AM CT - Trade has slowed down and we're seeing those runs up and down initiated by the locals. I will not add to positions in that environment, but so far I'll need more concerted selling to take me out of the positions. The TICK distribution for today continues to look favorable relative to the last two days and note that, so far, we've held above yesterday's lows. Still, the 1383.25 average price is acting as a magnet on prices and we'll need volume to vault us to new value areas. I hope today's session has shown you a bit about money management, framing trade ideas, framing when to stay in trades vs. pull out, and how to coordinate a longer-term perspective with a shorter one. Arguably, I've gotten too caught up in the big picture today and missed some short-term trades. My hope is that you can learn from my mistakes as well as my wins. Have a great rest of the day.
10:25 AM CT - I have not added to positions on this pullback, as stocks in the basket have been weak and NQ is looking heavy. I could get stopped out at breakeven here, and that would just put me back in the mode of assessing the market, developing new ideas, etc. Back in a few.
10:05 AM CT - Stocks in the basket still look OK; a few making 5 min lows here. As long as those TICK pullbacks are shallow and occur at higher price levels, they are candidates to add to positions. But if we get aggressive selling (hitting of bids with size) and very negative TICK, that's a different matter altogether. I'll update at least once more before calling it a morning.
9:58 AM CT - Stops raised to breakeven. No sense letting good trades turn into losers. All part of the money mgt. I added the Russells because of the positive shift in the TICK distribution. Russells correlate about .78 with TICK. I keep all sorts of stats like that in my head to aid decision making. I might be a piggy here, but I think we have a shot to break the day's morning highs and get a flurry of buying as a result. So I'm holding on here and not taking profits. If I do take profits, I'll take off one unit at a time when TICK gets extended and if stocks in the basket aren't doing a good job making new highs.
9:50 AM CT - Added Russells to the position. Tight stop 772.2.
9:45 AM CT - Note the strength in energy issues. Why? Weak dollar: oil is dominated in dollars. Ditto gold. Not good, not good for the longer run, even though the big traders are lifting offers and the TICK has shifted dramatically upward. I've raised my stop to the day's lows (note that I'm giving this trade plenty of room to breathe, as it's designed to be held overnite) and will add to positions when selling bouts fail to take us to new lows. In a nice trending market (which this isn't so far!!), retracements of the TICK back toward zero (or modestly negative) make good candidates for entries. I'll see how we hold up in price on the next such retracement before adding to the position, quite possibly with Russells.
9:40 AM CT - I'm not gonna lie. Having my initial position go under didn't bother me particularly. Seeing the dollar tanking and bond yields plummeting makes me really uneasy. That's traders anticipating recession, folks. We've gotten some nice buying, expansion of TICK, and stocks in the basket making fresh 5 min highs on a broad basis, returning the core position to breakeven. Now let's have sellers take their turn and see if we can hold at higher lows in TICK and price. That would get me adding to the position, but I still don't like that falling dollar.
9:28 AM CT - This is where money management is crucial. I took a small position with one unit of capital. I divide my trading capital into 4 units. If I'm wrong by buying (and my position *is* under water at this time), my losses won't be extreme. If the market is proving me right, I have plenty of opportunity to scale in. At present, it's not that we're seeing heavy selling so much as the absence of buying in the face of the weak economic numbers, rising bonds, etc. Declining issues only lead advancers by about 250 issues. But there's no way I'll add to the long position until the TICK distribution turns positive with readings over +800.
9:17 AM CT - I have a small core position long at this point and it's mainly playing for that edge over the next 5 days, as mentioned on the Weblog. As long as the TICK distribution stays more positive today than yesterday (and yesterday was stronger than Friday) and as long as we stay above yesterday's lows, I'll look for the Friday-Tuesday sequence as a transitional structure creating a market bottom. If we get fresh selling and extended negative TICK, I'll be stopped out. A few issues in the basket are perking up and showing new highs, but we need to see large traders lifting offers to confirm the long idea.
9:05 AM CT - Ok, we see signs of a bit of weakness, rates coming down, Euro strong against the dollar, some selling of stocks, but TICK holding up well. Basket of stocks making more 5 min lows than highs, large traders not hitting bids in force. I've been nibbling long as TICK went negative, but we need to stay above yesterday's lows to make this a longer term buy.
8:54 AM CT - Selling so far is modest in the TICK and volume continues strong. More than just locals in this market, and that usually leads to good movement. We're seeing some hitting of bids in Market Delta among large traders; that's kept me out of the long side. New 5 min lows in my basket have dominated new highs recently. The basket's weakness has kept me out of the long side as well. Patience, so far. Let's see how those numbers look and develop an idea from there.
8:41 AM CT - Remember that strong volume generally correlates with high volatility, so if our 5 minute volume readings stay high, I'd expect decent market movement this AM and today in general. I'm also tracking the net NYSE TICK, which has been positive so far; the volume at offer vs. bid in Market Delta (also positive so far); and the net new 5 min highs vs. lows in Trade Ideas (pretty even at this point). Note how the new highs/lows kept me from chasing the opening upmove. Staying out of bad trades is as important as making good ones. I'm flat and may well stay that way until the numbers come out; sellers taking their turn.
8:35 AM CT - Solid volume to open, particularly considering we're awaiting some numbers. We're seeing solid net lifting of offers among large traders, and that's showing up in a positive NYSE TICK and advancing stocks solidly leading decliners by over 600 issues. We've taken out yesterday's highs in NQ and Russell; so far the bullish bias is playing out. My basket of stocks is showing some issues making 5 min lows even as ES made its opening run, so I'm waiting for sellers to take their turn.
8:30 AM CT - Here's what I'm looking at on my screens: e-Signal tracks the NYSE TICK, TIKI, DAX, Russell, NASDAQ, and ES futures, along with sector ETFs. Trade-Ideas is tracking fresh five-minute highs and lows in my basket of stocks (see the Trader Performance page for details). Market Delta is tracking volume at the bid and offer and is alerting me to what large traders are doing. I also maintain a cumulative volume at price histogram on Market Delta that gives a rough reading of where our value area is at, a la Market Profile. That's it. The value area is approximately between 1381.75 and 1384.75. The big question for the open is whether we can get quick buying pressure to sustain us above that range, or whether we'll return toward the average price around 1383.25.
8:10 AM CT - Couple of quick announcements before the open. My new book, Enhancing Trader Performance, will be shipped in the next week. Initial comments from reviewers have been very positive; it's the first book I know of that tackles the issue of how traders can develop systematic programs of training for success. Also check out the Chicago Mercantile Exchange's free panel presentation on Peak Performance Electronic Trading this Thursday (11/2) at 2:30 PM CT, which I'll be part of. Registration is required; the session will be live at the Merc auditorium, but also Webcast for those unable to attend in person. I also want to offer a note of thanks to Brian Shannon, another trader devoted to the training of traders, for giving his blog readers a heads up on this morning's session. Brian's innovative use of video as a teaching tool, on his blog and in his online classes, is worth checking out. For other unique training tools, check out what Charles Kirk is quietly doing with the portion of his site devoted to members, in which he makes his trades, results, and trading journal available for readers. Also take note of what Howard Lindzon, Trader Mike, and others have put together in the video world with Wallstrip. Back after the open.
7:45 AM CT - The ECI report came in pretty much in line, and we're not seeing any radical moves in bonds, stocks, or the dollar as a result. Monday's average trading price was 1383 in the Dec. S&P emini futures, and we're trading above that level. Note that the Russell futures are closer to yesterday's highs than either the ES or NQ. With ES, we're looking at Monday highs of 1387 and lows of 1378.75. Given the bull bias of my research, my initial trading plan is to buy bouts of selling that hold above the Monday lows in anticipation of taking out Monday highs. A great setup would be to see early selling scare off bulls but hold above yesterday's lows, completing one of those transitional market structures spanning Friday through today. If that occurred, I would probably leave a piece on for a potential several-day move that would test the recent bull highs. My plan B kicks in if we get fresh selling pressure, perhaps as a result of those 9 AM CT economic reports. Fresh selling that breaks yesterday's lows with broad participation would target the cluster of daily lows we've seen in the 1369-1369.75 region and would flip me to the sell side. The important point here is that you rely on research for a leaning, but you don't get so wedded to that opinion that you ignore how the market is *actually* trading. I will start the morning flat. Back before the open.
7:00 AM CT - In my haste, I forgot to mention the Employment Cost Index report at 7:30 AM CT, which tracks the cost of labor. A very strong figure would be taken as inflationary and would likely lead to a jump in interest rates and pressure on the Fed to tighten monetary conditions. With economic reports before the open, I like to note the high-low range of the overnight market prior to the report and then the high-low range after the report until the open. That is a quick gauge of whether the report has fundamentally altered market participants' estimates of value. If the news is truly news, we should see a considerable adjustment in the bonds and currencies.
6:50 AM CT - Good morning and welcome to the Halloween AM session, in which we'll track markets and take a look at decision support for traders. Here are three reading assignments prior to the market open: 1) Take a look at my latest Trader Performance page entry in which I explain how I track intraday new highs and new lows with my basket of 17 stocks. I'll be referring to this during our AM session; 2) Note the research reported on the Trading Psychology Weblog. This is one reason I have moderately bullish expectations over the next several trading sessions; and 3) Check out the excellent Briefing website and click on their economic calendar, and then click on the economic reports due out today. At 9 AM CT, we'll have consumer confidence and Chicago PMI. The markets will be looking for signs of economic strength to see if we might get future rate hikes and interest rate firmness. Keep an eye on bond yields and the dollar when those numbers come out. If we get major moves in those markets, the odds are greatly enhanced that we'll see a trending move in equities, as markets price in fundamental, new information. All things being equal, we've been seeing sustained strength across a broad range of sectors and that normally leads to upside follow through in the near-to-intermediate term. But this is Halloween, and we could get some tricks along with promised treats. Back before the open.
Anecdotal Reasoning Yields Anecdotal Profits
 I recently encountered a market analysis that drew a parallel between the March-May runup in stock prices and the recent August-October rise. The implication was that we were due for a significant correction, as we had beginning in May.
 This kind of anecdotal reasoning which, in essence, says, "This market looks like this, so it should do that" has little place in the playbooks of serious traders. Because a chart or oscillator has a particular shape doesn't necessarily reflect supply and demand in the marketplace. This is why such superficial measures of the market fare so poorly when they are put to the test. Indeed, of over 6000 common patterns in the S&P 500 market analyzed by David Aronson in his excellent text "Evidence-Based Technical Analysis", none led to statistically significant profits.
One reason that the August-October runup is different from its predecessor is that far more stocks have participated throughout the move. Above we see a chart of the number of stocks making new 65-day highs minus new 65-day lows (blue line) vs. the S&P 500 (SPY; red line). As the market moved higher from March-May, the net number of stocks making new highs was dwindling. As the market has moved higher from August-October, we've seen expanding net new highs.
Why is this important?
Since 2004, we've only had 24 occasions in which we've had 1250 or more new 65-day highs on a given day. This most recently occurred on Thursday, when we had 1450 new highs across the major stock exchanges. Twenty days after such occasions, SPY has been up by an average of 1.01% (21 up, 3 down), much stronger than the average 20-day gain of .56% (433 up, 260 down) for the entire sample.
Anecdotal reasoning may tell us that we're due for a significant correction, but my previous research, as well as these findings, just don't bear that out. How we make new highs is crucial to whether or not those new highs are sustained and extended. Another way of saying this is that the trajectory of a market move matters as much as the trend.
There are plenty of market gurus who offer trading advice based on anecdotal reasoning. Their promises and claims of success are equally anecdotal. Trading with a knowledge of market history is hardly infallible, but it beats the alternative: trading in ignorance of history.
Later this AM, we'll commence the Morning With the Doc and track the market in real time. Also, please be my guest at the free panel discussion I'll be participating in on Thursday, November 2nd at the Chicago Mercantile Exchange. It will also be Webcast; should be fun. Thanks for all your interest in the blog, as well as your insightful comments.
Monday, October 30, 2006
What Traders Most Need
Rarely does a week go by without my receiving a solicitation to provide online "education" for traders. My response is generally the same:
Traders don't need education. What traders most need is training.
Look at all the websites, blogs, and books devoted to trading. If success were a function of education, surely we'd see a helluva lot more profitable traders.
No, giving a struggling trader blog columns and newsletter articles is like giving a starving man a menu.
That's not to say that education is unimportant. Look at successful training programs--in medicine, music academies, the military, sports--and you'll see evidence of hands-on teaching. But no one pretends that you will make a surgeon, violinist, fighter pilot, or quarterback by conducting seminars and providing written material.
Training builds upon education by providing structured opportunities to learn by doing. The psychotherapist in training sees role-played clients--and then real ones--while being observed by a mentor/supervisor. The surgeon trains with a senior physician: see one, do one, teach one is the motto. A violinist is assigned pieces by a teacher and executes these many times in practice and in lessons before performing at recital. New fighter pilots spend many hours in simulated aircraft and then in the cockpit with an experienced pilot before being given their own jet. The quarterback not only sees plays diagrammed, but runs these time and time again in practice under the watchful eye of the coach prior to using those plays in a game.
Trading, like those other fields, is a performance skill--not merely a body of knowledge. Education informs; training develops skill. If skill were a matter of explicit knowledge and learning, the most informed athlete or trader would also be the best one; we could give IQ tests and predict performance.
In the near future, building upon the release of my book on trading performance, I will be incorporating more training features into this blog and and into my personal site. The morning sessions with the Doc (the next scheduled for tomorrow) are but the first step. Intensive daily review of trading patterns/setups to train your eye for opportunity are another step.
Ultimately, however, what traders most need is to be observed--in real time--as they trade, with immediate feedback and instruction. That's the training doctors, athletes, and pilots get. How to provide such training economically is a thorny logistical problem I'm working on. It's a lot easier to write articles and offer seminars and pretend that those, by themselves, will enhance trader performance. But the success rate among new traders bears eloquent witness to the limitations of such a strategy.
Traders don't need education. What traders most need is training.
Look at all the websites, blogs, and books devoted to trading. If success were a function of education, surely we'd see a helluva lot more profitable traders.
No, giving a struggling trader blog columns and newsletter articles is like giving a starving man a menu.
That's not to say that education is unimportant. Look at successful training programs--in medicine, music academies, the military, sports--and you'll see evidence of hands-on teaching. But no one pretends that you will make a surgeon, violinist, fighter pilot, or quarterback by conducting seminars and providing written material.
Training builds upon education by providing structured opportunities to learn by doing. The psychotherapist in training sees role-played clients--and then real ones--while being observed by a mentor/supervisor. The surgeon trains with a senior physician: see one, do one, teach one is the motto. A violinist is assigned pieces by a teacher and executes these many times in practice and in lessons before performing at recital. New fighter pilots spend many hours in simulated aircraft and then in the cockpit with an experienced pilot before being given their own jet. The quarterback not only sees plays diagrammed, but runs these time and time again in practice under the watchful eye of the coach prior to using those plays in a game.
Trading, like those other fields, is a performance skill--not merely a body of knowledge. Education informs; training develops skill. If skill were a matter of explicit knowledge and learning, the most informed athlete or trader would also be the best one; we could give IQ tests and predict performance.
In the near future, building upon the release of my book on trading performance, I will be incorporating more training features into this blog and and into my personal site. The morning sessions with the Doc (the next scheduled for tomorrow) are but the first step. Intensive daily review of trading patterns/setups to train your eye for opportunity are another step.
Ultimately, however, what traders most need is to be observed--in real time--as they trade, with immediate feedback and instruction. That's the training doctors, athletes, and pilots get. How to provide such training economically is a thorny logistical problem I'm working on. It's a lot easier to write articles and offer seminars and pretend that those, by themselves, will enhance trader performance. But the success rate among new traders bears eloquent witness to the limitations of such a strategy.
Sunday, October 29, 2006
The Four Legs of Market Psychology
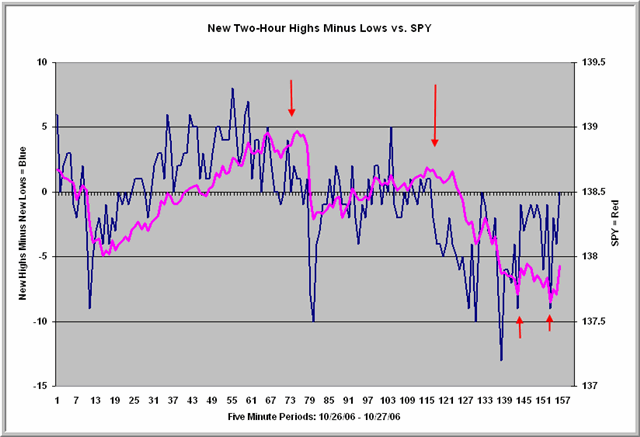
We can think of the short-term psychology of equity index markets as standing on four legs: price, volume, sentiment, and participation. I will be discussing these in real time during Tuesday's Halloween Morning With the Doc.
The distribution of volume at various prices, captured by the Market Profile, tells us whether demand or supply are expanding as we move further away from value. This helps us handicap the odds of breakout vs. retracement as we near the edges of ranges.
Sentiment, on the short-term basis, is captured two ways: by tracking the volume at the bid vs. offer, especially among large traders; and by following the number of stocks trading at the bid vs. offer, reflected by the NYSE TICK.
Participation is a measurement of the number of stocks participating in a general market move. As I recently posted, gauging the number of stocks making new highs vs. new lows on a market move provides useful information about whether that move is likely to continue or reverse.
These four variables are worth tracking across multiple time frames. Together, they provide a reading of the market's psychology.
Above, I've taken the new highs/new lows from my basket of stocks, but now am applying the data to 5 minute closing values rather than daily data. We're looking at the number of stocks making two-hour highs minus those making two-hour lows over a two day period.
Observe the divergences marked by the arrows. It is very common that, when the S&P 500 Index (SPY) makes new highs and we get an expansion in the number of issues making new highs, that upmove will continue. Conversely, when we see divergences such as those marked, we commonly encounter retracement of those upmoves.
A more complete analysis, drawing on all four legs of market psychology, would show you that, as you were above value in the market near 139 in SPY, volume was decreasing, the proportion of volume at the market offer was decreasing, the average NYSE TICK was waning, and fewer stocks were participating in the average's new highs.
Much of what constitutes skill in the markets is recognizing in real time when these four variables are acting in concert and making decisions accordingly. Ultimately, what all successful traders are doing is tracking shifts in supply and demand. The four legs of market psychology are simply tools to help traders conceptualize such shifts.
Saturday, October 28, 2006
Can There Be An Objective Basis For Subjective Knowledge?
In my recent post, I cited Ayn Rand's assertion that philosophy is the most practical of disciplines. This is particularly true with respect to epistemology, that branch of philosophy that deals with knowledge and its acquisition. What we count as truth ultimately determines how we pursue truth, whether in markets, science, or politics.
Ms. Rand also stressed that contradictions cannot exist in reality. Where we find a contradiction, she advised, check your premises. At least one of them will be incorrect.
The positivism expressed by David Aronson's fine book Evidence-Base Technical Analysis yields just such a contradiction. Before I launch into the contradiction and a possible resolution, allow me to mention (on an unsolicited basis!) that Aronson's book is a substantial contribution to the literature on technical analysis. One need not agree with his strident formulation that the discretionary application of technical analysis does not draw upon "a legitimate body of knowledge but a collection of folklore resting on a flimsy foundation of anecdote and intuition" (p. 261) to benefit from the reading of his work.
Specifically, Aronson has accomplished four worthy ends:
1) He clearly explains the importance of testing trading ideas and illustrates how that is done;
2) He describes both the strengths and potential weaknesses of data mining approaches;
3) He tests specific technical trading patterns and demonstrates how difficult it is to obtain statistically significant findings (and how easy it is to generate illusory ones);
4) He reviews major theories and research findings in behavioral finance to help traders begin the process of finding more promising patterns.
For a book that deals with technical themes of logic and mathematics, his work is eminently readable and understandable. I would rate it alongside Kenneth Grant's "Trading Risk" as a must read for developing traders.
That having been said, I believe Aronson's positivist roots--leading him to equate knowledge with declarative statements known to be true--create a Randian contradiction. If all knowledge consists of verifiable statements about observables, then Wittgenstein is correct in his formulation: Whereof we cannot speak, thereof we must be silent. Subjective knowledge must be an oxymoron.
But here is the contradiction: It is common--certainly in my visits to proprietary trading firms, hedge funds, and investment banks--to find discretionary traders who have achieved a high level of trading success year after year, trading actively. Indeed, I wrote about just such an individual in my new book on trader performance. These are not mere anonymous figures on bulletin boards puffing up their performance stats. These are traders who have account statements and risk managers able to verify their superior performance. And yet they cannot verbalize specific rules or systems for their trading.
In short, they have knowledge, but it is not of the verbal, declarative kind.
The existence of such implicit learning has been known in cognitive neuroscience circles for decades. Philosopher Michael Polanyi offered an influential treatise on tacit forms of knowledge, and Arthur Reber began his groundbreaking studies in the 1960s, culminating in his 1993 text "Implicit Learning and Tacit Knowledge". More recently, Timothy Curran, in the "Handbook of Implicit Learning" summarized research that found different brain mechanisms mediating implicit learning and explicit, verbal knowing.
How does implicit learning occur? Through intensive repetition, in which individuals become sensitive to complex and noisy patterns. This is how young children learn to speak grammatical English before they can verbalize the rules of English grammar. It's also how we can identify a face that we could never adequately describe in words, and it's how we know when such a face is starting to display anger or sadness. Serial reaction time experiments show that subjects can learn complex statistical probabilities in sequences of data with enough repetition and feedback. Interestingly, they can anticipate events in those sequences, but cannot verbalize the complex patterns that they have internalized. (The research of Axel Cleeremans is particularly eloquent on this point).
Such subjective knowledge is not "devoid of information" as positivist philosophy would have it. There are, of course, intutions that prove to be invalid, but reducing all knowledge to testable hypotheses would probably eliminate most of the knowledge and understanding that lies behind great art, as well as most performance fields such as athletics. The deep knowing of musicians, chess players, and fighter pilots can hardly be reduced to sets of explicit propositions.
If we admit the possibility of such subjective knowledge, then it follows that the development of algorithmic systems with fully backtested rules is not the only way to achieve trading success. It may be possible to generate success by accelerating processes of implicit learning through the use of simulation/replay and intensive feedback. Ironically, the weakness of much technical analysis is not that it is subjective, but that it pretends to an objectivity that it cannot support.
Can there ever be an objective basis for subjective knowledge? I believe so. A trader's track record of profit/loss can be compared to random entries/exits (as well as buy and hold) to objectively determine whether or not that trader--over time--exhibits significant skill. Imagine a Monte Carlo simulation in which we create random entries and exits each day that a trader trades, with identical trading frequency and holding times. Suppose that such a simulation is conducted 10,000 times by computer. The resulting distribution of P/L would display the likelihood of achieving a given level of profitability by chance alone. If a trader's subjective trading methods consistently produce results at the very upper tail of that distribution, we can objectively infer that the subjective trader is skilled.
In other words, by treating each trader as a trading system, we can evaluate that trader's level of knowledge, regardless of whether the knowledge is subjective or objective. In the absence of such score-keeping, discretionary traders have no basis for a belief that they possess a true edge in the marketplace. One need not resort to positivism--or system-based trading--to be rigorously scientific. It is precisely because intuitions are fallible and human senses are so easily deceived that we need to distinguish truly superior outcomes from merely random ones.
Ms. Rand also stressed that contradictions cannot exist in reality. Where we find a contradiction, she advised, check your premises. At least one of them will be incorrect.
The positivism expressed by David Aronson's fine book Evidence-Base Technical Analysis yields just such a contradiction. Before I launch into the contradiction and a possible resolution, allow me to mention (on an unsolicited basis!) that Aronson's book is a substantial contribution to the literature on technical analysis. One need not agree with his strident formulation that the discretionary application of technical analysis does not draw upon "a legitimate body of knowledge but a collection of folklore resting on a flimsy foundation of anecdote and intuition" (p. 261) to benefit from the reading of his work.
Specifically, Aronson has accomplished four worthy ends:
1) He clearly explains the importance of testing trading ideas and illustrates how that is done;
2) He describes both the strengths and potential weaknesses of data mining approaches;
3) He tests specific technical trading patterns and demonstrates how difficult it is to obtain statistically significant findings (and how easy it is to generate illusory ones);
4) He reviews major theories and research findings in behavioral finance to help traders begin the process of finding more promising patterns.
For a book that deals with technical themes of logic and mathematics, his work is eminently readable and understandable. I would rate it alongside Kenneth Grant's "Trading Risk" as a must read for developing traders.
That having been said, I believe Aronson's positivist roots--leading him to equate knowledge with declarative statements known to be true--create a Randian contradiction. If all knowledge consists of verifiable statements about observables, then Wittgenstein is correct in his formulation: Whereof we cannot speak, thereof we must be silent. Subjective knowledge must be an oxymoron.
But here is the contradiction: It is common--certainly in my visits to proprietary trading firms, hedge funds, and investment banks--to find discretionary traders who have achieved a high level of trading success year after year, trading actively. Indeed, I wrote about just such an individual in my new book on trader performance. These are not mere anonymous figures on bulletin boards puffing up their performance stats. These are traders who have account statements and risk managers able to verify their superior performance. And yet they cannot verbalize specific rules or systems for their trading.
In short, they have knowledge, but it is not of the verbal, declarative kind.
The existence of such implicit learning has been known in cognitive neuroscience circles for decades. Philosopher Michael Polanyi offered an influential treatise on tacit forms of knowledge, and Arthur Reber began his groundbreaking studies in the 1960s, culminating in his 1993 text "Implicit Learning and Tacit Knowledge". More recently, Timothy Curran, in the "Handbook of Implicit Learning" summarized research that found different brain mechanisms mediating implicit learning and explicit, verbal knowing.
How does implicit learning occur? Through intensive repetition, in which individuals become sensitive to complex and noisy patterns. This is how young children learn to speak grammatical English before they can verbalize the rules of English grammar. It's also how we can identify a face that we could never adequately describe in words, and it's how we know when such a face is starting to display anger or sadness. Serial reaction time experiments show that subjects can learn complex statistical probabilities in sequences of data with enough repetition and feedback. Interestingly, they can anticipate events in those sequences, but cannot verbalize the complex patterns that they have internalized. (The research of Axel Cleeremans is particularly eloquent on this point).
Such subjective knowledge is not "devoid of information" as positivist philosophy would have it. There are, of course, intutions that prove to be invalid, but reducing all knowledge to testable hypotheses would probably eliminate most of the knowledge and understanding that lies behind great art, as well as most performance fields such as athletics. The deep knowing of musicians, chess players, and fighter pilots can hardly be reduced to sets of explicit propositions.
If we admit the possibility of such subjective knowledge, then it follows that the development of algorithmic systems with fully backtested rules is not the only way to achieve trading success. It may be possible to generate success by accelerating processes of implicit learning through the use of simulation/replay and intensive feedback. Ironically, the weakness of much technical analysis is not that it is subjective, but that it pretends to an objectivity that it cannot support.
Can there ever be an objective basis for subjective knowledge? I believe so. A trader's track record of profit/loss can be compared to random entries/exits (as well as buy and hold) to objectively determine whether or not that trader--over time--exhibits significant skill. Imagine a Monte Carlo simulation in which we create random entries and exits each day that a trader trades, with identical trading frequency and holding times. Suppose that such a simulation is conducted 10,000 times by computer. The resulting distribution of P/L would display the likelihood of achieving a given level of profitability by chance alone. If a trader's subjective trading methods consistently produce results at the very upper tail of that distribution, we can objectively infer that the subjective trader is skilled.
In other words, by treating each trader as a trading system, we can evaluate that trader's level of knowledge, regardless of whether the knowledge is subjective or objective. In the absence of such score-keeping, discretionary traders have no basis for a belief that they possess a true edge in the marketplace. One need not resort to positivism--or system-based trading--to be rigorously scientific. It is precisely because intuitions are fallible and human senses are so easily deceived that we need to distinguish truly superior outcomes from merely random ones.
Friday, October 27, 2006
When Markets Don't Correct, Are We Due For A Correction?
The most recent post on evidence-based trading emphasized the importance of our knowing what we know.
This was illustrated for me quite recently when I read that we were due for a meaningful correction because we hadn't had one for a while.
Let's see if that reasoning is valid.
It turns out that we haven't seen a daily 1% or greater decline in the cash S&P 500 Index ($SPX) in over 60 trading sessions. Since 1990 (N = 4183 trading days), this has only occurred on 177 occasions. When we look at what happens 60 trading days later, it turns out that the S&P 500 Index is up by an average of 4.61% (153 up, 24 down), quite a bullish edge compared to the average 60-day change of 2.21% (2845 up, 1338 down). Over essentially every time frame leading up to 60 days, moreover, we see above average returns following from periods in which we haven't had a 1% daily correction.
In short, the absence of a drop does not make a fall more likely. Indeed, it has led to superior returns over the intermediate term.
Why is this? The majority of periods when we haven't had a large drop are periods in which we haven't had large moves of *any* kind. These have been low volatility periods in the market, from 1993-1995. Recall from the recent post that low volatility periods have actually shown superior returns over the intermediate term.
Are we overdue for a drop? Yes. We don't typically have runs of no 1% declines for months at a time. Does that mean the market is headed lower? Not at all. Only six of the 177 periods in which we have not had a 1% drop led to a decline of 2% or more in the following 60 trading sessions.
It helps to know what we know: that's the appeal of an evidence-based approach. Tomorrow we'll explore the limitations of the approach.
This was illustrated for me quite recently when I read that we were due for a meaningful correction because we hadn't had one for a while.
Let's see if that reasoning is valid.
It turns out that we haven't seen a daily 1% or greater decline in the cash S&P 500 Index ($SPX) in over 60 trading sessions. Since 1990 (N = 4183 trading days), this has only occurred on 177 occasions. When we look at what happens 60 trading days later, it turns out that the S&P 500 Index is up by an average of 4.61% (153 up, 24 down), quite a bullish edge compared to the average 60-day change of 2.21% (2845 up, 1338 down). Over essentially every time frame leading up to 60 days, moreover, we see above average returns following from periods in which we haven't had a 1% daily correction.
In short, the absence of a drop does not make a fall more likely. Indeed, it has led to superior returns over the intermediate term.
Why is this? The majority of periods when we haven't had a large drop are periods in which we haven't had large moves of *any* kind. These have been low volatility periods in the market, from 1993-1995. Recall from the recent post that low volatility periods have actually shown superior returns over the intermediate term.
Are we overdue for a drop? Yes. We don't typically have runs of no 1% declines for months at a time. Does that mean the market is headed lower? Not at all. Only six of the 177 periods in which we have not had a 1% drop led to a decline of 2% or more in the following 60 trading sessions.
It helps to know what we know: that's the appeal of an evidence-based approach. Tomorrow we'll explore the limitations of the approach.
Evidence Based Trading: Why Philosophy Matters
The late Ayn Rand emphasized that philosophy was the most practical of disciplines: it governs the ideas that lie behind all we do and think. The philosophical premises we assume affect how we approach trading.
A beautiful example of this is David Aronson's new book, "Evidence-Based Technical Analysis". It's a well-written, thought-provoking text, with many practical examples of how to conduct data analysis in an objective way.
Starting with the premise that knowledge consists of statements that are found to be true, Aronson, writing in the positivist tradition of philosophy, excludes subjectivity as knowledge. He explains:
"The most important consequence of TA adopting the scientific method would be the elimination of subjective approaches. Because they are not testable, subjective methods are shielded from empirical challenge. This makes them worse than wrong. They are meaningless propositions devoid of information. Their elimination would make TA an entirely objective practice." p. 148
This is bound to rub many traders the wrong way, but it's an important challenge. What is knowledge? How do we know what we know in the markets? How can we demonstrate that knowledge is such, and not illusion?
Once we start with the premise that all knowledge consists of explicit propositions that can be tested for truth, we necessarily are led toward trading that is rule-based and rigorously backtested.
Is there another, *valid* form of knowledge and trading? Can we prove that? I'll be interested in readers' comments before I offer my own alternative in my next post.
A beautiful example of this is David Aronson's new book, "Evidence-Based Technical Analysis". It's a well-written, thought-provoking text, with many practical examples of how to conduct data analysis in an objective way.
Starting with the premise that knowledge consists of statements that are found to be true, Aronson, writing in the positivist tradition of philosophy, excludes subjectivity as knowledge. He explains:
"The most important consequence of TA adopting the scientific method would be the elimination of subjective approaches. Because they are not testable, subjective methods are shielded from empirical challenge. This makes them worse than wrong. They are meaningless propositions devoid of information. Their elimination would make TA an entirely objective practice." p. 148
This is bound to rub many traders the wrong way, but it's an important challenge. What is knowledge? How do we know what we know in the markets? How can we demonstrate that knowledge is such, and not illusion?
Once we start with the premise that all knowledge consists of explicit propositions that can be tested for truth, we necessarily are led toward trading that is rule-based and rigorously backtested.
Is there another, *valid* form of knowledge and trading? Can we prove that? I'll be interested in readers' comments before I offer my own alternative in my next post.
Thursday, October 26, 2006
An Effective Way to Track the Market
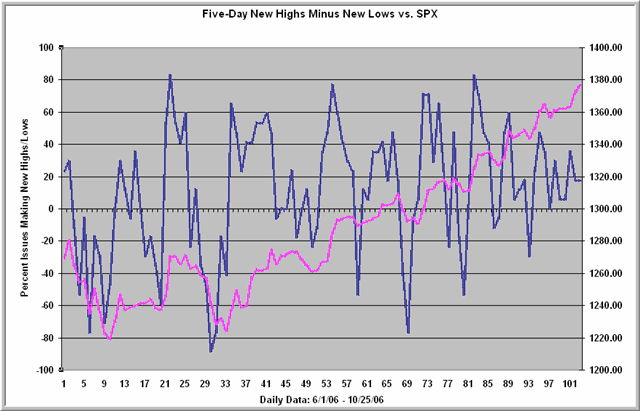
Many of my best market indicators track what individual stocks are doing to see if momentum and trending are spread out among issues or limited to a relative handful. It is difficult, however, to track a large number of stocks in real time to see how many are making new highs or new lows, how many are above their moving averages , etc. What to do?
One way around that limitation is to create a basket of stocks that closely track the stock index that you're trading. The basket that I currently use takes four stocks from each of four sectors (industrial/cyclical, consumer, financial, and technology), plus one stock that is an economically sensitive service firm. The basket, taken together, closely correlates with price changes in the S&P 500 Index. This is not surprising, because many of the stocks are highly weighted in the S&P and all are considered large caps. In my scheduled "Morning With the Doc" on October 31st, I will outline what these stocks are and how I use them intraday.
For now, notice on the chart how the percentage of stocks in my basket making new five day highs minus lows (blue line) tracks the $SPX. Dips below zero (meaning more stocks are making five-day lows than highs) have been good buying opportunities; price highs when new highs are below 50% have tended to correct in the short term; and price highs with many new highs have tended to move higher still.
Since 2004 (N = 705), when we've had a five-day high in the S&P 500 Index (N = 247) and more than 50% of the basket of stocks have made new highs (N = 76), the next five days in $SPX average a gain of .26% (44 up, 32 down). That is better than the average five-day gain of .15% for the entire sample. When fewer than 50% of the stocks are participating in the new highs, the average five day gain is only .01% (96 up, 75 down) and when fewer than 25% of stocks in the basket are making new highs when we have a new high in $SPX, the average five-day change is a loss of -.15% (40 up, 39 down).
In other words, we have yet another example of a momentum effect. What is important is not just if the index is making new highs, but if the new highs are broadly distributed. A small but well-constructed basket of stocks can be an effective way to track that.
Notice that recent new index highs have been on relatively weak new stock highs. That is a reason for caution right here. More on this worthwhile method in the session on the 31st.
Wednesday, October 25, 2006
Inside The Trader's Brain: Decision-Making and Emotional Arousal
For years, behavioral finance researchers have been aware that people's decision making is greatly affected by how choices are framed. For instance, the same monetary bet framed as a choice between a certain vs. risky gain and a certain vs. risky loss elicits very different choices. (We tend to take certain gains, but will seek risky losses to avoid certain loss). Studies using functional magnetic resonance imaging (fMRI) find that we expend less cognitive effort in taking a sure gain than in choosing risky gains, sure losses, or risky losses. It may well be that traders don't let their profits run simply because they take the easy way out cognitively. Conversely, traders may be reluctant to set and follow stops because of the greater cognitive effort required.
It turns out, however, that this taking the easy way out and avoiding difficult decisions may not be a function of laziness. A very interesting investigation coming out of the Institute of Neurology at University College London finds that the framing effect on decision making is mediated by an emotional center within the brain: the amygdala. This is the same brain center that cognitive neuroscientist Joseph LeDoux has linked to our response to stress and trauma.
The implications are significant. When blood flow is directed away from the brain's executive center, the frontal cortex, and the amygdala and associated emotional centers are activated, we are likely to underutilize those executive functions--reasoning, judgment, planning--and respond to our (emotional) framing of choices with a lack of effort. Going with our feelings might just be the reason we don't think through our choices.
It is also likely that we frame our choices differently during periods of focus/concentration vs. emotional arousal. Stressful episodes in the market, activating the amygdala, are likely to elicit a framing that is different from the careful trade planning we conduct when we are cool and calm. Research, for instance, finds that fear and anger color our decision making about preparing for terrorism-related risks. Emotional factors have also been found to color decision making about economic choices.
This helps to explain why I have found biofeedback to be extraordinarily helpful for traders who experience emotional disruptions of decision making. By working with traders in stressful situations and having them control their level of arousal during these episodes, biofeedback enables them to retain access to their executive capabilities. In a very important sense, successful traders train their brains for accurate decision-making under stressful circumstances.
Sometimes, looking back on our trading decisions, we wonder if we were in our right minds. How accurate that concern turns out to be! Some of the best trading psychology interventions are the ones that keep us in our right minds as we make decisions under conditions of risk and uncertainty.
It turns out, however, that this taking the easy way out and avoiding difficult decisions may not be a function of laziness. A very interesting investigation coming out of the Institute of Neurology at University College London finds that the framing effect on decision making is mediated by an emotional center within the brain: the amygdala. This is the same brain center that cognitive neuroscientist Joseph LeDoux has linked to our response to stress and trauma.
The implications are significant. When blood flow is directed away from the brain's executive center, the frontal cortex, and the amygdala and associated emotional centers are activated, we are likely to underutilize those executive functions--reasoning, judgment, planning--and respond to our (emotional) framing of choices with a lack of effort. Going with our feelings might just be the reason we don't think through our choices.
It is also likely that we frame our choices differently during periods of focus/concentration vs. emotional arousal. Stressful episodes in the market, activating the amygdala, are likely to elicit a framing that is different from the careful trade planning we conduct when we are cool and calm. Research, for instance, finds that fear and anger color our decision making about preparing for terrorism-related risks. Emotional factors have also been found to color decision making about economic choices.
This helps to explain why I have found biofeedback to be extraordinarily helpful for traders who experience emotional disruptions of decision making. By working with traders in stressful situations and having them control their level of arousal during these episodes, biofeedback enables them to retain access to their executive capabilities. In a very important sense, successful traders train their brains for accurate decision-making under stressful circumstances.
Sometimes, looking back on our trading decisions, we wonder if we were in our right minds. How accurate that concern turns out to be! Some of the best trading psychology interventions are the ones that keep us in our right minds as we make decisions under conditions of risk and uncertainty.
Subscribe to:
Posts (Atom)


 Posts
Posts


