
I'll be returning to regular blog posts and updates on the Trading Psychology Weblog on Thursday. Monday's market continued the narrow action in the S&P 500, continuing the neutral trend. It was a great illustration of the kind of day I referenced in the recent post about mean reversion. Knowing the day's average price and seeing: a) an open near the average price; and b) low volatility from the prior session; and c) modest early volume allowed traders to lean on the market's tendency to revert to that average price. Here is the Trading Markets article on that topic.
I notice that we had an expansion of new 20 and 65 day highs, but also an expansion of lows. Demand was 59; Supply was 69, which means we had slightly more stocks showing negative momentum than positive--but the majority not showing any distinct momentum. We need to see a move out of the recent several day range accompanied by an expansion of new highs/lows to establish a directional trend.
Monday, March 27, 2006
Sunday, March 26, 2006
Mean Reversion: How Often Does It Occur?

Recent posts have looked at the market's lack of trending and, indeed, its tendency to reverse moves. Does this suggest that the market tends to revert to mean trading prices? If so, might we find tradable strategies from this tendency?
I went back to March, 2003 (N = 773) and investigated each day of performance in the Dow Jones Industrial Average (DIA). I computed the previous day's average price simply as the average of the open-high-low-close. I then looked to see how often this average price was touched during the following day's trade.
It turns out that we revert to this mean trading price approximately 63% of the time. Since February of this year, that proportion has risen to over 70%. Are there variables that predict an even greater occurrence of this reversion? Do we see different levels of reversion on different time frames? Lots of good research questions here. Stay tuned.


Saturday, March 25, 2006
Countertrend Equivalence - An Intermediate-Term Look

My recent Trading Markets article, along with recent blog entries here, found evidence of countertrend equivalence on a 5 day basis and, to a more modest degree, over a 5 hour timeframe. Recall that the idea of countertrend equivalence is that, if the market establishes a strong trend over X period, the next X period will tend to reverse this trend.
I decided to extend the analysis by looking at 5 week periods in SPY. Since March, 2003 (N = 155) we have had 27 strong uptrending periods on my trend measure. Five weeks later, SPY averaged a gain of .67% (16 up, 11 down), weaker than the average five-week gain of 1.36% (103 up, 52 down).
To create a relative match, I looked at the 25 strongest downtrending periods in SPY during that same time. Five weeks later, SPY averaged a gain of 2.36% (18 up, 7 down)--much stronger than normal.
Once again, we see evidence of countertrending, with moves over one period reversed in the next. The effect is especially strong for reversals of downtrends on a five day and five week basis, suggesting that these timeframes might be worth coordinating for intermediate-term trades.
Friday, March 24, 2006
Observations on Trading Fundamentals and Risk Management
One of the interesting aspects of writing my current book on trader performance is interviewing people who have long years of experience as traders and as mentors to traders. To a person, they emphasize that success in trading is not a function of finding better indicators or trading patterns. Rather, they emphasize the seemingly mundane aspects of trading mechanics: sticking to trading plans, managing risk, and adapting to changing market conditions.
While the historical patterns on this site are useful food for thought and a worthwhile starting point for framing market understandings--and trade ideas, they cannot substitute for the fundamentals emphasized by these mentors.
Of these, risk management is perhaps the most important. Victor Niederhoffer, in his excellent book The Education of a Speculator, uses the example of trying to make $10.00 from $1.00 when you have a 60/40 chance of winning a dollar from each individual bet. The odds of ruin in such a game are about 66%. Indeed, one would need a bankroll in excess of $4.00 to make the pursuit of $10.00 a worthwhile game--even with 60/40 odds.
The moral of the story is that good odds aren't enough. Proper position sizing--and a bankroll sufficient to weather the inevitable strings of losses that occur with chance--are all-important. I have seen more psychological problems created by poor money management than the reverse. Losses should not be traumatic--emotionally or financially--if they are built into the trading plan and kept to a very reasonable fixed fraction of portfolio size.
While the historical patterns on this site are useful food for thought and a worthwhile starting point for framing market understandings--and trade ideas, they cannot substitute for the fundamentals emphasized by these mentors.
Of these, risk management is perhaps the most important. Victor Niederhoffer, in his excellent book The Education of a Speculator, uses the example of trying to make $10.00 from $1.00 when you have a 60/40 chance of winning a dollar from each individual bet. The odds of ruin in such a game are about 66%. Indeed, one would need a bankroll in excess of $4.00 to make the pursuit of $10.00 a worthwhile game--even with 60/40 odds.
The moral of the story is that good odds aren't enough. Proper position sizing--and a bankroll sufficient to weather the inevitable strings of losses that occur with chance--are all-important. I have seen more psychological problems created by poor money management than the reverse. Losses should not be traumatic--emotionally or financially--if they are built into the trading plan and kept to a very reasonable fixed fraction of portfolio size.
Thursday, March 23, 2006
Short-Term Countertrend Equivalence

My last post introduced the idea of countertrend equivalence: Once we get a solid trend reading for a period of time X, the next period X tends to reverse this trend. We saw that this occurred over a five-day period: if we have a strong trend over five days in SPY, the next five days tend to run counter to this trend.
I took a look at hourly SPY data going back to 11/21/05 (N = 586). When we've had a strong uptrend over a five hour period (N = 75), the next five hours in SPY average a loss of -.08% (33 up, 42 down). That is weaker than the average five-hour gain of .04% (312 up, 274 down) for the general sample.
When we've had a strong downtrend over a five-hour period (N = 47), the next five hours in SPY have averaged a gain of .18% (29 up, 18 down). This is noticeably stronger than the sample overall.
Once again, we see evidence of countertrend equivalence. I will pursue this topic further in my upcoming Trading Markets article.
Countertrend Equivalence: An Interesting Idea
I'm following up on the broad market's countertrend tendencies. When my trend measure registers that the market is trending over X time periods, it appears that the next X periods tend to reverse this trend. I need to research this further but, if true, this countertrend equivalence could be a solid basis for combining time frames in analysis. In other words, let's say you had a strong downtrend reading on an intraday basis *and* on a multiday basis. That should provide an excellent signal for a longer-term market purchase.
I went back to March, 2003 (N = 766) and examined five-day trend readings in SPY and then what happened in the *next* five days of SPY trading. When SPY displayed a strong five-day downtrend (N = 104), the next five days in SPY averaged a gain of .80% (68 up, 36 down). That is much stronger than the average five-day gain of .31% (448 up, 318 down) for the overall sample.
When SPY displayed a strong five-day uptrend (N = 196), the next five days in SPY averaged a gain of .17% (108 up, 88 down), weaker than the average five-day gain for the broad sample.
In short, five day trends are tending to reverse. The next question is: can we pair these five day periods with other time frames to create superior timing of trades?
I went back to March, 2003 (N = 766) and examined five-day trend readings in SPY and then what happened in the *next* five days of SPY trading. When SPY displayed a strong five-day downtrend (N = 104), the next five days in SPY averaged a gain of .80% (68 up, 36 down). That is much stronger than the average five-day gain of .31% (448 up, 318 down) for the overall sample.
When SPY displayed a strong five-day uptrend (N = 196), the next five days in SPY averaged a gain of .17% (108 up, 88 down), weaker than the average five-day gain for the broad sample.
In short, five day trends are tending to reverse. The next question is: can we pair these five day periods with other time frames to create superior timing of trades?
Wednesday, March 22, 2006
Coming Market Research
Just wanted to outline a direction my research will be taking, integrating the theme from the last post (looking at multiple time frames) and the recent theme of market trending. I'll be working on creating trending measures of the markets on two different time frames and then will see if combining short- and longer-term trend measures helps us identify historical patterns. If so, that would be significant, because the trend measures will be ones that could be applied to any stocks or markets.
A second direction is identifying sectors that commonly lead the broad market and comparing their trend measures with that of the broad market. My hypothesis is that a "crossover", in which the trend of the leading market overtakes the broad market trend, might provide an entry signal for short-term trend followers.
Thanks again to readers who continue to provide lots of good food for thought. I hope this blog returns those favors--
Brett
A second direction is identifying sectors that commonly lead the broad market and comparing their trend measures with that of the broad market. My hypothesis is that a "crossover", in which the trend of the leading market overtakes the broad market trend, might provide an entry signal for short-term trend followers.
Thanks again to readers who continue to provide lots of good food for thought. I hope this blog returns those favors--
Brett
What's Happening on the Larger Time Frame: Does It Matter?
A reader recently made the valuable point that, in addition to looking at such key aspects of the market as volatility, momentum, trend, and sentiment, it is necessary to look across different time frames. That raises an interesting question: Do time frames matter? If we see a historical pattern on one time frame, does what's happening on the larger time frame make a difference?
To address this issue, I looked at yesterday's market, in which SPY was down -.63%. Going back to March, 2003 (N = 765), I found 95 occurrences in which SPY was down between half a percent and a full percent. The next two days in SPY averaged a gain of .20% (55 up, 40 down), stronger than the average two-day gain in the SPY sample of .12%.
I then divided the same down day sample of SPY into two categories based on time frame performance. One group was down between half and a full percent and was making a five-day closing low (just like yesterday; N = 46). The other group was down by the same amount but not making a five-day closing low (N = 49).
When the down day in SPY was making a five-day low, the next two days in SPY averaged a gain of .40% (29 up, 17 down). When the down day in SPY was not making a five-day low, the next two days in SPY averaged a flat performance (26 up, 23 down). Thus, the bullish implications of a down SPY day are entirely attributable to the fact that they're five-day lows. The larger time frame matters quite a bit.
This is a moderately bullish consideration for today, especially if early action fails to take the averages below yesterday's lows. Hats off to the reader for an excellent observation.
To address this issue, I looked at yesterday's market, in which SPY was down -.63%. Going back to March, 2003 (N = 765), I found 95 occurrences in which SPY was down between half a percent and a full percent. The next two days in SPY averaged a gain of .20% (55 up, 40 down), stronger than the average two-day gain in the SPY sample of .12%.
I then divided the same down day sample of SPY into two categories based on time frame performance. One group was down between half and a full percent and was making a five-day closing low (just like yesterday; N = 46). The other group was down by the same amount but not making a five-day closing low (N = 49).
When the down day in SPY was making a five-day low, the next two days in SPY averaged a gain of .40% (29 up, 17 down). When the down day in SPY was not making a five-day low, the next two days in SPY averaged a flat performance (26 up, 23 down). Thus, the bullish implications of a down SPY day are entirely attributable to the fact that they're five-day lows. The larger time frame matters quite a bit.
This is a moderately bullish consideration for today, especially if early action fails to take the averages below yesterday's lows. Hats off to the reader for an excellent observation.
Tuesday, March 21, 2006
The Power Measure: What Happens Once a Trend Emerges?
Yesterday's entry on the Trading Psychology Weblog dusted off a proprietary indicator I developed a while ago, which I dubbed the Power Measure. It was my very first effort to measure a variable I call "trendiness": the market's tendency to persist in directional movement. After writing the recent articles that tracked the decreasing trendiness of the stock indices, I decided to modify the Power Measure and utilize it as an operational measure of trending that could be applied to a variety of markets and time frames. The nice thing about the measure is that it creates a normalized measurement, in which perfect upward trending earns a score of +100 and perfect downward trending earns a score of -100. Scores near zero suggest absence of trending: a tendency for price movement in period one to reverse in period two. Note that the Power Measure is a pure measure of price persistence; it does not confuse momentum/price strength with trending.
I went back to March, 2003 (N = 759) and looked at future price movement in SPY as a function of the Power Measure reading. When the measure was 90 or greater (consistent upside trending; N = 85), the next three days in SPY averaged a loss of -.02% (43 up, 42 down)--much weaker than the average three-day gain of .18% for the sample overall (443 up, 316 down).
When the Power Measure was -80 or lower (consistent downside trending; N = 55), the next three days in SPY averaged a gain of .53% (39 up, 16 down)--much stronger than average.
This is the clearest cut evidence I've yet seen of a countertrend bias to the market. Waiting for a distinct trend to emerge and then fading it has proven far more successful as a trading strategy than trying to ride trends. It will be interesting to see if this holds for shorter time frames as well. If my future investigations prove equally promising, I'll bring the Power Measure back to the Weblog.
I went back to March, 2003 (N = 759) and looked at future price movement in SPY as a function of the Power Measure reading. When the measure was 90 or greater (consistent upside trending; N = 85), the next three days in SPY averaged a loss of -.02% (43 up, 42 down)--much weaker than the average three-day gain of .18% for the sample overall (443 up, 316 down).
When the Power Measure was -80 or lower (consistent downside trending; N = 55), the next three days in SPY averaged a gain of .53% (39 up, 16 down)--much stronger than average.
This is the clearest cut evidence I've yet seen of a countertrend bias to the market. Waiting for a distinct trend to emerge and then fading it has proven far more successful as a trading strategy than trying to ride trends. It will be interesting to see if this holds for shorter time frames as well. If my future investigations prove equally promising, I'll bring the Power Measure back to the Weblog.
Monday, March 20, 2006
Small and Midcap Stocks: Relative Performance and What It Means
My recent Trading Markets article took a look at how small cap performance acts as a mediator of past and future S&P performance, creating a statistical interaction effect. Today we had an interesting situation in which the S&P Midcaps ($MID) underperformed the S&P Small Caps ($SML). Specifically, SML was up .03% and MID was down -.34%.
Going back to March, 2003 (N = 766), I found 127 occasions in which the day's change in SML was within plus or minus .20%. The next day in SPY averaged .01% (63 up, 64 down), which is weaker than next day results for the sample overall. Once again, however, we see an interaction effect. When SML is neutral and MID is strong, the next day in SPY averages a loss of -.11 (29 up, 35 down). When SML is neutral and MID is weak, the next day in SPY averages a gain of .13% (34 up, 29 down).
Once again we see that a critical mediating effect is played by the relative outperformance or underperformance of the small cap stocks. When SML is neutral but outperforms MID, next day results in SPY are more favorable than when SML is neutral but underperforms MID. Score this as a mild bullish consideration for tomorrow.
Going back to March, 2003 (N = 766), I found 127 occasions in which the day's change in SML was within plus or minus .20%. The next day in SPY averaged .01% (63 up, 64 down), which is weaker than next day results for the sample overall. Once again, however, we see an interaction effect. When SML is neutral and MID is strong, the next day in SPY averages a loss of -.11 (29 up, 35 down). When SML is neutral and MID is weak, the next day in SPY averages a gain of .13% (34 up, 29 down).
Once again we see that a critical mediating effect is played by the relative outperformance or underperformance of the small cap stocks. When SML is neutral but outperforms MID, next day results in SPY are more favorable than when SML is neutral but underperforms MID. Score this as a mild bullish consideration for tomorrow.
Sunday, March 19, 2006
Large Caps Strong, Small Caps Stronger: What Next?
We've had a strong six-day run in the large cap stocks, with XMI up over 2.5% in that period. Small cap issues (SML) have been even stronger, up about 4%. I decided to look at what happens in the S&P 500 (SPY) since March, 2003 (N = 762) after a big cap run and whether small caps play a role in future performance.
I found 94 occasions of six-day XMI gains of over 2%. Six days later, SPY was up by an average of .17% (55 up, 39 down), which is less than the average six-day gain for the sample of .37% (449 up, 313 down). When XMI was up by more than 2% in six days and SML was strong (N = 47), the next six days in SPY averaged .50% (31 up, 16 down). When XMI was similarly up and SML was weak (N = 47), the next six days in SPY averaged a loss of -.16% (24 up, 23 down).
Once again, it appears that performance in the small caps mediates future performance in the S&P 500--this time on a longer time frame. When the large caps are strong and small stocks are relatively weak, the S&P noticeably underperforms over the next six days. When the large caps are strong and small stocks are also strong, there are greater odds of continuation of strength. We'd have to chalk this one up as moderately favorable for the bulls.
I found 94 occasions of six-day XMI gains of over 2%. Six days later, SPY was up by an average of .17% (55 up, 39 down), which is less than the average six-day gain for the sample of .37% (449 up, 313 down). When XMI was up by more than 2% in six days and SML was strong (N = 47), the next six days in SPY averaged .50% (31 up, 16 down). When XMI was similarly up and SML was weak (N = 47), the next six days in SPY averaged a loss of -.16% (24 up, 23 down).
Once again, it appears that performance in the small caps mediates future performance in the S&P 500--this time on a longer time frame. When the large caps are strong and small stocks are relatively weak, the S&P noticeably underperforms over the next six days. When the large caps are strong and small stocks are also strong, there are greater odds of continuation of strength. We'd have to chalk this one up as moderately favorable for the bulls.
Saturday, March 18, 2006
Small vs. Large Cap Performance: Impact on Next Day Trading
Here's a look at a relatively pure measure of large cap performance, the Major Market Index ($XMI), vs. a relatively pure measure of small cap performance, the S&P 600 ($SML). On Friday, we barely moved on XMI, registering a loss of -.07%. SML was stronger, rising .26%.
I decided to go back to March, 2003 (N = 765) and see how next day performance in the S&P 500 was impacted by previous relative performance in SML vs. XMI. I found 192 occasions in which XMI closed with a gain of less than .20% and a loss not greater than -.20%. The average next day performance in SPY was .07% (107 up, 85 down).
On narrow XMI days in which SML was strong (N = 96), the average next day gain was .10% (58 up, 38 down). On narrow XMI days in which SML was weak, the average next day gain was only .04% (49 up, 47 down). This is a pattern I have noticed before: smaller cap performance appears to lead that in larger caps. As long as SML outperforms XMI, short-term returns tend to be more favorable than when SML underperforms. I'll be taking further looks at these sectors in the near future.
I decided to go back to March, 2003 (N = 765) and see how next day performance in the S&P 500 was impacted by previous relative performance in SML vs. XMI. I found 192 occasions in which XMI closed with a gain of less than .20% and a loss not greater than -.20%. The average next day performance in SPY was .07% (107 up, 85 down).
On narrow XMI days in which SML was strong (N = 96), the average next day gain was .10% (58 up, 38 down). On narrow XMI days in which SML was weak, the average next day gain was only .04% (49 up, 47 down). This is a pattern I have noticed before: smaller cap performance appears to lead that in larger caps. As long as SML outperforms XMI, short-term returns tend to be more favorable than when SML underperforms. I'll be taking further looks at these sectors in the near future.
Friday, March 17, 2006
Closing NYSE TICK: Does It Matter?

Here is the Trading Markets article on Euro currency trading; thanks for the interesting comments.
I decided to take a look at the closing level of the NYSE TICK and whether it has any relevance for the next day's trading. Friday we closed above +900 on the TICK, suggesting broad buying on the close. Indeed, the final TICK number might be viewed as the leaning of traders' market-on-close positions, as they either lift offers or hit bids in stocks.
My first observation, going back to March, 2003 (N = 767), is that there is a positive bias to the data. The average closing TICK value is 452.
When the TICK closes above 900 (N = 82), the next day in the S&P 500 (SPY) averages a gain of .11% (48 up, 34 down). This is stronger than the average gain for the sample of .06% (429 up, 339 down).
When the TICK closes below -200 (N = 43), the next day in the S&P 500 averages a gain of .26% (28 up, 15 down). It thus appears that selling on the close tends to reverse the following day, while strong buying on the close has a moderate tendency to continue the next day.
Combining the closing TICK with momentum measures, such as the Demand/Supply Index, might screen for particularly positive times to buy the market. Another idea would be to track the TICK readings from the final hour of trade and the impact the next day.
PS - Above is Mali, the blind cat we adopted in Syracuse. When we moved to Naperville to a three story house, Mali took a day and a half to find her way around completely. That was before we got our furniture in. She adapted to the furniture in a day. She constantly sniffs as she moves, and her hearing is excellent. She comes running whenever she hears someone visiting us--she loves meeting new people. How many of our senses do we engage in trading, and how much information processing do we lose by being solely dependent upon sight?
Thursday, March 16, 2006
Forex: Know the Market You're Trading!
My recent article in Trading Markets emphasized the importance of the fit between the personality of a market--its degree of volatility and trending--and the trading style of the trader. Quite a few readers wrote to me, asking about which market would be best for them. Many asked specifically about currency (forex) trading, since instruments such as the Euro are known to be trending and volatile.
My next article for Trading Markets will examine whether the Euro truly is a superior trading instrument. I think you'll be surprised by the findings. Without giving away too many punch lines here, allow me to mention one important finding: I find no evidence of trending in the currency market on either a 30 minute or daily basis. In fact, up periods are modestly more likely to be followed by down periods (and vice versa) than by continuation.
Many brokerage houses specializing in currency trading--especially those going after retail customers--stress what wonderful trending markets currencies are. They also emphasize commission-free trading with "only" a three-pip spread and possible leverage of several hundred to one on your money.
Well, each pip in the Euro emini is like a tick in the S&P emini: worth $12.50. So the highly leveraged trader in a market he thinks is trending, buys a volatile period and what happens? He is down three ticks on size already even if he scratches the trade. But when the market reverses with high volatility, he quickly is in the red by a substantial amount.
I spoke with a very well placed industry insider who revealed to me that the average length of time from the opening of a trading account to the closing of that account was seven months. This was not because the trader was dissatisfied with the firm; rather, that was how long it took the average customer to blow through their capital.
Yale Hirsch says, "Investigate before you invest." That's wisdom that applies equally to traders.
My next article for Trading Markets will examine whether the Euro truly is a superior trading instrument. I think you'll be surprised by the findings. Without giving away too many punch lines here, allow me to mention one important finding: I find no evidence of trending in the currency market on either a 30 minute or daily basis. In fact, up periods are modestly more likely to be followed by down periods (and vice versa) than by continuation.
Many brokerage houses specializing in currency trading--especially those going after retail customers--stress what wonderful trending markets currencies are. They also emphasize commission-free trading with "only" a three-pip spread and possible leverage of several hundred to one on your money.
Well, each pip in the Euro emini is like a tick in the S&P emini: worth $12.50. So the highly leveraged trader in a market he thinks is trending, buys a volatile period and what happens? He is down three ticks on size already even if he scratches the trade. But when the market reverses with high volatility, he quickly is in the red by a substantial amount.
I spoke with a very well placed industry insider who revealed to me that the average length of time from the opening of a trading account to the closing of that account was seven months. This was not because the trader was dissatisfied with the firm; rather, that was how long it took the average customer to blow through their capital.
Yale Hirsch says, "Investigate before you invest." That's wisdom that applies equally to traders.
Wednesday, March 15, 2006
Strong NASDAQ, Low TRIN: Short-Term Results
First off, I want to thank readers who have suggested ideas for research and who have provided helpful feedback re: this and the Trading Psychology sites. Thanks also to readers who have shown interest in The Psychology of Trading; for it to have cracked the top 10,000 on Amazon three years after its publication is a testament to the enduring relevance of psychology for trading. My new book, Enhancing Trader Performance, is undergoing editing and should be published this fall.
A reader very helpfully pointed out that strong gains accompanied by low TRIN readings are bullish on a next day basis. Recall that my analysis yesterday showed weakness over the intermediate term. Fortunately today provided an opportunity to test the reader's idea: We have closed higher by 2.56% on the NASDAQ 100 ETF (QQQQ) over the past two days. The NASDAQ TRIN during that time has averaged .496.
Going back to March, 2003 (N = 762), I found 81 instances of a two-day rise of more than 2% in QQQQ. Over the next two days, QQQQ was higher by an average .26% (50 up, 31 down), stronger than the average two-day rise of .15% (413 up, 349 down) for the broad sample. When, however, QQQQ was up by more than 2% on a two-day basis and the TRIN averaged less than .50 over that same time (N = 20), the next two days were up by an average of .54% (13 up, 7 down). Score one for short-term bulls and for an astute reader.
A reader very helpfully pointed out that strong gains accompanied by low TRIN readings are bullish on a next day basis. Recall that my analysis yesterday showed weakness over the intermediate term. Fortunately today provided an opportunity to test the reader's idea: We have closed higher by 2.56% on the NASDAQ 100 ETF (QQQQ) over the past two days. The NASDAQ TRIN during that time has averaged .496.
Going back to March, 2003 (N = 762), I found 81 instances of a two-day rise of more than 2% in QQQQ. Over the next two days, QQQQ was higher by an average .26% (50 up, 31 down), stronger than the average two-day rise of .15% (413 up, 349 down) for the broad sample. When, however, QQQQ was up by more than 2% on a two-day basis and the TRIN averaged less than .50 over that same time (N = 20), the next two days were up by an average of .54% (13 up, 7 down). Score one for short-term bulls and for an astute reader.
Tuesday, March 14, 2006
S&P Strength and TRIN: Another Look at Efficiency
The S&P 500 (SPY) has approximately 2.2% in the past 3 days on an average TRIN reading of .69. I went back to March, 2003 (N = 759) and found 51 occasions in which we had a three-day period with a rise of more than 2%. The average three-day TRIN for those occasions was .80, indicating that we have had an above average concentration of volume in rising issues.
Six days following the three-day rise, SPY has averaged a gain of .70% (35 up, 16 down), much stronger than the three-day average gain for the overall sample of .36% (446 up, 313 down).
When we break the strong occasions in half based on three-day TRIN readings, however, a distinct pattern appears. When SPY is strong and the TRIN is lower than average (higher concentration of volume in rising issues), the next six days average a gain of only .03% (13 up, 12 down). When SPY is strong and the TRIN is higher than average, the next six days average a gain of 1.35% (22 up, 4 down).
Once again we can understand the results in terms of market efficiency. When it takes a greater concentration of volume in rising issues to achieve a particular rise, the market is less efficient and subsequently produces subnormal returns. When the market is more efficient--able to generate a given rise without a commensurate concentration in volume--returns following strength tend to continue the strength.
The results suggest that it may be difficult to generate the upside followthrough normally associated with a strong three-day gain.
Six days following the three-day rise, SPY has averaged a gain of .70% (35 up, 16 down), much stronger than the three-day average gain for the overall sample of .36% (446 up, 313 down).
When we break the strong occasions in half based on three-day TRIN readings, however, a distinct pattern appears. When SPY is strong and the TRIN is lower than average (higher concentration of volume in rising issues), the next six days average a gain of only .03% (13 up, 12 down). When SPY is strong and the TRIN is higher than average, the next six days average a gain of 1.35% (22 up, 4 down).
Once again we can understand the results in terms of market efficiency. When it takes a greater concentration of volume in rising issues to achieve a particular rise, the market is less efficient and subsequently produces subnormal returns. When the market is more efficient--able to generate a given rise without a commensurate concentration in volume--returns following strength tend to continue the strength.
The results suggest that it may be difficult to generate the upside followthrough normally associated with a strong three-day gain.
Monday, March 13, 2006
TRIN and Market Efficiency
This will kick off a historical look at the TRIN (Arms Index). Today we had a gain of .19% in SPY and TRIN was .75. I went back to March, 2003 (N = 761) and looked at all one-day occasions in which TRIN was between .70 and .80 (N = 87). What we find by making TRIN the independent variable is that such a TRIN value can be associated with very different market outcomes. For example, in the sample, the one-day SPY readings associated with TRIN between .70 and .80 range from a loss of -.15% to a gain of 2.13%. The gain of .19% on Monday was definitely on the lower end of the spectrum. It's saying that, although volume was relatively concentrated in advancing stocks, such concentration could not generate much upside in the large cap market.
I divided the sample in half based on the SPY outcomes to see what happened the next day. When TRIN was between .70 and .80 and SPY was weak, the next day in SPY averaged a gain of .01% (21 up, 22 down). This was weaker than the average rise of .06% for the full sample. When TRIN was in the same range and SPY was strong, the next day in SPY averaged a gain of .08% (25 up, 19 down). It thus appears that when the market is relatively inefficient--a concentration of volume cannot generate much price gain--short run outcomes are weaker than if we see volume concentration associated with price strength.
I'll be investigating this idea of market efficiency further. For now, we'll count this one very modestly in the bear's column.
I divided the sample in half based on the SPY outcomes to see what happened the next day. When TRIN was between .70 and .80 and SPY was weak, the next day in SPY averaged a gain of .01% (21 up, 22 down). This was weaker than the average rise of .06% for the full sample. When TRIN was in the same range and SPY was strong, the next day in SPY averaged a gain of .08% (25 up, 19 down). It thus appears that when the market is relatively inefficient--a concentration of volume cannot generate much price gain--short run outcomes are weaker than if we see volume concentration associated with price strength.
I'll be investigating this idea of market efficiency further. For now, we'll count this one very modestly in the bear's column.
Sunday, March 12, 2006
Trendiness on a Weekly Basis: Unexpected Findings
Here is a weekly view of the issue of trending markets using S&P 500 and NASDAQ 100 data. (By the way, a different perspective is posted to the Trader Performance page on my personal site). I went back to January, 1997 (N = 479) and just looked at weekly closing prices. Once again, I focused on occasions in which either a rise was followed by a rise or a decline by a decline.
In all, for the S&P, there were 239 occasions in which we saw a two-week trend and 240 occasions in which rises were followed by declines or vice versa. This is exactly what we'd expect by chance. In the NASDAQ, we had 246 trending occasions and 233 non-trending two-week instances. (Interestingly, the NASDAQ also showed up on my Trader Performance analysis as performing better vis a vis momentum/trend trading).
Looking only at 2005/6 data (N = 62), we had 31 trending two-week periods in the S&P and 31 non-trending ones. In the NASDAQ, we had 33 trending periods and 29 non-trending ones. Interestingly, we see neither evidence of persistence (trending) or anti-persistence (reversal) in the weekly data--even the most recent weekly readings.
What this says to me is that the market's loss of trendiness is occurring more at shorter time frames than at longer ones. My next Trading Markets article will address this.
In all, for the S&P, there were 239 occasions in which we saw a two-week trend and 240 occasions in which rises were followed by declines or vice versa. This is exactly what we'd expect by chance. In the NASDAQ, we had 246 trending occasions and 233 non-trending two-week instances. (Interestingly, the NASDAQ also showed up on my Trader Performance analysis as performing better vis a vis momentum/trend trading).
Looking only at 2005/6 data (N = 62), we had 31 trending two-week periods in the S&P and 31 non-trending ones. In the NASDAQ, we had 33 trending periods and 29 non-trending ones. Interestingly, we see neither evidence of persistence (trending) or anti-persistence (reversal) in the weekly data--even the most recent weekly readings.
What this says to me is that the market's loss of trendiness is occurring more at shorter time frames than at longer ones. My next Trading Markets article will address this.
Saturday, March 11, 2006
Will Very Short-Term Momentum Trading of the S&P Work?
As we've seen from the recent Trading Markets article and yesterday's blog posting, the S&P 500 Index has been losing its trending properties across multiple timeframes, from daily through intraday. Anecdotal evidence suggests that scalpers are suffering in this market, as well. Let's see how the market is trending on their time frame. Please note that when I talk about scalpers, I am referring to liquidity providers in the electronic marketplace. These are participants who are in the market most of the time, working bids and offers and attempting to extract small, frequent profits from very short-term movement.
I went back to January, 2004 and looked at all five-minute periods in the ES contract (N = 44,110). As before, I calculated all instances in which the market was either up following a five-minute rise or down following a five-minute decline. What we see is that only 14,362 of the periods displayed such two-period trends. This proportion is *much* worse than what we saw in the daily or even the hourly data. In essence, it's saying that the odds of the market rising five minutes after a five minute rise (or declining after a five-minute decline) are worse than one in three.
The reason for this is that a number of five-minute periods close unchanged. The low volatility conspires to restrain very short-term trending behavior. This makes momentum trading near impossible. Either one must extend one's holding period well beyond five minutes--in which case you're really no longer a scalper--or one be willing to fade any movement whatsoever, risking those one in three occasions when the market can run you over.
Is there any hope for momentum and trend traders in different instruments? This will be the upcoming focus.
I went back to January, 2004 and looked at all five-minute periods in the ES contract (N = 44,110). As before, I calculated all instances in which the market was either up following a five-minute rise or down following a five-minute decline. What we see is that only 14,362 of the periods displayed such two-period trends. This proportion is *much* worse than what we saw in the daily or even the hourly data. In essence, it's saying that the odds of the market rising five minutes after a five minute rise (or declining after a five-minute decline) are worse than one in three.
The reason for this is that a number of five-minute periods close unchanged. The low volatility conspires to restrain very short-term trending behavior. This makes momentum trading near impossible. Either one must extend one's holding period well beyond five minutes--in which case you're really no longer a scalper--or one be willing to fade any movement whatsoever, risking those one in three occasions when the market can run you over.
Is there any hope for momentum and trend traders in different instruments? This will be the upcoming focus.
Friday, March 10, 2006
Does The Market Trend on an Intraday Basis?
I'm getting quite a few positive comments on my recent Trading Markets article that documents the decline in trending behavior in the S&P 500 Index over the past 40 years. What has been eye-opening, however, is that this loss of trendiness has occurred across all time frames that I've investigated thus far.
Here's an example. I took hourly readings of SPY since December 13, 2005 (N = 478). I once again looked for all occasions in which a rise was followed by a rise and a decline by a decline. If the odds of a rise or decline are 50/50, we should see half of all occasions by chance result in either two consecutive rises or two consecutive declines.
In fact, we see 225 occasions where either a rise was followed by a rise or a decline followed by a decline and 253 occasions where rises were followed by declines or declines by rises. During March alone (N = 64), we've seen 28 occasions where rises were followed by rises or declines by declines and 36 occasions where there was no continuation of a move.
Once again, we not only see an absence of trending--failure of rises to be followed by rises and declines by declines--but actually evidence of antipersistence. On average, rises are being followed by declines and vice versa. This is wreaking havoc with momentum traders in the ES and SPY markets.
Next I'll look at other indices and sectors and see where there might be opportunity for trend and momentum traders.
Here's an example. I took hourly readings of SPY since December 13, 2005 (N = 478). I once again looked for all occasions in which a rise was followed by a rise and a decline by a decline. If the odds of a rise or decline are 50/50, we should see half of all occasions by chance result in either two consecutive rises or two consecutive declines.
In fact, we see 225 occasions where either a rise was followed by a rise or a decline followed by a decline and 253 occasions where rises were followed by declines or declines by rises. During March alone (N = 64), we've seen 28 occasions where rises were followed by rises or declines by declines and 36 occasions where there was no continuation of a move.
Once again, we not only see an absence of trending--failure of rises to be followed by rises and declines by declines--but actually evidence of antipersistence. On average, rises are being followed by declines and vice versa. This is wreaking havoc with momentum traders in the ES and SPY markets.
Next I'll look at other indices and sectors and see where there might be opportunity for trend and momentum traders.
Small Cap Stocks: Five-Day Weakness and What Comes Next
It's been a rough week for the small caps, as the Russell 2000 ETF (IWM) is down over 3% on a five-day basis. I went back to March, 2003 (N = 757) and looked for all occasions where the Russell was down comparably and what has happened next.
In all, I found 58 occasions in which IWM was down 3% or more in a five-day period. Five days later, the S&P 500 (SPY) was up by an average .72% (36 up, 22 down) and IWM was up by an average (1.13%) 35 up, 23 down. Both are considerably stronger than the average five-day gain for SPY (.30%; 442 up, 315 down) and IWM (.50%; 445 up, 312 down). This will have me looking for upside setups today and Monday.
In all, I found 58 occasions in which IWM was down 3% or more in a five-day period. Five days later, the S&P 500 (SPY) was up by an average .72% (36 up, 22 down) and IWM was up by an average (1.13%) 35 up, 23 down. Both are considerably stronger than the average five-day gain for SPY (.30%; 442 up, 315 down) and IWM (.50%; 445 up, 312 down). This will have me looking for upside setups today and Monday.
Thursday, March 09, 2006
Going From Trade Ideas to Profitable Trades

Before the open tomorrow, I will post an analysis of market expectations based on events among the secondary stocks. That should prove informative, as we have interesting five-day patterns.
Here, though, I want to follow up on my post earlier today. The market provided a great example of how trade ideas developed through historical analysis are just that: trade ideas. They need to be confirmed by real time market action to become viable trades.
One of the ways I'll look at a market intraday is to scan for expectable events and setups for those events. An example would be a move back to the average trading price for the current or previous day. I know, based on research, that the market will return to its average price 3/4 of the time--and more often if volume/volatility are low. Knowing this, I will then look for a setup--a real-time event--to confirm for me that this historical tendency is likely to occur. Thus, for instance, I'll see that the ES has moved to the upper end of its range, but other indices haven't. Then I'll see volume lifting offers drying up. That will trigger my trade for a move back to the day's average price.
Today I was looking for a different expectable event: A boost in the NYSE TICK to 1000 or greater. Before acting on that, I needed a setup: Some real-time event to confirm for me that buyers were gaining the upper hand. Not only didn't we get the setup, we got the reverse: Bond yields after 10:30 AM CT rose and the market sold off, taking the TICK lower. At that point, our Cumulative Adjusted TICK began making daily lows and it was clear that traders were hitting bids, not taking offers. With interest rates again weighing on stocks and short-term sentiment negative--as shown by the negative TICK--the trade idea gained no validation.
All of this raises an important point: Coming up with good trade ideas is simple. The difficult part is knowing whether and when to act upon them. In my own trading, I need an idea, a setup, and then a framework for managing the trade once it's on. There is much more to trading competence than coming up with good ideas--and today provided a nice demonstration of that.
NYSE TICK and Descriptive Statistics
I'll amplify on this tonight: Sometimes descriptive statistics alone are of value in trading. For example, as I write at approximately 10:30 AM CT, we have not yet had an NYSE TICK reading of +1000 or greater. Since the start of 2005 (N = 296), there have been 262 days that have seen such elevated readings and only 34 that have not. I'm willing to bet that we will have just such an elevated spike sometime today, and I'll look for the setup. Then I'll trade the instrument best positioned to take advantage of that spike, which--right now--looks like SMH, the very instrument highlighted in yesterday's entry. Not something I'd bet the farm on, but a thought going through the head right now...
Wednesday, March 08, 2006
More SOX and Stocks
Keep your eyes on the Trading Markets site this weekend. I have a historical analysis scheduled for publication that examines the stock market's trending behavior over a 40 year period. It's eye opening. I'll have a very brief summary on the Trading Psychology Weblog tonight.
I thought I would update some of the modeling with the semiconductor stocks (SMH), given that we're down more than 5% over the past four trading sessions. One wrinkle I'm adding to the analysis is that I'm examining outcomes across three instruments: SMH, QQQQ, and SPY. This addresses the theme I've been touching upon lately of maximizing the instrument that you trade as well as the timing of trades.
Since March, 2003 (N = 753), we have had 53 days in which SMH has been down more than 5% over a four-day period. Four days later, here's how the outcomes looked:
I thought I would update some of the modeling with the semiconductor stocks (SMH), given that we're down more than 5% over the past four trading sessions. One wrinkle I'm adding to the analysis is that I'm examining outcomes across three instruments: SMH, QQQQ, and SPY. This addresses the theme I've been touching upon lately of maximizing the instrument that you trade as well as the timing of trades.
Since March, 2003 (N = 753), we have had 53 days in which SMH has been down more than 5% over a four-day period. Four days later, here's how the outcomes looked:
- SPY: Average gain = .79% (38 up, 15 down). Average four-day gain for sample overall = .24% (435 up, 318 down).
- QQQQ: Average gain = 1.21% (36 up, 17 down). Average four-day gain for sample overall = .31% (421 up, 332 down).
- SMH: Average gain = 1.80% (35 up, 18 down). Average four-day gain for sample overall = .34 (400 up, 353 down).
What we can see is that there are distinctly positive outcomes four days out across all indices. When SMH is very weak over a four-day period, the next four days have been bullish on average. Of the three ETFs, SMH has milked this pattern the most, more than doubling the average gain in SPY. It thus appears that the greatest edge is not only trading to the long side over this swing period, but also trading the very instrument that has been weakest. Let's follow up on this shortly.
Two Days of Strong Downside Momentum: What Next?
The past two sessions, we have had broad downside momentum in the stock market, as measured by the Demand/Supply Index monitored on the Trading Psychology Weblog. I went back to March, 2003 (N = 754) and looked for similar periods in which the two-day Supply exceeded 270 (N = 15). Two days later, the market (SPY) was up by an average of .18 (10 up, 5 down), modestly stronger than the average two-day gain of .12% for the sample overall. One week (five days) later, however, the market was up by an average of only .02% (7 up, 8 down)--much weaker than the average five-day gain of .30% over the entire period (442 up, 312 down) overall. A bounce following strong downside momentum followed by subnormal performance thus seems to be the norm.
The recent market has been hostage to bond/interest rate movements, however, so these may well be calling the shots in the near term. I'm also noticing a lead-lag relationship between the DAX and the S&P, with strength in the former leading large cap strength yesterday and weakness leading overnight weakness in the ES.
The recent market has been hostage to bond/interest rate movements, however, so these may well be calling the shots in the near term. I'm also noticing a lead-lag relationship between the DAX and the S&P, with strength in the former leading large cap strength yesterday and weakness leading overnight weakness in the ES.
Tuesday, March 07, 2006
Strong Dow, Weak Speculative Stocks
Hope you've been able to profit from the trend/momentum and interest rate/stock relationships we've been seeing. It's been a bit tricky if you've been trading the large cap indices such as the S&P 500, because there has been a huge divergence in performance between those large caps (stronger) and the secondary issues (weaker).
I noticed, for example, that the Dow Industrials (DIA) were actually up on the day, while my basket of Speculative Stocks was down by over 1.5%. That is quite a gap. Going back to January, 2003 (N = 797), I could only find eight occasions in which the Spec stocks were down by more than 1%, but the Dow was up. Three days later, the Dow was up seven of those eight occasions by an average of .91%--much stronger than the average three-day change of .10% (435 up, 362 down) for the sample overall. It appears that, when the Spec stocks have been down sharply, they--and the rest of the market--tend to rebound three days out.
Interestingly, if we just look at occasions in which the Dow is up, but Spec stocks are down (N = 60), the next day the Dow is down by an average of -.13% (26 up, 34 down) and the Spec stocks are down even more. This fits with other research I have done: When Spec stocks underperform the Non-Spec issues, the next day sees some follow through in weakness. A reasonable scenario for the market, then, might be weakness tomorrow followed by a rebound.
Tomorrow AM, I will post a different analysis, tracking market performance after several consecutive down days.
I noticed, for example, that the Dow Industrials (DIA) were actually up on the day, while my basket of Speculative Stocks was down by over 1.5%. That is quite a gap. Going back to January, 2003 (N = 797), I could only find eight occasions in which the Spec stocks were down by more than 1%, but the Dow was up. Three days later, the Dow was up seven of those eight occasions by an average of .91%--much stronger than the average three-day change of .10% (435 up, 362 down) for the sample overall. It appears that, when the Spec stocks have been down sharply, they--and the rest of the market--tend to rebound three days out.
Interestingly, if we just look at occasions in which the Dow is up, but Spec stocks are down (N = 60), the next day the Dow is down by an average of -.13% (26 up, 34 down) and the Spec stocks are down even more. This fits with other research I have done: When Spec stocks underperform the Non-Spec issues, the next day sees some follow through in weakness. A reasonable scenario for the market, then, might be weakness tomorrow followed by a rebound.
Tomorrow AM, I will post a different analysis, tracking market performance after several consecutive down days.
High TRIN and Next Day Open - Quick Note
Quick note on TRIN (NYSE Arms Index) that I will follow up later today. In response to the reader's question, when TRIN is 2.0 or greater and SPY has fallen by .75% or more (N = 37) since March, 2003 (N = 758), the market opens the next day up by an average .17% (28 up, 9 down), much stronger than the average overnight gain of .04% (415 up, 343 down). This is further evidence that downside momentum from the previous day has not tended to carry over to early the next day. More to come...
Monday, March 06, 2006
Big Down Day: What Happens at the Open?
Quick note before Tuesday's open. A reader asked me what happens at the open after the market has moved down sharply. I looked at SPY from March, 2003 to the present (N = 758) and found 106 instances in which the market was down .75% or more from open to close. The next day's open averaged a gain of .09% (72 up, 34 down)--considerably stronger than the average overnight move of .04% (415 up, 343 down). There is thus no evidence that weak markets during the day session spill over to the overnight and, in fact, we see a modest bounce more often than not in the overnight. Given the tendency of strong downside momentum markets to continue weakness in the short run, this may set up a trade of selling strength early the next day.
Thanks, BTW, for the kind comments sent to me re: the recent Trading Markets article.
Thanks, BTW, for the kind comments sent to me re: the recent Trading Markets article.
Interest Rate Rises: What They Mean for Stocks--and Bonds
On 3/2/06, I wrote about the possibility of changing cycles vis a vis interest rates and stocks based on recent shifts in historical patterns. Today we saw more evidence of this, as stocks moved to multi-day lows and rates moved to multi-day highs. Specifically, we are down about 1% over the last five days in SPY and up about 3.22% in the 10-year Note interest rate ($TNX). I decided to take a longer look and went back to April 2000 (N = 1480) to see what happens when we get a rise in rates of over 2.5% in a five day period.
I found 251 such occasions. Ten days later, interest rates had risen further by an average of .61% (135 up, 116 down) and stocks had fallen further, by an average of -.11% (121 up, 130 down). Rates were stronger than the average change for the sample overall (-.07%; 639 up, 841 down). Stocks were weaker than the average change for the sample (-.03%; 762 up, 718 down).
I then looked at the results from 2003 to the present (N = 155). Ten days after the five-day rise in rates, stocks were down by an average of -.19% (74 up, 81 down) and rates were up by 1.10% (87 up, 68 down).
In short, a strong weekly rise in interest rates has been associated with further bond weakness (rate rises) and further stock weakness. We'll have to count this as one for the bears going forward.
I found 251 such occasions. Ten days later, interest rates had risen further by an average of .61% (135 up, 116 down) and stocks had fallen further, by an average of -.11% (121 up, 130 down). Rates were stronger than the average change for the sample overall (-.07%; 639 up, 841 down). Stocks were weaker than the average change for the sample (-.03%; 762 up, 718 down).
I then looked at the results from 2003 to the present (N = 155). Ten days after the five-day rise in rates, stocks were down by an average of -.19% (74 up, 81 down) and rates were up by 1.10% (87 up, 68 down).
In short, a strong weekly rise in interest rates has been associated with further bond weakness (rate rises) and further stock weakness. We'll have to count this as one for the bears going forward.
Sunday, March 05, 2006
Midday Price Patterns
After looking at opening and closing hours, I decided to split the difference and investigate midday hours: the time in the market from the end of the first hour of trading to the start of the last hour. Going back to March, 2003 (N = 757) in the Dow Industrials, I find 78 occasions in which we had a gain of .50% or greater during the midday hours. The average change to the same day's close was .09% (46 up, 32 down), modestly stronger than the average gain of .01% (403 up, 354 down) for the sample overall.
We had 89 occasions in which the midday hours lost .50% or more. I did not find a meaningful edge by the close of the same day. By the close the following day, however, the Dow averaged a gain of .11% (50 up, 39 down), stronger than the average gain of .06% (393 up, 364 down) for the sample overall.
My overall impression is that intraday traders, like the protagonist in Neil Young's "The Needle and the Damage Done", are milking blood to keep from running out. While there are some historical patterns in intraday markets and over very short time frames, they are modest compared with those that we've seen over swing periods. I'm not sure that's well appreciated among active traders.
We had 89 occasions in which the midday hours lost .50% or more. I did not find a meaningful edge by the close of the same day. By the close the following day, however, the Dow averaged a gain of .11% (50 up, 39 down), stronger than the average gain of .06% (393 up, 364 down) for the sample overall.
My overall impression is that intraday traders, like the protagonist in Neil Young's "The Needle and the Damage Done", are milking blood to keep from running out. While there are some historical patterns in intraday markets and over very short time frames, they are modest compared with those that we've seen over swing periods. I'm not sure that's well appreciated among active traders.
Saturday, March 04, 2006
Last Hour of Trading: What It Means
After looking at the opens recently, I decided to investigate market performance following strong vs. weak closes. I went back to March, 2003 in the Dow Industrials and examined the last hour of trading and its effect upon the next day.
Overall for the sample, the average daily change in the Dow was .05% (401 up, 356 down). When the last hour of trading was up by .40% or more (N = 82), the market the next day averaged a loss of -.08% (40 up, 42 down). When the last hour of trading was down by .40% or more (N = 80), the market averaged a gain of .20% (48 up, 32 down).
We thus see modest evidence of reversal following weak and strong last hours of trade. As with market opens, we are seeing little evidence that strong or weak closes carry over to the next day of trading. If anything, such moves are more likely to produce retracement than continuation.
Overall for the sample, the average daily change in the Dow was .05% (401 up, 356 down). When the last hour of trading was up by .40% or more (N = 82), the market the next day averaged a loss of -.08% (40 up, 42 down). When the last hour of trading was down by .40% or more (N = 80), the market averaged a gain of .20% (48 up, 32 down).
We thus see modest evidence of reversal following weak and strong last hours of trade. As with market opens, we are seeing little evidence that strong or weak closes carry over to the next day of trading. If anything, such moves are more likely to produce retracement than continuation.
Friday, March 03, 2006
Weak Opens: What Comes Next
When the market opened lower today, a couple of traders asked me, "How low do you think we could go?" As Ayn Rand would say, "Check your premises!" Does a down open usually lead to a down trading day?
I went back to March, 2003 (N = 757) and found 42 days in which we opened down more than half a percent in SPY (as we did today). From the open to the close, the market was up 22 times, down 20, for an average gain of .18%. That is better than the average open-to-close change of .02% (403 up, 354 down) for the sample overall.
When, however, the down open follows a day's trading session (previous open to close) that is weak, the average change from open to close is .32% (11 up, 10 down). When the down open follows a day's trading session that is strong, the average change from open to close is .03% (11 up, 10 down).
A down open after the previous day is weak is thus not more likely to be strong, but its gains are larger than its losses. Under no circumstances, however, could I find evidence that a down open produces subnormal market performance from open to close. It pays to check those premises!
I went back to March, 2003 (N = 757) and found 42 days in which we opened down more than half a percent in SPY (as we did today). From the open to the close, the market was up 22 times, down 20, for an average gain of .18%. That is better than the average open-to-close change of .02% (403 up, 354 down) for the sample overall.
When, however, the down open follows a day's trading session (previous open to close) that is weak, the average change from open to close is .32% (11 up, 10 down). When the down open follows a day's trading session that is strong, the average change from open to close is .03% (11 up, 10 down).
A down open after the previous day is weak is thus not more likely to be strong, but its gains are larger than its losses. Under no circumstances, however, could I find evidence that a down open produces subnormal market performance from open to close. It pays to check those premises!
Thursday, March 02, 2006
Rising Gold, Rising Rates: Evidence of Changing Cycles?
The past two days we've seen interest rates on the 10-year Note rise by about 2% and gold stocks ($XAU) rise by over 4%. So I decided to take a look at what happens after two-day periods in which both rates ($TNX) and gold stocks rise by 2% or more.
Since March, 2003 (N = 749), we've had 32 days that meet the 2% criteria. Interestingly, four days later we see an average change in SPY of .70% (23 up, 9 down). That's quite a bit more bullish than the average four-day change for the sample of .25% (433 up, 316 down). We have to count that one for the bulls going forward.
One would think that an inflationary environment (rising gold, rising interest rates) might weigh on stocks. At least in the near term since 2003, that hasn't been the case. If we started seeing that pattern emerge, it would represent a key market shift. We've had 10 instances of 2% rises in rates and gold since 2005 and 6 have resulted in positive change in SPY four days later (average change = .22%). Thus the bullish pattern really isn't manifesting itself recently. This is worth keeping an eye on, as we might be seeing market sentiment re: inflation changing before our eyes.
Since March, 2003 (N = 749), we've had 32 days that meet the 2% criteria. Interestingly, four days later we see an average change in SPY of .70% (23 up, 9 down). That's quite a bit more bullish than the average four-day change for the sample of .25% (433 up, 316 down). We have to count that one for the bulls going forward.
One would think that an inflationary environment (rising gold, rising interest rates) might weigh on stocks. At least in the near term since 2003, that hasn't been the case. If we started seeing that pattern emerge, it would represent a key market shift. We've had 10 instances of 2% rises in rates and gold since 2005 and 6 have resulted in positive change in SPY four days later (average change = .22%). Thus the bullish pattern really isn't manifesting itself recently. This is worth keeping an eye on, as we might be seeing market sentiment re: inflation changing before our eyes.
Up Day, Down Open: Real-Time Update
At the time I'm writing this (7:56 AM CT), we're looking at a down open in SPY after an up day yesterday. I found 123 days since March, 2003 (N = 755) in which we were up more than .75%. When the market opened down the next day, the average change from open to close was .15% (26 up, 23 down). When the market opened up the next day, the average change from open to close was -.08% (35 up, 38 down). It thus appears that a down open does not necessarily mean that the day has a bearish cast after an up day and, in fact, may even be slightly bullish.
When the market opens, I then look to see which sectors are strong and weak and conduct lead-lag analyses to further update forecasts. This is the essence of dynamic modeling, as opposed to trading fixed models.
----------------------------------
9:54 AM (CT) Update - Notice how the semiconductor strength and then the breakout in the NYSE TICK with the buy programs in the Russell stocks preceded the S&P 500 move above its open. That made buying weakness in ES per the analysis above easier, knowing that these are strong lead relationships. I hope this opens readers' minds to different ways of looking at real time market action.
When the market opens, I then look to see which sectors are strong and weak and conduct lead-lag analyses to further update forecasts. This is the essence of dynamic modeling, as opposed to trading fixed models.
----------------------------------
9:54 AM (CT) Update - Notice how the semiconductor strength and then the breakout in the NYSE TICK with the buy programs in the Russell stocks preceded the S&P 500 move above its open. That made buying weakness in ES per the analysis above easier, knowing that these are strong lead relationships. I hope this opens readers' minds to different ways of looking at real time market action.
Wednesday, March 01, 2006
Up Open After Down Day: Sequence Analysis in Action
This is an important blog entry; you may want to review the posting from 2/26 (Sequence Analysis) before reading what I have here. The following is an example of sequence analysis at work.
Let's set the stage. After an up day on Monday which made a five-day high, we sold off on Tuesday and made a five-day low. Several of my analyses suggested a high likelihood of a down day today.
In sequence analysis, you always update forecasts with the most recently available data. This morning, the market opened up by more than a quarter of a percent. The updated forecast thus asked the question: What has happened historically when a down day has been followed by an up open? Specifically, I looked at occasions in which the market was down more than .75% on the day (N = 118) since March, 2003 (N = 755) and then divided the sample in half based on the following day's open.
When the next day's open is strong (as was the case today; N = 59), the average move from the open to the close has been .19% (38 up, 21 down). When the next day's open is weak (N = 59), the average move from the open to the close has been -.01% (33 up, 26 down).
Looking a bit further out, when the market opens strong after the down day, the move to the *following day's* close has been .41% (36 up, 23 down). When the market opens weak after the down day, the move to the *following day's* close has been -.06% (29 up, 30 down).
In short, a strong open following a weak day affects the market's short-term trajectory. This is an example of how updating forecasts with real time data can greatly aid trading. Traders need not wait for real time events to occur, however, to conduct these analyses. They can prepare for real time possibilities by conducting "what-if" scenarios with the historical data. Such sequence analysis would look at all historical occasions of market declines such as Tuesday's and then investigate what happened when the following day opened strong.
This captures the difference between mechanical system traders and historical pattern traders. Mechanical traders trade a model. Historical pattern traders conduct ongoing modeling as a dynamic process. Very, very few traders understand this and appreciate its potential.
Let's set the stage. After an up day on Monday which made a five-day high, we sold off on Tuesday and made a five-day low. Several of my analyses suggested a high likelihood of a down day today.
In sequence analysis, you always update forecasts with the most recently available data. This morning, the market opened up by more than a quarter of a percent. The updated forecast thus asked the question: What has happened historically when a down day has been followed by an up open? Specifically, I looked at occasions in which the market was down more than .75% on the day (N = 118) since March, 2003 (N = 755) and then divided the sample in half based on the following day's open.
When the next day's open is strong (as was the case today; N = 59), the average move from the open to the close has been .19% (38 up, 21 down). When the next day's open is weak (N = 59), the average move from the open to the close has been -.01% (33 up, 26 down).
Looking a bit further out, when the market opens strong after the down day, the move to the *following day's* close has been .41% (36 up, 23 down). When the market opens weak after the down day, the move to the *following day's* close has been -.06% (29 up, 30 down).
In short, a strong open following a weak day affects the market's short-term trajectory. This is an example of how updating forecasts with real time data can greatly aid trading. Traders need not wait for real time events to occur, however, to conduct these analyses. They can prepare for real time possibilities by conducting "what-if" scenarios with the historical data. Such sequence analysis would look at all historical occasions of market declines such as Tuesday's and then investigate what happened when the following day opened strong.
This captures the difference between mechanical system traders and historical pattern traders. Mechanical traders trade a model. Historical pattern traders conduct ongoing modeling as a dynamic process. Very, very few traders understand this and appreciate its potential.
Tuesday, February 28, 2006
Five Day High...Then Five Day Low

Yesterday we closed at a five-day high in SPY; today we closed at a five-day low. That's quite a reversal. I decided to consult the historical record and see what tends to happen next.
Perhaps the main finding is that this is a rare occurrence. I found only 9 such instances since January, 2003 (N = 790). That means that we need to take any analysis with multiple grains of salt.
Two days after the market made its five-day low (after having just made a five-day high), SPY was down by an average .17% (3 up, 6 down). That's quite a bit worse than the average two-day gain of .09% for the sample overall.
I have yet to compile my Demand/Supply numbers, but if they're as negative as I expect, that too would bode poorly for the bulls in the short run. Keep an eye on the Trading Psychology Weblog later tonight, and I'll have those numbers posted along with a brief analysis.
Monday, February 27, 2006
A New Look at Weak Energy Stocks and the S&P 500

For those who have requested the link, here is the article on first hour patterns in trading.
The relationship between the energy sector and the broad market indexes is a bit complicated. On one hand, you'd expect falling energy prices to benefit the economy and stocks. On the other hand, energy issues are well weighted within the major averages. For instance, since March, 2003 (N = 746), I find the correlation between the S&P 500 Index (SPY) and the energy ETF (XLE) to be .42. While this is significantly positive, it is lower than the correlations we see between many sectors and SPY.
We currently have an interesting situation in which SPY is up over the last four days by a little over three quarters of a percent, but XLE is down about 2.5%. Because such a move in different directions is relatively rare, I decided to take a historical look at what typically happens afterward.
Since March, 2003 (N = 746), we have had 111 occasions in which XLE has been down by more than 2% over a four-day period. Over the next four days, SPY has averaged a gain of .53% (72 up, 39 down). This is considerably stronger than the average four-day gain of .20% (359 up, 276 down) for the remainder of the sample.
Even more strikingly, we've had 32 days in which XLE has been down by 2% or more and SPY has been up over that period. Four days later, the average gain in SPY has been .83% (22 up, 11 down). This strength carries over to eight days out, with SPY up by an average 1.62% (27 up, 6 down). That is quite an edge.
It thus appears that strength in the S&P at a time of falling energy stock prices is bullish 1-2 weeks out. We'll count this one for the bulls going forward.
Sunday, February 26, 2006
Sequence Analysis and Lean Processes in Trading

On the Trader Performance blog, I recently posted an entry that looks at the process of defining and managing trade ideas from the perspective of lean manufacturing. One of the things I'm finding is that it is less difficult than I thought to identify trades that have a meaningful directional edge. If you have a good set of predictive measures, employ them properly over a truly representative lookback period, and then ensure that the relationships you identify apply to the entire lookback period, you can define an edge. The problem is managing this edge.
Let's say, apropos of my last analysis, that you find that a trade has a significant positive directional bias over the next ten days, with many more winning trades than losers. The question then becomes, over the next ten days, how do you determine whether or not the trade continues to possess its favorable edge? Suppose the market drops during the first two days of the trade period: do you continue to hold, add to the position, or exit? This is partly a question of risk management, but also a question of odds. If the two-day dip actually increases the odds of the trade going your way, exiting in the name of risk management seems perverse. It would be far better to start out with a position size that allows you to weather such adverse movement.
What I'm currently working on is something I call "sequence analysis". I examine every historical trade identified in my analyses and then walk them forward to identify the normal sequences of profits and losses. I'm specifically looking for key events that separate the winning trades from the losers, so that these could serve as rational exit points. To give but one simple example, if I find that 85% of all winning 10-day trades started out by being profitable in the first two days, I might not want to hold a loser after two days.
Sequence analysis becomes much more interesting and complex when you utilize predictors not in the original analysis to evaluate the likelihood that a historical pattern will repeat itself. For example, I might forecast a favorable ES over the next ten days based on the relative movements of Speculative and Non-Speculative stocks. My sequence analysis, however, may reveal that the vast majority of profitable trades occurred when the Adjusted TICK was positive in the first day of the 10-day period. That provides me with a tool for managing the trade. Do I really want to hold beyond the first day if the TICK is negative? Might I add to the trade if I see strength in the TICK?
We spend a lot of time studying entries, less time studying exits, but very little time truly studying the criteria that should keep us in or out of a trade. We might know the odds of success at the time we enter a trade, but can we update those odds based on current market movement to tell us whether to scale in or out? Sequence analysis would provide a rational basis for such updating, turning the management of trades into a lean process.
Saturday, February 25, 2006
More On Speculative Stocks - A Promising Predictor
What I'm finding in the very large baskets of Speculative and Non-Speculative issues that I am tracking is that they are more predictive of large index performance (such as ES, SPY, QQQQ, NQ) over longer timeframes than shorter ones. This has interesting implications for managing a trading portfolio to maximize opportunity. Increasingly I'm seeing where the common strategy of holding positions intraday only to minimize risk also minimizes important opportunities.
Let's take the current situation as an example. My basket of Speculative stocks is slightly down on the week. The Non-Speculative stocks, however, are up by over half a percent. Going back to March, 2003 (N = 743), I found 66 occasions in which the Spec stocks are down on the week by less than .40%. Ten days later, the S&P 500 Index (SPY) has been up by an average of .31% (41 up, 25 down), no different from the overall sample.
If we divide the sample in half based on the relative performance of Non-Spec stocks, a pattern emerges. When the Spec stocks are mildly weak on a five-day basis, but the Non-Spec stocks are strong (as at present), the next ten days in SPY are up by only .09% (17 up, 16 down). When the Spec stocks are mildly weak, but the Non-Spec stocks are weak, the next ten days in SPY are up by a whopping 1.22% (24 up, 9 down).
With the Non-Spec stocks leading the way at present, we'd have to count this as one for the bears going forward. We can see, however, that at holding periods of up to two weeks, the relative performance of Speculative issues and Non-Speculative issues seems to make quite a difference.
Let's take the current situation as an example. My basket of Speculative stocks is slightly down on the week. The Non-Speculative stocks, however, are up by over half a percent. Going back to March, 2003 (N = 743), I found 66 occasions in which the Spec stocks are down on the week by less than .40%. Ten days later, the S&P 500 Index (SPY) has been up by an average of .31% (41 up, 25 down), no different from the overall sample.
If we divide the sample in half based on the relative performance of Non-Spec stocks, a pattern emerges. When the Spec stocks are mildly weak on a five-day basis, but the Non-Spec stocks are strong (as at present), the next ten days in SPY are up by only .09% (17 up, 16 down). When the Spec stocks are mildly weak, but the Non-Spec stocks are weak, the next ten days in SPY are up by a whopping 1.22% (24 up, 9 down).
With the Non-Spec stocks leading the way at present, we'd have to count this as one for the bears going forward. We can see, however, that at holding periods of up to two weeks, the relative performance of Speculative issues and Non-Speculative issues seems to make quite a difference.
Friday, February 24, 2006
Semiconductors and QQQQ: An Example of Complexity
I've received quite a few emails regarding the last few entries dealing with lead-lag relationships between sectors/markets and the major trading indexes. Rarely are these relationships simple one-way affairs. Whether a sector leads or lags the trading index depends upon at least two crucial factors:
- Time Frame - A sector may be unrelated to an index on a very short-term basis, but still be predictive further out. For instance, many of the analyses are more powerful when predicting several days out than predicting next day.
- Whether the Predictor Sectors/Markets Are At Extremes or Moderate Values - Most often, a sector will not be equally predictive at very high and very low levels (extreme values) and at moderate levels. Analyses need to focus on a relevant segment of a predictor's distribution (a range of values similar to the current values), not the full distribution.
Here's a good example. We recently saw a leading relationship between the semiconductor stocks and the S&P 500. As of Friday's close, the semiconductor stocks (SMH) was down sharply on a two-day basis (down over 1.5%), while the NASDAQ 100 Index (QQQQ) was unchanged. In this situation, the SMH weakness ends up not leading the QQQQ lower. After a sharp two-day drop, most the indexes tend to rebound, which in this case would benefit the QQQQ.
We see that, since March, 2003 (N = 749), there were 90 days in which the two-day QQQQ neither rose nor fell by more than .20%. The next four days in QQQQ averaged a gain of .32% (51 up, 39 down), not significantly better than the average two-day gain of .30% for the sample overall.
When we split the sample in half based on SMH performance over the two days, we see a pattern. When SMH has been strong, the next four days in QQQQ average a gain of .11 (24 up, 21 down). When SMH has been weak (as recently), the next four days in QQQQ average a gain of .53% (27 up, 18 down). An examination of the data suggests that this occurs primarily because of a bounce back in SMH, which helps QQQQ.
What we're seeing is evidence of complexity. Trading relationships among sectors, stocks, and markets is not so simple as saying, "A leads B." One must specify the conditions under which there is a leading relationship. I have been encountering this same complexity with the earlier mentioned Speculative stocks and will report on that this weekend.
Thursday, February 23, 2006
Brokerage Stocks and the S&P: Another Leading Relationship
Here's another look at a market sector that has been exerting a lead relationship vis a vis the S&P 500 (SPY). It's the Broker-Dealer Index (XBD), which tracks the stocks of brokerage houses. One would think that if the XBD is healthy, that's a vote of confidence for the markets, and that should translate into favorable price action for SPY.
Over the past four days, we are essentially unchanged in SPY, but XBD is up by over 1%. I went back to March, 2003 (N = 744) and found 84 occasions in which SPY was neither up nor down more than .20% on a four-day basis. Over the next eight days, the average gain in SPY was .48% (52 up, 32 down). This compares with an average four-day gain in SPY of .50% (448 up, 296 down) for the sample overall. Clearly no great edge there.
When I divided the sample of little-changed SPY days in half, however, based on XBD performance, a pattern emerged. When XBD was strong, the next eight days in SPY averaged a very solid gain of .96% (31 up, 11 down). When XBD was weak, the next eight days in SPY averaged unchanged (21 up, 21 down). This suggests that bullish performance in XBD tends to anticipate bullish performance in SPY after we've had a narrow four days in the large caps. We'd have to count this as one for the bulls going forward.
Over the past four days, we are essentially unchanged in SPY, but XBD is up by over 1%. I went back to March, 2003 (N = 744) and found 84 occasions in which SPY was neither up nor down more than .20% on a four-day basis. Over the next eight days, the average gain in SPY was .48% (52 up, 32 down). This compares with an average four-day gain in SPY of .50% (448 up, 296 down) for the sample overall. Clearly no great edge there.
When I divided the sample of little-changed SPY days in half, however, based on XBD performance, a pattern emerged. When XBD was strong, the next eight days in SPY averaged a very solid gain of .96% (31 up, 11 down). When XBD was weak, the next eight days in SPY averaged unchanged (21 up, 21 down). This suggests that bullish performance in XBD tends to anticipate bullish performance in SPY after we've had a narrow four days in the large caps. We'd have to count this as one for the bulls going forward.
Wednesday, February 22, 2006
A Note on Trading Psychology
I just finished an email to someone at a trading firm in which I tried to summarize the essence of trading psychology in a single post. Here's the gist of what I had to say:
Under conditions of perceived risk and uncertainty (after all, what we react to is what we perceive) we no longer process information in our accustomed ways. At a brain level, regional cerebral blood flow shifts from the frontal cortex (our executive center) to motor centers that facilitate those famous flight or fight responses. This denies us access to our usual good planning, judgment, and decision making. As a result, we can end up making decisions that we look back upon in amazement: "What was I thinking?!" The answer, of course, is that we *weren't* thinking at the time. We were reacting: managing our perceptions of threat rather than the objective trades in front of us. Effective brief therapy for traders enables them to reprocess perceptions of risk and uncertainty, so that the blood shifts--and the associated state shifts that generate anxiety, frustration, and impulsive behavior--cannot occur.
My book The Psychology of Trading was an effort to explain this process and provide basic tools and techniques for traders to use under conditions of heightened risk and uncertainty. In the new book I'm currently writing, I will provide actual "therapy manuals" to help traders become their own therapists.
Anticipating market movements from historical studies provides a valuable edge in trading, but any edge is worthless if our states of mind prevent us from acting upon the information effectively. My hope is that the articles on my personal site, as well as the book, provide traders with some help on that front.
Under conditions of perceived risk and uncertainty (after all, what we react to is what we perceive) we no longer process information in our accustomed ways. At a brain level, regional cerebral blood flow shifts from the frontal cortex (our executive center) to motor centers that facilitate those famous flight or fight responses. This denies us access to our usual good planning, judgment, and decision making. As a result, we can end up making decisions that we look back upon in amazement: "What was I thinking?!" The answer, of course, is that we *weren't* thinking at the time. We were reacting: managing our perceptions of threat rather than the objective trades in front of us. Effective brief therapy for traders enables them to reprocess perceptions of risk and uncertainty, so that the blood shifts--and the associated state shifts that generate anxiety, frustration, and impulsive behavior--cannot occur.
My book The Psychology of Trading was an effort to explain this process and provide basic tools and techniques for traders to use under conditions of heightened risk and uncertainty. In the new book I'm currently writing, I will provide actual "therapy manuals" to help traders become their own therapists.
Anticipating market movements from historical studies provides a valuable edge in trading, but any edge is worthless if our states of mind prevent us from acting upon the information effectively. My hope is that the articles on my personal site, as well as the book, provide traders with some help on that front.
SOX and Stocks - Real Time
It's about 9 AM Chicago time as I'm writing this. The QQQQ opened higher this AM, but SMH was down on the open and some size was hitting bids in the semis. I know that there is a lead-lag relationship currently operative between "SOX and Stocks" so that alerted me to fade the opening strength rather than go with it. That trade idea paid out almost immediately in the first half hour.
Here's a further analysis: I looked back to March, 2003 and found 93 occasions in which the difference between SMH opened .5% or more weaker than QQQQ. From that open to the next day's close, the average price change in QQQQ was -.17% (38 up, 55 down), weaker than the average gain of .08% (380 up, 368 down) for the sample overall. Once again, we see SMH leading a relationship with a major stock average.
Applying these relationships to the proper time frames of trading is a big part of using them successfully. And, of course, one must keep in mind multiple lead-lag relationships, not just one involving a single trading instrument. When we see multiple leading relationships pointing the same way, that's when you can have real confidence in a trade idea.
Here's a further analysis: I looked back to March, 2003 and found 93 occasions in which the difference between SMH opened .5% or more weaker than QQQQ. From that open to the next day's close, the average price change in QQQQ was -.17% (38 up, 55 down), weaker than the average gain of .08% (380 up, 368 down) for the sample overall. Once again, we see SMH leading a relationship with a major stock average.
Applying these relationships to the proper time frames of trading is a big part of using them successfully. And, of course, one must keep in mind multiple lead-lag relationships, not just one involving a single trading instrument. When we see multiple leading relationships pointing the same way, that's when you can have real confidence in a trade idea.
Tuesday, February 21, 2006
SOX and Stocks: An Update
Much of my recent research posted here and on the Trading Markets site has dealt with lead-lag relationships in the market: identifying sectors that lead the major market indexes. One of my earliest investigations in this area was in an article I called "The SOX and the Stocks", in which I found that semiconductor stocks led the S&P 500 index.
I noticed today that, on a five-day basis, the S&P (SPY) is up by more than 1.6% but the semiconductor issues (SMH) is down by 1.35% over that same period. I decided to update my study by seeing what happens when these averages travel in different directions.
Since March, 2003 (N = 740), we have had 243 days in which SPY has been up more than 1% on a five-day basis. Five days later, SPY has averaged a gain of .17% (139 up, 104 down), considerably worse than the average gain of .30% (431 up, 309 down) for the sample overall.
When SPY has been up by more than 1% and SMH has been down more than 1% (N = 18), the next five days in SPY have averaged a loss of -.20% (9 up, 9 down). When SMH has been up more than 1% while SPY has also been up, the next have days in SPY have averaged a gain of .25% (109 up, 74 down).
It thus appears that strength in SPY is less likely to continue if it is not matched by strength in SMH--a factor we have to count as mildly bearish going forward.
Interestingly, I have found this relationship to hold on an intraday basis as well: It was the failure of SMH to break its previous day's highs early today that first alerted me to the possibility of a selloff.
I noticed today that, on a five-day basis, the S&P (SPY) is up by more than 1.6% but the semiconductor issues (SMH) is down by 1.35% over that same period. I decided to update my study by seeing what happens when these averages travel in different directions.
Since March, 2003 (N = 740), we have had 243 days in which SPY has been up more than 1% on a five-day basis. Five days later, SPY has averaged a gain of .17% (139 up, 104 down), considerably worse than the average gain of .30% (431 up, 309 down) for the sample overall.
When SPY has been up by more than 1% and SMH has been down more than 1% (N = 18), the next five days in SPY have averaged a loss of -.20% (9 up, 9 down). When SMH has been up more than 1% while SPY has also been up, the next have days in SPY have averaged a gain of .25% (109 up, 74 down).
It thus appears that strength in SPY is less likely to continue if it is not matched by strength in SMH--a factor we have to count as mildly bearish going forward.
Interestingly, I have found this relationship to hold on an intraday basis as well: It was the failure of SMH to break its previous day's highs early today that first alerted me to the possibility of a selloff.
Monday, February 20, 2006
Spec Stocks and the S&P: A Weekly View
This past week we saw the S&P 500 rise about 1.7% in a five day period. The performance of the Spec stocks was very similar. I decided to extend the recent investigations to a weekly basis by seeing what happens one week after a week in which SPY is up more than 1.5%.
Since March, 2003 (N = 744), we've had 156 days in which SPY has been up more than 1.5%. Five days later, the average gain for SPY has been .23% (91 up, 65 down), which is not greater than the five day average gain of .30% (435 up, 309 down) for the sample overall.
When we break the strong SPY days in half based on the relative performance of the Spec stocks, we see a similar pattern to one we've noticed with the daily data. When SPY is up more than 1.5% and Spec stocks are strong, the next five days in SPY average a gain of .35% (48 up, 31 down). When SPY is up strongly and Spec stocks are weak, the next five days in SPY average a gain of only .12% (43 up, 36 down).
I continue to refine my universe of Speculative and Non-Speculative issues and need to conduct more analyses with the Non-Spec group. Given that Spec stocks did not outperform SPY this past week, there is no bullish edge from this direction for the coming week.
On a separate note, check out my upcoming article for Trading Markets, which investigates SPY performance as a function of the Japanese market. I've also posted additional trading resources to the Trader Development page on my personal site.
Since March, 2003 (N = 744), we've had 156 days in which SPY has been up more than 1.5%. Five days later, the average gain for SPY has been .23% (91 up, 65 down), which is not greater than the five day average gain of .30% (435 up, 309 down) for the sample overall.
When we break the strong SPY days in half based on the relative performance of the Spec stocks, we see a similar pattern to one we've noticed with the daily data. When SPY is up more than 1.5% and Spec stocks are strong, the next five days in SPY average a gain of .35% (48 up, 31 down). When SPY is up strongly and Spec stocks are weak, the next five days in SPY average a gain of only .12% (43 up, 36 down).
I continue to refine my universe of Speculative and Non-Speculative issues and need to conduct more analyses with the Non-Spec group. Given that Spec stocks did not outperform SPY this past week, there is no bullish edge from this direction for the coming week.
On a separate note, check out my upcoming article for Trading Markets, which investigates SPY performance as a function of the Japanese market. I've also posted additional trading resources to the Trader Development page on my personal site.
Sunday, February 19, 2006
Speculative Stocks and the S&P 500
Continuing the investigations of the past couple of days, I redefined my Speculative and Non-Speculative stock universe to focus on larger companies more similar to those within the S&P 500. I also decided to compare Spec stock performance to the S&P 500 performance itself, rather than to Non-Spec performance.
In this study, I went back to March, 2003 (N = 746) and found 75 days in which SPY was up by 1% or more. Two days later, SPY was up by an average of .12% (44 up, 31 down). This is not significantly different from the average two-day gain in SPY for the sample overall: .12% (407 up, 339 down).
When I divided the strong SPY occasions in half, however, based on the relative performance of Spec stocks vs. SPY, a pattern again emerged--one compatible with my original hypothesis. When Spec stocks were strong, the next two days in SPY averaged a gain of .28% (24 up, 13 down). When Spec stocks were weak, the next two days in SPY averaged a loss of -.03% (20 up 18 down).
It thus appears that strength in the S&P 500 is more likely to continue in the short run when speculative stocks are outperforming the broad market. When speculative interest lags, strength in SPY is less likely to persist in the near term.
Using the same sample, I then looked at occasions when SPY was down by 1% or more (N = 72). Overall, when SPY has been weak in this manner, the next two days in SPY have averaged a gain of .30% (37 up, 35 down), stronger than the average two-day gain for the sample of .12% as outlined above.
When I divided the sample in half based on the relative performance of the Spec stocks vs. SPY, the pattern was more muted. When Spec stocks were relatively strong, the two days following a weak SPY averaged a gain of .36% (18 up, 18 down). When Spec stocks were relatively weak, the next two days averaged a gain of .23% (19 up, 17 down).
My next studies will look at the Non-Spec stocks; then I will extend the analyses to multi-day patterns.
In this study, I went back to March, 2003 (N = 746) and found 75 days in which SPY was up by 1% or more. Two days later, SPY was up by an average of .12% (44 up, 31 down). This is not significantly different from the average two-day gain in SPY for the sample overall: .12% (407 up, 339 down).
When I divided the strong SPY occasions in half, however, based on the relative performance of Spec stocks vs. SPY, a pattern again emerged--one compatible with my original hypothesis. When Spec stocks were strong, the next two days in SPY averaged a gain of .28% (24 up, 13 down). When Spec stocks were weak, the next two days in SPY averaged a loss of -.03% (20 up 18 down).
It thus appears that strength in the S&P 500 is more likely to continue in the short run when speculative stocks are outperforming the broad market. When speculative interest lags, strength in SPY is less likely to persist in the near term.
Using the same sample, I then looked at occasions when SPY was down by 1% or more (N = 72). Overall, when SPY has been weak in this manner, the next two days in SPY have averaged a gain of .30% (37 up, 35 down), stronger than the average two-day gain for the sample of .12% as outlined above.
When I divided the sample in half based on the relative performance of the Spec stocks vs. SPY, the pattern was more muted. When Spec stocks were relatively strong, the two days following a weak SPY averaged a gain of .36% (18 up, 18 down). When Spec stocks were relatively weak, the next two days averaged a gain of .23% (19 up, 17 down).
My next studies will look at the Non-Spec stocks; then I will extend the analyses to multi-day patterns.
Saturday, February 18, 2006
Speculative and Non-Speculative Stocks: Surprise Findings
To follow up on the Speculative and Non-Speculative stock research from my last posting, I decided to look at up days in the S&P 500 (SPY) and whether the relative performance of the Spec and Non-Spec stocks (many of which are not stocks in the S&P large cap universe) made a difference in future performance.
Since April, 2003 (N = 715), we had 69 days in which SPY was up by 1% or greater. Overall, the market was up by an average of .21% three days later (46 up, 23 down), a bit better than the average three-day gain of .16% (423 up, 292 down) for the sample overall.
I then broke the strong SPY days in half based upon the relative strength of the Spec stocks vs. the Non-Spec issues. (See yesterday's blog entry for a description of these stocks). To my surprise--and contrary to my initial hypothesis--when the Spec stocks were relatively strong, the next three days in SPY averaged a gain of only .05% (23 up, 12 down). When the Non-Spec stocks were relatively strong, the next three days in SPY averaged a gain of .36% (23 up, 11 down).
This suggests that strength in SPY is more likely to continue in the near term if Non-Speculative stocks (some of which are highly weighted in the S&P) are strong relative to Speculative issues.
When I examined weak S&P days--those down by 1% or more (N = 67) in the same sample--another interesting pattern emerged. Overall, when the market is down by over 1%, the next two days in SPY average a gain of .26% (34 up, 33 down). This is modestly better than the average two-day gain for the entire sample of .11% (392 up, 323 down).
When we divide the weak SPY days in half based on the relative strength of the Spec stocks, the results are eye-opening. When the Spec stocks are relatively strong during a weak day in SPY (N = 33), the next two days in SPY average a gain of .60% (20 up, 13 down). When the Spec stocks are relatively weak during a weak day in SPY (N = 34), the next two days in SPY average a loss of -.06% (14 up, 20 down).
This is quite a difference. It suggests that the S&P is more likely to rebound from weakness in the near term if Spec stocks are displaying relative strength. If Non-Spec stocks are relatively stronger, the weakness in SPY is more likely to continue in the short run.
In sum, a strong day in SPY is more likely to continue its rise if Non-Spec stocks are relatively strong. A weak day in SPY is more likely to reverse if Spec stocks are relatively strong. The latter effect appears stronger than the former.
I have much more exploration to do with this measure. The relationship between the relative performance of Spec and Non-Spec stocks and future market performance appears to be more complex than I initially envisioned. There are meaningful relationships here, and the key will be to identify and explain them. I will post more on this topic on my Trader Performance blog tonight.
Since April, 2003 (N = 715), we had 69 days in which SPY was up by 1% or greater. Overall, the market was up by an average of .21% three days later (46 up, 23 down), a bit better than the average three-day gain of .16% (423 up, 292 down) for the sample overall.
I then broke the strong SPY days in half based upon the relative strength of the Spec stocks vs. the Non-Spec issues. (See yesterday's blog entry for a description of these stocks). To my surprise--and contrary to my initial hypothesis--when the Spec stocks were relatively strong, the next three days in SPY averaged a gain of only .05% (23 up, 12 down). When the Non-Spec stocks were relatively strong, the next three days in SPY averaged a gain of .36% (23 up, 11 down).
This suggests that strength in SPY is more likely to continue in the near term if Non-Speculative stocks (some of which are highly weighted in the S&P) are strong relative to Speculative issues.
When I examined weak S&P days--those down by 1% or more (N = 67) in the same sample--another interesting pattern emerged. Overall, when the market is down by over 1%, the next two days in SPY average a gain of .26% (34 up, 33 down). This is modestly better than the average two-day gain for the entire sample of .11% (392 up, 323 down).
When we divide the weak SPY days in half based on the relative strength of the Spec stocks, the results are eye-opening. When the Spec stocks are relatively strong during a weak day in SPY (N = 33), the next two days in SPY average a gain of .60% (20 up, 13 down). When the Spec stocks are relatively weak during a weak day in SPY (N = 34), the next two days in SPY average a loss of -.06% (14 up, 20 down).
This is quite a difference. It suggests that the S&P is more likely to rebound from weakness in the near term if Spec stocks are displaying relative strength. If Non-Spec stocks are relatively stronger, the weakness in SPY is more likely to continue in the short run.
In sum, a strong day in SPY is more likely to continue its rise if Non-Spec stocks are relatively strong. A weak day in SPY is more likely to reverse if Spec stocks are relatively strong. The latter effect appears stronger than the former.
I have much more exploration to do with this measure. The relationship between the relative performance of Spec and Non-Spec stocks and future market performance appears to be more complex than I initially envisioned. There are meaningful relationships here, and the key will be to identify and explain them. I will post more on this topic on my Trader Performance blog tonight.
Friday, February 17, 2006
Potentially Explosive Research: Spec vs. Non Spec Stocks
The best market indicators, I've found, are the ones that are the least picked over. I can pretty much assure you that if an indicator can be readily created in a charting application, it is of limited predictive value. Been there, done that.
Good indicators, on the other hand, are conceptually grounded and are not easily replicated. The Demand/Supply Index on my Trading Psychology Weblog is an example. It is a straightforward measure of momentum, but is so broad--covering every operating company stock on the major exchanges-- and is so calculation intensive (requiring prices and volatility estimates at two different time frames for each issue) that it's unlikely to appear any time soon on the indicator menu of a trading app.
The indicator I'm working on now has considerable promise for these reasons. I divide a very large stock universe into two components: speculative and non-speculative. Spec stocks tend to be more volatile in their price behavior, younger as firms, more volatile in their earnings, more likely to trade at high price earnings ratios, less likely to pay dividends, and less likely to have a large percentage of their shares owned by institutions. Non-Spec stocks are less volatile, more established as companies, more stable in their earnings, more likely to trade at lower price earnings ratios, more likely to pay dividends, and more likely to have significant institutional coverage. As a whole, Spec stocks show better growth than Non-Spec stocks, but this may be a function of survivor bias. There are plenty of Spec stocks that show earnings declines, and plenty of Non-Spec stocks that show steady earnings gains.
In my first analysis, I created a synthetic market index consisting of half Spec stocks and half Non-Spec stocks. I then looked at occasions when price change in this index is narrow on the day (up or down less than .30%). Since April, 2003 (N = 715), we had 151 narrow days in the index. When the Spec issues were strong on those narrow days (N = 75), the next two days in the synthetic index were up by an average of .33% (47 up, 28 down). When the Non-Spec issues were strong on those narrow days (N = 76), the synthetic index over the next two days was up by an average of .03% (35 up, 41 down).
What this means is that both Spec and Non-Spec stocks (the synthetic index as a whole) perform better when relative strength is on the side of the Spec stocks. This makes sense: when sentiment is favorable in the market, traders will prefer Speculative issues. When sentiment is cautious, traders will lean toward safer, Non-Spec stocks.
There is much research to follow from this, including--of course--predicting the major market averages from the baskets of Spec and Non-Spec issues and creating a Spec Index indicator to track daily speculative sentiment in the market. I have a feeling this one is a winner.
Good indicators, on the other hand, are conceptually grounded and are not easily replicated. The Demand/Supply Index on my Trading Psychology Weblog is an example. It is a straightforward measure of momentum, but is so broad--covering every operating company stock on the major exchanges-- and is so calculation intensive (requiring prices and volatility estimates at two different time frames for each issue) that it's unlikely to appear any time soon on the indicator menu of a trading app.
The indicator I'm working on now has considerable promise for these reasons. I divide a very large stock universe into two components: speculative and non-speculative. Spec stocks tend to be more volatile in their price behavior, younger as firms, more volatile in their earnings, more likely to trade at high price earnings ratios, less likely to pay dividends, and less likely to have a large percentage of their shares owned by institutions. Non-Spec stocks are less volatile, more established as companies, more stable in their earnings, more likely to trade at lower price earnings ratios, more likely to pay dividends, and more likely to have significant institutional coverage. As a whole, Spec stocks show better growth than Non-Spec stocks, but this may be a function of survivor bias. There are plenty of Spec stocks that show earnings declines, and plenty of Non-Spec stocks that show steady earnings gains.
In my first analysis, I created a synthetic market index consisting of half Spec stocks and half Non-Spec stocks. I then looked at occasions when price change in this index is narrow on the day (up or down less than .30%). Since April, 2003 (N = 715), we had 151 narrow days in the index. When the Spec issues were strong on those narrow days (N = 75), the next two days in the synthetic index were up by an average of .33% (47 up, 28 down). When the Non-Spec issues were strong on those narrow days (N = 76), the synthetic index over the next two days was up by an average of .03% (35 up, 41 down).
What this means is that both Spec and Non-Spec stocks (the synthetic index as a whole) perform better when relative strength is on the side of the Spec stocks. This makes sense: when sentiment is favorable in the market, traders will prefer Speculative issues. When sentiment is cautious, traders will lean toward safer, Non-Spec stocks.
There is much research to follow from this, including--of course--predicting the major market averages from the baskets of Spec and Non-Spec issues and creating a Spec Index indicator to track daily speculative sentiment in the market. I have a feeling this one is a winner.
Thursday, February 16, 2006
Looking At Sector Leaders: Banks
Check out the Trading Markets site Friday AM; I should have a detailed article on this topic posted then. Over the past three sessions, we are up more than 2% in both SPY and the banking stock index BKX. I decided to look at what happens when this is the case.
Since March, 2003 (N = 743) we have had 50 days in which SPY has been up by more than 2%. Over the next five days, SPY has averaged a gain of .55% (33 up, 17 down), which is stronger than the average five-day gain of .30% (434 up, 309 down) for the sample overall.
Interestingly, however, when SPY and BKX are both up more than 2% in a three day period (N = 36), the next five days in SPY average a gain of .95% (24 up, 12 down). When SPY is up by more than 2% in a three-day period, but BKX is up less than 2% (N = 14), the next five days in SPY average a loss of -.48% (7 up, 7 down).
In short, the bullish prospects for SPY appear to be better when banking stocks are participating in market strength. We'll count this as a positive for the bulls going forward.
Since March, 2003 (N = 743) we have had 50 days in which SPY has been up by more than 2%. Over the next five days, SPY has averaged a gain of .55% (33 up, 17 down), which is stronger than the average five-day gain of .30% (434 up, 309 down) for the sample overall.
Interestingly, however, when SPY and BKX are both up more than 2% in a three day period (N = 36), the next five days in SPY average a gain of .95% (24 up, 12 down). When SPY is up by more than 2% in a three-day period, but BKX is up less than 2% (N = 14), the next five days in SPY average a loss of -.48% (7 up, 7 down).
In short, the bullish prospects for SPY appear to be better when banking stocks are participating in market strength. We'll count this as a positive for the bulls going forward.
Wednesday, February 15, 2006
Strong Stocks, Weak Oil: What Next?
In the past two days, the S&P 500 (SPY) has risen by over 1.4%, while the oil and gas stocks ($XOI) have dropped by over 1.26%. My thought was that this configuration would be bullish for SPY, as it suggests a favorable outlook for companies in the face of falling oil prices.
Since January, 2003 (N = 782), we have had 14 days in which the two-day SPY has been up by over 1% but the oil stocks have been down by .9% or more on a two-day basis. This is an unusual configuration, as daily price changes in SPY and XOI correlate by over .50. Five days later, SPY was up by an average 1.09% (10 up, 4 down). This is much stronger than the average five-day price change for the sample (.22%) and for periods in which SPY has been up by more than 1% over two days (.33%; N = 151).
This is admittedly a small sample, and in the very near term, it has not paid to buy stocks after a two-day runup. Still, the non-oil components of the weighted large cap indexes must be strong to overcome the weakness in the energy issues--strength that appears to carry over to the following several days of trading.
Since January, 2003 (N = 782), we have had 14 days in which the two-day SPY has been up by over 1% but the oil stocks have been down by .9% or more on a two-day basis. This is an unusual configuration, as daily price changes in SPY and XOI correlate by over .50. Five days later, SPY was up by an average 1.09% (10 up, 4 down). This is much stronger than the average five-day price change for the sample (.22%) and for periods in which SPY has been up by more than 1% over two days (.33%; N = 151).
This is admittedly a small sample, and in the very near term, it has not paid to buy stocks after a two-day runup. Still, the non-oil components of the weighted large cap indexes must be strong to overcome the weakness in the energy issues--strength that appears to carry over to the following several days of trading.
Tuesday, February 14, 2006
Strong Upward Momentum: What Follows
Readers of the Trading Psychology Weblog are familiar with the Demand/Supply measure, which is a proprietary indicator of momentum that I post daily to the site. Demand is the number of listed U.S. operating company stocks that closed above the volatility envelope surrounding both a short-term moving average and an intermediate-term average. These, therefore, are stocks with very strong price momentum. Supply is the number of issues that close below both averages. It is common for Demand and Supply to hit extremes prior to price peaks and valleys in the major averages.
Since the start of the bull market (N = 729), we have had 44 days in which the Demand reading has exceeded 120. (Tuesday's reading was over 130, reflecting the solid rally; please note that these are normalized values, not raw figures). Three days after such strong momentum, the market was up by an average of .52% (33 up, 11 down). This is much stronger than the average three day gain of .18% (432 up, 297 down) for the sample overall. Strong upside momentum tends to persist in the short run: this finding has been valid throughout the bull market.
Since the start of the bull market (N = 729), we have had 44 days in which the Demand reading has exceeded 120. (Tuesday's reading was over 130, reflecting the solid rally; please note that these are normalized values, not raw figures). Three days after such strong momentum, the market was up by an average of .52% (33 up, 11 down). This is much stronger than the average three day gain of .18% (432 up, 297 down) for the sample overall. Strong upside momentum tends to persist in the short run: this finding has been valid throughout the bull market.
Monday, February 13, 2006
Small and Midcap Stocks - Relative Performance
This is the first of my attempts to carefully separate out the small and mid cap universes by comparing the S&P 400 small caps ($SML) to the S&P 600 mid caps ($MID). I went back to March, 2004 (N = 482) and found 77 occasions in which SML was down by more than 1%--as was the case on Monday. I then investigated whether the relative performance of MID vs. SML had any impact on future short-term performance.
When SML has been down by 1% or more (N = 77), the next day in SML has averaged a gain of only .01% (41 up, 36 down). This offers no edge relative to the sample overall, which averages a gain of .06% (267 up, 215 down).
I then broke down the weak SML days in half based on MID performance. When SML was much weaker than MID (N = 38), the next day in SML averaged .20% (24 up, 14 down). When MID showed greater relative strength (N = 39), the next day in SML averaged a loss of -.18% (18 up, 21 down).
On Monday, SML was weak relative to MID, but not by a huge margin. Interestingly, it appears that, although SML and MID are highly correlated, relative weakness among the smallest stocks during a decline leads to a reversal, while relative strength leads to further weakness.
Because the Russell 2000 Index has components of both small and midcap issues, a differentiation of these might be helpful in predicting ER2 performance. That will be an upcoming project.
When SML has been down by 1% or more (N = 77), the next day in SML has averaged a gain of only .01% (41 up, 36 down). This offers no edge relative to the sample overall, which averages a gain of .06% (267 up, 215 down).
I then broke down the weak SML days in half based on MID performance. When SML was much weaker than MID (N = 38), the next day in SML averaged .20% (24 up, 14 down). When MID showed greater relative strength (N = 39), the next day in SML averaged a loss of -.18% (18 up, 21 down).
On Monday, SML was weak relative to MID, but not by a huge margin. Interestingly, it appears that, although SML and MID are highly correlated, relative weakness among the smallest stocks during a decline leads to a reversal, while relative strength leads to further weakness.
Because the Russell 2000 Index has components of both small and midcap issues, a differentiation of these might be helpful in predicting ER2 performance. That will be an upcoming project.
Sunday, February 12, 2006
Small Price Change, High Volatility
Friday's market closed only modestly higher after first dropping, then rising, and finally falling back toward its opening price. That had me looking at markets that are little changed but have above average daily trading ranges.
Since March, 2003 (N = 734), we have had 198 days in which SPY has closed within .20% of its opening price. Three days later, the market is up by an average .29% (120 up, 78 down). This is stronger than the average change of .15% (313 up, 223 down) for the remainder of the sample.
When we look at narrow SPY days as a function of volatility (daily range), however, a pattern emerges. When the range is wider (N = 99), the following three days average a gain of .40% (62 up, 37 down). When the range is narrower (N = 99), the following three days average a gain of .17% (58 up, 41 down). This suggests that wide range days with small price change have more favorable expectations than narrow days with small price change.
Interestingly, this pattern has continued throughout the recent bull market. Of the 12 occasions since August, 2004 in which we have had a range above 1% and narrow price change from open to close, 10 have shown gains over the next three days, averaging .71%. We'd have to score this one for the bulls as we start the new week.
Since March, 2003 (N = 734), we have had 198 days in which SPY has closed within .20% of its opening price. Three days later, the market is up by an average .29% (120 up, 78 down). This is stronger than the average change of .15% (313 up, 223 down) for the remainder of the sample.
When we look at narrow SPY days as a function of volatility (daily range), however, a pattern emerges. When the range is wider (N = 99), the following three days average a gain of .40% (62 up, 37 down). When the range is narrower (N = 99), the following three days average a gain of .17% (58 up, 41 down). This suggests that wide range days with small price change have more favorable expectations than narrow days with small price change.
Interestingly, this pattern has continued throughout the recent bull market. Of the 12 occasions since August, 2004 in which we have had a range above 1% and narrow price change from open to close, 10 have shown gains over the next three days, averaging .71%. We'd have to score this one for the bulls as we start the new week.
Saturday, February 11, 2006
A Longer-Term Look at the Market
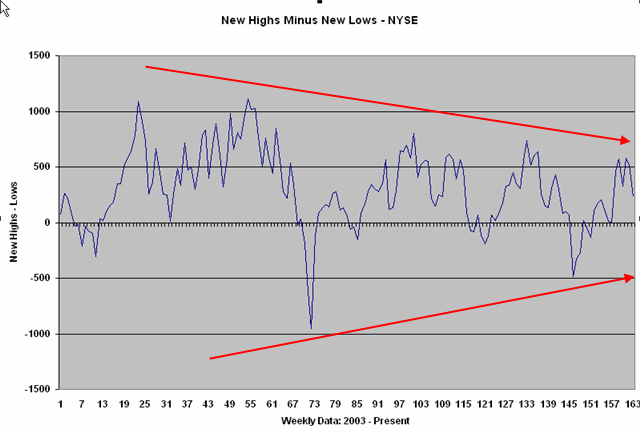 Here you can see weekly new highs minus weekly new lows for the NYSE, 2003 - present. The pattern is quite clear: we're seeing fewer stocks participate during market rallies, but we're also seeing modest levels of new lows. In all, this is consistent with low volatility market conditions, and it is also consistent with past bull market patterns.
In general, we see several phases to a market cycle. The earliest phase of the bull is one of great momentum, with a majority of issues participating and making new highs. As the bull matures, we continue to see price highs for most indices, but a declining number of individual issues making new highs. Late in the bull market, new lows will expand, new highs will dwindle, and the indices will fail to make new price highs on rallies. This sets up a phase of bear market selling, with new lows consistently exceeding new highs--interrupted by brief short-covering rallies--followed by a washout period of capitulation in which new lows vastly outnumber new highs.
Using this broad schematic, we can see that we're still in the phase of the bull where we have made new price highs but with decreased participation from individual stocks. It is normal to experience a pullback following such rallies; these bear swings are generally prefaced by an expansion in the number of stocks making new lows. As long as we do not see a more negative new high/low balance than was recorded at the October lows, I will not worry overmuch about the bull market. A signficant expansion of new lows would, IMHO, be of greater concern.
The aging of the bull is generally also heralded by shifts in market leadership. We saw this during the market peak around 2000-2001. Speculative favorites give way to more defensive stocks as economic concerns come to the fore. The current collapse of such favorites as GOOG and YHOO, as well as the gold and oil stocks, is on my radar for that reason.
In short, it looks to me as though we're in a mature bull market, but not one that is yet showing signs of imminent collapse. This doesn't affect my day-to-day trading outlook greatly, but is relevant to longer-term trading and investing horizons. I am very open to the possibility that the early January highs were the price highs for this bull market, but will not stay fixed in that view if the ES can sustain a low in the mid 1250s.
Friday, February 10, 2006
Thinking About Historical Analyses
I'll take a break today from the historical analyses to highlight several issues when using historical data to define possible trading edges:
1) All such analyses provide hypotheses only, not conclusions. The historical analyses are not "right" if they are replayed in the upcoming markets; nor are they "wrong" if the historical odds are not manifested on the next occasion. The historical studies merely indicate what has occurred in the past and whether such occurrences have been skewed or not. Our job is to use this information as background and see if the obtained patterns are indeed playing themselves out in the market. As I mentioned in a recent article for The Traders Journal in Singapore, Pasteur's observation that "Chance favors the prepared mind" captures the intent of historical study. It is meant as preparation--not as a fixed opinion to get locked into.
2) Disconfirmed hypotheses also provide information. Excellent trade ideas can be derived once you identify that a market is behaving contrary to its historical norms.
3) The utility and validity of historical analyses depends not only on having clean data and a promising set of indicators to study, but also on selecting proper lookback periods. The patterns that were common during the 2000-2002 bear market are not patterns we've seen in the past 2-3 years. Nor will the patterns of 2008 replicate those of the recent past. Recently, we've seen that patterns that were strong early in the current bull market (2003-4) are no longer robust. This means that we must weight recent data more strongly and be open to the possibility that we are undergoing a market transition. Indeed, shifts of trending and volatility patterns are perhaps the best evidence we have that market cycles are shifting.
4) The utility and validity of historical analyses also depends upon lookforward periods. Forecasting directional tendencies 1-3 days in the future requires a different set of predictors than forecasting 1-3 months or years hence. Of particular importance is what I call the optimum predictive horizon: the time frame that is most reliably forecast with a given set of predictors. This horizon, which almost always is not intraday, can help one define a directional bias within which shorter-term trading can occur.
5) Historical analyses are best employed in combination, with different sets of predictors and timeframes. Occasions in which multiple analyses converge to yield similar directional biases provide very high confidence trade ideas. Occasions when multiple analyses generate no meaningful directional biases help alert us to markets where our edge might be slim to none. Much of total P/L comes from trading known edges aggressively and staying away from risk when there is no edge--something any good poker player knows.
I will follow up with further thoughts on the Trader Performance blog of my personal site. Thanks for the many kind comments and suggestions I've received regarding the TraderFeed blog.
Brett
1) All such analyses provide hypotheses only, not conclusions. The historical analyses are not "right" if they are replayed in the upcoming markets; nor are they "wrong" if the historical odds are not manifested on the next occasion. The historical studies merely indicate what has occurred in the past and whether such occurrences have been skewed or not. Our job is to use this information as background and see if the obtained patterns are indeed playing themselves out in the market. As I mentioned in a recent article for The Traders Journal in Singapore, Pasteur's observation that "Chance favors the prepared mind" captures the intent of historical study. It is meant as preparation--not as a fixed opinion to get locked into.
2) Disconfirmed hypotheses also provide information. Excellent trade ideas can be derived once you identify that a market is behaving contrary to its historical norms.
3) The utility and validity of historical analyses depends not only on having clean data and a promising set of indicators to study, but also on selecting proper lookback periods. The patterns that were common during the 2000-2002 bear market are not patterns we've seen in the past 2-3 years. Nor will the patterns of 2008 replicate those of the recent past. Recently, we've seen that patterns that were strong early in the current bull market (2003-4) are no longer robust. This means that we must weight recent data more strongly and be open to the possibility that we are undergoing a market transition. Indeed, shifts of trending and volatility patterns are perhaps the best evidence we have that market cycles are shifting.
4) The utility and validity of historical analyses also depends upon lookforward periods. Forecasting directional tendencies 1-3 days in the future requires a different set of predictors than forecasting 1-3 months or years hence. Of particular importance is what I call the optimum predictive horizon: the time frame that is most reliably forecast with a given set of predictors. This horizon, which almost always is not intraday, can help one define a directional bias within which shorter-term trading can occur.
5) Historical analyses are best employed in combination, with different sets of predictors and timeframes. Occasions in which multiple analyses converge to yield similar directional biases provide very high confidence trade ideas. Occasions when multiple analyses generate no meaningful directional biases help alert us to markets where our edge might be slim to none. Much of total P/L comes from trading known edges aggressively and staying away from risk when there is no edge--something any good poker player knows.
I will follow up with further thoughts on the Trader Performance blog of my personal site. Thanks for the many kind comments and suggestions I've received regarding the TraderFeed blog.
Brett
Thursday, February 09, 2006
QQQQ: Reversal Days and Changing Cycles
Thursday's NASDAQ Index (QQQQ) turned in a reversal day, opening near the day's highs and closing near the lows. It was also a relatively wide range day compared to recent action, with a range slightly over 1.8%. We closed about 1.6% off the day's highs and .20% off the lows.
I examined days since March, 2003 (N = 733) to identify past occasions when we've closed off the highs by more than 1.5% and off the lows by less than .30% (N = 66). Three days after these reversal days, the market was up by an average of .50% (38 up, 28 down), stronger than the .22% (416 up, 317 down) for the sample overall.
When I broke the sample in half based on time, however, a pattern emerged. From May, 2004 to the present (N = 33), the average three-day change following a reversal day was .08% (18 up, 15 down). From March, 2003 through April, 2004, the average three-day change was .91% (20 up, 13 down).
Interestingly, returns following the reversal day were superior when the prior day was weak rather than strong. Both of these patterns fail to provide us with favorable near term bullish edges and, indeed, suggest subnormal returns in the short run.
I examined days since March, 2003 (N = 733) to identify past occasions when we've closed off the highs by more than 1.5% and off the lows by less than .30% (N = 66). Three days after these reversal days, the market was up by an average of .50% (38 up, 28 down), stronger than the .22% (416 up, 317 down) for the sample overall.
When I broke the sample in half based on time, however, a pattern emerged. From May, 2004 to the present (N = 33), the average three-day change following a reversal day was .08% (18 up, 15 down). From March, 2003 through April, 2004, the average three-day change was .91% (20 up, 13 down).
Interestingly, returns following the reversal day were superior when the prior day was weak rather than strong. Both of these patterns fail to provide us with favorable near term bullish edges and, indeed, suggest subnormal returns in the short run.
Wednesday, February 08, 2006
Put/Call Ratio: Does It Make A Difference?
I noticed that we continue to have a relatively high equity put/call ratio despite Wednesday's rise. The five-day put-call ratio is the highest we've seen in 2006. To see if the ratio makes a difference, I looked at all days since March, 2003 (N = 737) in which SPY was up over .5% and the one-day put/call ratio was over .75.
Overall, we've had 191 days in which SPY was up over .5%. When the put/call ratio was over .75 (N = 37), the market three days later was up by an average .51% (24 up, 13 down). When the put/call ratio was below .75, however, the market three days later was up by a subnormal .03% (86 up, 68 down). It appears that rises have a better chance of continuing to the upside in the short run when sentiment remains bearish, as is the case at present.
I will continue to investigate the equity put/call ratio and report results here and on my personal site. Note that this is the ratio for stocks only, eliminating the hedging bias from options transactions on indices.
Overall, we've had 191 days in which SPY was up over .5%. When the put/call ratio was over .75 (N = 37), the market three days later was up by an average .51% (24 up, 13 down). When the put/call ratio was below .75, however, the market three days later was up by a subnormal .03% (86 up, 68 down). It appears that rises have a better chance of continuing to the upside in the short run when sentiment remains bearish, as is the case at present.
I will continue to investigate the equity put/call ratio and report results here and on my personal site. Note that this is the ratio for stocks only, eliminating the hedging bias from options transactions on indices.
Tuesday, February 07, 2006
Weak Russell 2000 Index and the NYSE TICK
Tuesday saw a downside breakout and a loss of over 1.5% in the Russell 2000 stock average (IWM). I decided to look at what happens after large Russell declines of over 1.5% as a function of broad selling in the market. This selling, readers of my Trading Psychology Weblog know, is measured by the Adjusted TICK: the NYSE TICK adjusted for a zero mean.
Since July, 2003 (N = 653), we've had 64 days in which IWM has been down 1.5% or more. The next day, IWM has averaged a loss of -.03% (32 up, 32 down), which is weaker than the average daily gain of .08% (353 up, 300 down) for the sample overall.
When we divide the sample in half based on the Adjusted TICK, however, a pattern emerges. When the TICK is weak (N = 32), the next day in IWM averages a loss of -.22% (14 up, 18 down). When the TICK is strong (N = 32), the next day in IWM averages a gain of .16% (18 up, 14 down). Tuesday saw a TICK reading in the strong end of the sample, suggesting lesser odds of carryover selling on Wednesday.
Interestingly, when we look three days out after a weak day in IWM, expectations have been favorable. The market has averaged a three-day gain of .51% (39 up, 25 down), better than the average gain of .22% (384 up, 269 down) for the sample overall. In general, buying weakness after a weak day in IWM has been a solid strategy during the bull market.
Since July, 2003 (N = 653), we've had 64 days in which IWM has been down 1.5% or more. The next day, IWM has averaged a loss of -.03% (32 up, 32 down), which is weaker than the average daily gain of .08% (353 up, 300 down) for the sample overall.
When we divide the sample in half based on the Adjusted TICK, however, a pattern emerges. When the TICK is weak (N = 32), the next day in IWM averages a loss of -.22% (14 up, 18 down). When the TICK is strong (N = 32), the next day in IWM averages a gain of .16% (18 up, 14 down). Tuesday saw a TICK reading in the strong end of the sample, suggesting lesser odds of carryover selling on Wednesday.
Interestingly, when we look three days out after a weak day in IWM, expectations have been favorable. The market has averaged a three-day gain of .51% (39 up, 25 down), better than the average gain of .22% (384 up, 269 down) for the sample overall. In general, buying weakness after a weak day in IWM has been a solid strategy during the bull market.
Monday, February 06, 2006
Narrow, Slow Days In the QQQQ
Monday was a slow day in the market, with the NASDAQ 100 (QQQQ) Index moving in a roughly 1% range--about 2/3 the norm. The QQQQ also traded at about 70% of its average volume over the past 60 days, closing down .22% from open to close. I decided to take a look at slow, narrow days in QQQQ by going back to March, 2003 (N = 737) and investigating days in which the range was less than 1.2% and volume was 80% of the 60 day average or less. This provided a sample of 105 occasions.
As we might expect, the next day in QQQQ also tends to be slow. Fully 76 of the 105 occasions were below average in volume. This tended to produce reduced trading ranges; 74 of the occasions were below average in trading range.
Interestingly, when the narrow, slow day was down (N = 42), the market fared better the next day (average gain = .14%; 26 up, 16 down) than if the narrow slow day was up (N = 63; average loss = -.03%; 27 up, 36 down).
In short, narrow slowness tends to carry over to the next day for QQQQ, but price movement on the narrow slow day tends to reverse the following day.
As we might expect, the next day in QQQQ also tends to be slow. Fully 76 of the 105 occasions were below average in volume. This tended to produce reduced trading ranges; 74 of the occasions were below average in trading range.
Interestingly, when the narrow, slow day was down (N = 42), the market fared better the next day (average gain = .14%; 26 up, 16 down) than if the narrow slow day was up (N = 63; average loss = -.03%; 27 up, 36 down).
In short, narrow slowness tends to carry over to the next day for QQQQ, but price movement on the narrow slow day tends to reverse the following day.
Sunday, February 05, 2006
Weakness and Day-of-Week
I just submitted an article that should appear Monday AM on the Trading Markets site. This one looked at two-day declines of more than one percent and the returns expectable as a function of day-of-the-week. The bottom line was that, since 2003, Mondays, Tuesdays, and Fridays returned much better results than Wednesday and Thursday. Indeed, the latter two days barely were profitable. What was most interesting was that I obtained these exact same results from S&P 500 data going back to 1995. It is very difficult to believe that this is pure chance--occurring as it does over independent data samples going back over a decade--yet it is difficult to explain why certain days should perform differently from others. Would we see similar findings for market rises? For other time frames? Clearly this is an area that warrants further investigation. For what it's worth, weakness early in the week is particularly associated with reversals; weakness at the end of Wednesday or Thursday is not. Buying weakness at the end of Monday has worked particularly well since 2003. I will be following up on my personal site.
Saturday, February 04, 2006
Days of the Week: Do They Make a Difference?

Traders often refer to Fridays as bad trading days...Mondays fare almost as poorly in their reputation. But are there real differences in trading patterns from day to day?
I went back to January, 2003 and investigated results for each day of the week. My first finding was that volatility was about the same for the various days. There was no evidence that any particular day of the week had more movement than any other.
Since the beginning of 2003, we have gained almost 400 S&P points. Close to 70% of this total occurred on Monday and Tuesday. Wednesday showed very slightly negative returns, Thursday had the third best performance, and Friday was barely positive. Over 90% of all market gains since 2003 have occurred on Monday, Tuesday, and Thursday.
Here are the specific average daily changes:
Monday: .096% (83 up, 61 down, 155.21 points)
Tuesday: .081% (91 up, 69 down, 118.21 points)
Wednesday: -.003% (86 up, 74 down, -1.87 points)
Thursday: .065% (87 up, 69 down, 95.83 points)
Friday: .024% (83 up, 74 down, 28.93 points)
As you might guess, the best returns came from buying at the end of Wednesday and holding through Monday (.18%) or buying the end of Thursday and holding through Tuesday (.19%). Buying a down Friday and holding through Monday (a strategy that applies to the current market) has been quite a winning trade idea: average one-day price change is .21 (47 up, 24 down).
Friday, February 03, 2006
Two-Day Declines: Important, Shifting Expectations

Friday's market gave us an opportunity for an interesting analysis. We've been down two consecutive days, for a total decline of -1.65% on SPY. When we've been down two days in a row for a drop in excess of 1.5%, what happens next?
Since January, 2003 (N = 774), we've had 49 such two-day sequences. The next day, the market is up on average .14% (32 up, 17 down). This is stronger than the average one-day gain of .05% (430 up 344 down) for the sample overall. It thus looks as though a bounce is the normal expectation following two consecutive declines.
When we divide the sample by time, however, a different picture emerges. During 2003 (N = 25), the two-day declines led to a next-day average price change of .38% (18 up, 7 down)--quite strong. In 2004 and 2005, however (N = 24), the average next day change has been -.11% (14 up, 10 down).
If we look three days out, the pattern becomes even more pronounced. During 2003, the average change over the next three days following the two-day drop was .25% (15 up, 10 down). Since 2004, the average three-day change after a two-day drop was .08% (13 up, 11 down)--and in 2005 alone (N = 10), the average three-day change has been -.17% (3 up, 7 down)!
What this is telling us is that early in the bull market, expectations following a two-day drop were quite positive, but these positive expectations have been eroding. At present, based on 2004 and 2005 results, we cannot say that there is a distinctive upside edge following a large two-day decline, and there is even modest evidence of continuation to the downside.
Such sequential analyses of patterns are useful in identifying changing market cycles. This is very important.
Very.
Thursday, February 02, 2006
Quick Finding With the NYSE TICK
An upcoming article on the Trading Markets site will detail expectations when one-day declines are accompanied by very negative Adjusted TICK values. The Adjusted TICK is a staple of analysis on my personal site; it is the NYSE TICK adjusted to create a zero mean. The gist of the article is that days such as Thursday, which had a very weak Adjusted TICK and a decline in excess of 1%, have weaker expectations the following day than 1% declining days with stronger TICK readings. This, along with the relatively broad momentum weakness in the market, has me more cautious about the market upside than I would normally be after hitting a five-day low. (See previous entry).
Large Decline & A Five Day Low

Thursday's decline came very close to one of those strong momentum declines that we recently explored, and that would have us looking for more downside. The key 500 difference between stocks with extreme negative momentum and those with extreme positive momentum, however, was not quite reached. As a result, I tried a different analysis: What happens after the market, like Thursday, declines by more than 1% and closes at a five-day low?
Since the bull market began in 2003 (N = 728), we've had 55 days in which the market has dropped more than 1% and closed at a five-day low. Three days later, the market averaged a gain of .36% (35 up, 20 down), much better than the average three-day gain for the remainder of the sample (.17%; 396 up, 277 down). This finding of superior returns after X-day lows is similar to the findings from Larry Connors in his book "How Markets Really Work". Unlike strong momentum declines, which tend to persist in the short run, extended declines tend to reverse.
Wednesday, February 01, 2006
Broad Momentum Rises: What Happens Next?
Yesterday we saw that broad market declines--ones in which a large number of issues closed below the volatility envelopes surrounding their short-term moving averages--lead to further market weakness in the near term, while declines that are less broad are typically followed by reversal (as we saw in today's market).
In this analysis, we'll look at the same broad momentum variable and see if it is relevant to market rises. Since March, 2003 (N = 724), we've had 37 rising days in which the difference between the number of stocks closing above their short-term envelopes and the number of stocks closing below their envelopes has been 500 or greater. Three days later, SPY has been up by an average of .58% (27 up, 10 down). This is much stronger than the average three-day gain of .11% (207 up, 158 down) for other rising days. Indeed, when the market is up on less than broad momentum, the average three-day gain underperforms the sample overall (.18%; 430 up, 294 down).
What this suggests is that broad momentum leads to trend continuation in the short run, both to the downside and upside. Rising market days without broad momentum do not necessarily lead to market declines, but do offer subnormal returns in the near term. When markets rise on broad momentum, the moves tend to persist over the next several days.
In this analysis, we'll look at the same broad momentum variable and see if it is relevant to market rises. Since March, 2003 (N = 724), we've had 37 rising days in which the difference between the number of stocks closing above their short-term envelopes and the number of stocks closing below their envelopes has been 500 or greater. Three days later, SPY has been up by an average of .58% (27 up, 10 down). This is much stronger than the average three-day gain of .11% (207 up, 158 down) for other rising days. Indeed, when the market is up on less than broad momentum, the average three-day gain underperforms the sample overall (.18%; 430 up, 294 down).
What this suggests is that broad momentum leads to trend continuation in the short run, both to the downside and upside. Rising market days without broad momentum do not necessarily lead to market declines, but do offer subnormal returns in the near term. When markets rise on broad momentum, the moves tend to persist over the next several days.
Subscribe to:
Posts (Atom)


 Posts
Posts


