In the recent post, we took at look at short-term breadth strength and how that can help us identify opportunities associated with momentum and value. Now let's extend that view by exploring breadth strength at longer time horizons.
Using the same database with SPX, what we find is that when the percentage of stocks closing above their 20-day moving averages is in the highest quartile of the sample, the next five days average a gain of +.51%. When the percentage of stocks closing above their 20-day moving averages is in the lowest quartile of the sample, the next five days average a gain of +.33%. All other occasions actually average a loss of -.17%. In other words, in the rising market since 2014, essentially all short-term gains were achieved when the market was broadly strong and broadly weak. If we look at next 20-day returns, we find out that when stocks were most broadly strong, returns averaged +1.76%. When stocks were most broadly weak, returns averaged +.98%. All other occasions averaged a gain of only +.17%.
Now let's zoom out to the percentage of stocks closing above their 100-day moving averages. When we have had the greatest longer-term breadth strength, the next 20 days have averaged a whopping gain of +2.36%. When we have had the lowest level of breadth strength, the market has actually averaged a loss of -.33%. In other words, breadth strength at the longer time frame has brought considerable momentum, but low breadth strength has also shown a level of downside momentum--not value!
We're starting to see that edges are complex: the result of interplays among short, medium, and longer timeframes. That cannot be captured by a single chart pattern or indicator reading.
But let's take another look: We will divide the sample into quartiles based upon VIX readings. When VIX has been in its highest quartile, the next 20 days in SPX have averaged a large gain of +2.40%. The remainder of the sample has averaged a gain of only +.28%. So here we see a large value effect (weak and volatile markets leading to reversals) and relatively modest evidence of momentum. When we look at edges in the market, breadth strength matters but may show very different forward returns in low and high volatility regimes.
What I have found is that it's when short-term patterns of supply and demand, such as the ones described here and here and here, line up with the multi-day patterns of breadth strength and volatility that the best trading opportunities occur. There is a huge edge in clearly knowing where your edge lies.
Added 9/1/20:
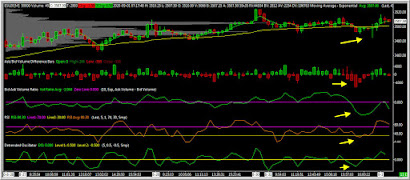
Notice how we closed 8/31 with fewer than 50% of SPX stocks above their 3- and 5-day moving averages, according to the Index Indicators site. That triggered the breadth signal from this post. We can see from the chart below that we were getting a good amount of volume hitting bids in the ES futures, taking us to a short-term oversold point at a higher price low. That is how price and volume behavior can confirm a signal from breadth. Note how we have since bounced in premarket trading.
Trading psychology cannot substitute for understanding the psychology of the market you're trading. Per Ms. Parker, when you hear someone say that your mindset is your edge, don't toss their advice aside lightly. Hurl it with great force.
.


