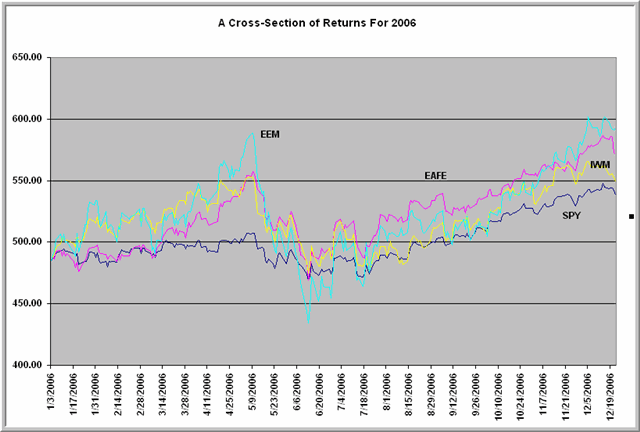
 Here we see market performance for four ETFs during 2006: the S&P 500 Index (SPY; dark blue line); the MSCI EAFE Index (EFA; red line); the Russell 2000 small cap index (IWM; yellow line); and the MSCI Emerging Markets Index (EEM; turquoise line). The ETFs have been adjusted for an equal market price at the start of 2006 to illustrate their relative performance.
Notice that two themes jump out:
1) International ETFs (EFA and EEM) have outperformed the U.S. market ETFs (SPY and IWM);
2) Smaller cap ETFs (EEM and IWM) have outperformed the larger cap ETFs.
What this means is that the large cap U.S. stocks have been the style cube laggards. We tend to think of those U.S. large caps as "the market", but in reality they are but one sector in a much larger global marketplace.
The chart also illustrates an obvious, but oft-neglected truth: Returns are a function of both what markets you're in and when you're in them. Superior returns have gone to those who invested in international markets and smaller cap shares. Note also, however, that had someone bought the emerging markets stocks or U.S. small caps near the May peak, their returns going forward would not have been impressive.
Indeed, one shift along the style cube that may have begun with that May decline is a shift away from the smaller-cap, more speculative world equity sectors toward large cap value stocks, both international and domestic. With the aging of the European and American baby boom cohorts, it would not be surprising to see a growing emphasis on "blue chip" reliability and dividend payment. The current shift away from growth and toward value may not be a short-term phenomenon, especially given the greater volatility of returns from small cap stocks and emerging markets.


