
The technical analysis literature on opening gaps in the market is filled with generalizations that may or may not be valid. Rarely do we see a hard statistical look at opening gaps. (A notable exception is the fine work of Jason Goepfert at the Sentimentrader site). So I thought I'd use Monday's example of a filled opening gap to explore the whole topic.
First off, let's establish what an opening gap means. I'm using SPY daily data and examining the disparity between where the index closed the previous day and where it opens today. We can attribute these gaps to news events overnight and the influence of overseas markets. The gap is also influenced by economic data that are reported prior to the New York open. Regardless of the cause, a large gap is an indication that market participants have shifted their valuation of stocks. When a gap is filled, it means that the initial revaluation was probably an overreaction. An unfilled gap suggests that the overnight events may have been of fundamental importance, driving a shift in investor perceptions regarding equities.
Going back to March, 1997 (N = 2375 trading days), the median opening gap--up or down--has been .29%. We have had 98 upside gaps of +1% or more; 83 downside gaps of -1% or more. The gap has been relatively small (less than .20% and greater than -.20%) on 854 occasions, or more than a third of the time. Of all days, 1760 (about three quarters of occasions) eventually touch the prior day's closing price during the day session, which means that any opening gap was filled.
The average size of an opening gap is highly sensitive to the market's overall volatility. When the VIX has been 20 or greater (N = 1382), the median size of the opening gap has been .39%. When the VIX has been under 20 (N = 993), the median gap has been .20%. Interestingly, the same proportion of gaps is filled under volatile and non-volatile conditions. That very strongly suggests to me that the odds of filling a gap of, say, .40% very much depend upon overall market volatility. The odds would be pretty good in a volatile market; much more remote in non-volatile markets. It might make sense, when analyzing gaps, to evaluate them as a proportion of recent daily range, rather than as an absolute price change.
We've had 452 days in which the VIX has been below 15. The median opening gap on those occasions has been .17%, with 341 filled gaps--that same 3/4 proportion. During those days, we've only had 28 occasions of an upside gap greater than .40%; 13 of these were filled. There were only 12 occasions of downside gaps less than -.40%; 8 of those were filled in the day session. It thus hasn't paid in low volatility markets to sell the open when we've had large gaps down, but it also hasn't been common that we've had large downside gaps in low volatility markets.
And when we've filled large upside gaps in low volatility markets (N = 13)? The following day in SPY has been up 10 times and down only 3. A filled upside gap has not necessarily been a bearish short-term indication for the market, contrary to common impression. More on this interesting topic to come, both here and on the Trading Psychology Weblog.
Added note (8:00 AM CT): Of the 28 occasions we've had large opening gaps (.40% or greater)in a low volatility market, the market was up from open to close 16 times, down 12 times, for an average SPY change of .08%--better than average. If, however, we look to the close of the following day, the market was up 18 times, down 10 for an above average gain of .20%. The average gain for the sample overall is only .01%.
Tuesday, August 15, 2006
Monday, August 14, 2006
What Trading Teaches Us About Life
Trading is a crucible of life: it distills, in a matter of minutes, the basic human challenge: the need to judge, plan, and seek values under conditions of risk and uncertainty. In mastering trading, we necessarily face and master ourselves. Very few arenas of life so immediately reward self-development--and punish its absence.
So many life lessons can be culled from trading and the markets:
1) Have a firm stop-loss point for all activities: jobs, relationships, and personal involvements. Successful people are successful because they cut their losing experiences short and ride winning experiences.
2) Diversification works well in life and markets. Multiple, non-correlated sources of fulfillment make it easier to take risks in any one facet of life.
3) In life as in markets, chance truly favors those who are prepared to benefit. Failing to plan truly is planning to fail.
4) Success in trading and life comes from knowing your edge, pressing it when you have the opportunity, and sitting back when that edge is no longer present.
5) Risks and rewards are always proportional. The latter, in life as in markets, requires prudent management of the former.
6) Happiness is the profit we harvest from life. All life's activities should be periodically reviewed for their return on investment.
7) Embrace change: With volatility comes opportunity, as well as danger.
8) All trends and cycles come to an end. Who anticipates the future, profits.
9) The worst decisions, in life and markets, come from extremes: overconfidence and a lack of confidence.
10) A formula for success in life and finance: never hold an investment that you would not be willing to purchase afresh today.
So many life lessons can be culled from trading and the markets:
1) Have a firm stop-loss point for all activities: jobs, relationships, and personal involvements. Successful people are successful because they cut their losing experiences short and ride winning experiences.
2) Diversification works well in life and markets. Multiple, non-correlated sources of fulfillment make it easier to take risks in any one facet of life.
3) In life as in markets, chance truly favors those who are prepared to benefit. Failing to plan truly is planning to fail.
4) Success in trading and life comes from knowing your edge, pressing it when you have the opportunity, and sitting back when that edge is no longer present.
5) Risks and rewards are always proportional. The latter, in life as in markets, requires prudent management of the former.
6) Happiness is the profit we harvest from life. All life's activities should be periodically reviewed for their return on investment.
7) Embrace change: With volatility comes opportunity, as well as danger.
8) All trends and cycles come to an end. Who anticipates the future, profits.
9) The worst decisions, in life and markets, come from extremes: overconfidence and a lack of confidence.
10) A formula for success in life and finance: never hold an investment that you would not be willing to purchase afresh today.


Sunday, August 13, 2006
Trader Performance: What Contributes to Profitability?
What makes a trader successful? I've spent probably as much time researching this question as researching the markets. It's a topic that has occupied my articles, my thinking about how to trade, and an entire section of my personal website--not to mention a book I've recently completed and due out this fall.
Part of the performance equation is continuous learning; turning ordinary experience into a platform for self-improvement. Part of it, too, is working on oneself and cultivating our ability to exploit edges in the marketplace and sustain our intentions. Many different problems can interfere with performance--trading woes as well as emotional ones--but hard work on these is not enough; we need to structure our development in the right ways. I've learned quite a bit from observing successful traders, including--alas--how fleeting that success can be if the trader's development process is not ongoing.
My return to regular trading in the past two months has provided a very hands-on sense for what contributes to performance. I started out a bit shaky, but have since maintained solid profitability. If I'm honest with myself, I have to say that I haven't really become better at making money. Rather, I've become better at not losing it. And I think that's an important distinction.
The chief factor that impacts my profitability, I believe, is my selectivity. There are some days--I can feel it!--when I sit down at the trade station and I'm eager to trade. Other days, I seem to hit that Zen place where I can let the trades come to me. It's like that line in Reminiscences of a Stock Operator: it's not the trading that's makes you money; it's the sitting. When I don't *need* to trade and stay selective, it's as if I allow a different part of my brain to synthesize all the research I've done and all the market action I'm seeing. Out of that synthesis, I get to the point where I truly *see* a trade developing. And I jump on board.
Here's the great dilemma of performance: It takes a phenomenal act of will to develop ourselves and become elite performers--and yet, at the moment of actual performance, we cannot will ourselves to win. The very act of trying to win--attempting to force victory--interferes with performance itself and our ability to access all of our accumulated experience. It takes, for example, considerable will to practice one hundred free throws at each basketball practice. The act of making a clutch free throw during an actual game, however, has to come effortlessly. Aim the ball--try to invoke will--and all you'll hear the the clunk of the ball against the rim.
So what is the key to performance success? Perhaps this: the ability to let go of will after having cultivated it throughout preparation. After so much effort pursuing success, the gold ring goes to those who allow success to find them.
Part of the performance equation is continuous learning; turning ordinary experience into a platform for self-improvement. Part of it, too, is working on oneself and cultivating our ability to exploit edges in the marketplace and sustain our intentions. Many different problems can interfere with performance--trading woes as well as emotional ones--but hard work on these is not enough; we need to structure our development in the right ways. I've learned quite a bit from observing successful traders, including--alas--how fleeting that success can be if the trader's development process is not ongoing.
My return to regular trading in the past two months has provided a very hands-on sense for what contributes to performance. I started out a bit shaky, but have since maintained solid profitability. If I'm honest with myself, I have to say that I haven't really become better at making money. Rather, I've become better at not losing it. And I think that's an important distinction.
The chief factor that impacts my profitability, I believe, is my selectivity. There are some days--I can feel it!--when I sit down at the trade station and I'm eager to trade. Other days, I seem to hit that Zen place where I can let the trades come to me. It's like that line in Reminiscences of a Stock Operator: it's not the trading that's makes you money; it's the sitting. When I don't *need* to trade and stay selective, it's as if I allow a different part of my brain to synthesize all the research I've done and all the market action I'm seeing. Out of that synthesis, I get to the point where I truly *see* a trade developing. And I jump on board.
Here's the great dilemma of performance: It takes a phenomenal act of will to develop ourselves and become elite performers--and yet, at the moment of actual performance, we cannot will ourselves to win. The very act of trying to win--attempting to force victory--interferes with performance itself and our ability to access all of our accumulated experience. It takes, for example, considerable will to practice one hundred free throws at each basketball practice. The act of making a clutch free throw during an actual game, however, has to come effortlessly. Aim the ball--try to invoke will--and all you'll hear the the clunk of the ball against the rim.
So what is the key to performance success? Perhaps this: the ability to let go of will after having cultivated it throughout preparation. After so much effort pursuing success, the gold ring goes to those who allow success to find them.
Saturday, August 12, 2006
Trading With the NYSE TICK - Part Three
In the first post in this series, I showed how the NYSE TICK fits into a common intraday trading setup. The second in the series illustrated how an ongoing assessment of the distribution of NYSE TICK values during the day provides a useful tracking of trader sentiment. In this final installment in the series, we'll take a multi-day look at the value of the NYSE TICK as a trading tool.
For this study, I use the Adjusted TICK statistic reported daily on the Trading Psychology Weblog. This is a daily average of the moment-to-moment TICK readings, adjusted to create a zero mean. As a result, positive numbers mean that there has been net buying sentiment on the day; negative numbers indicate the reverse. The correlation between this daily Adjusted TICK reading and daily price change in SPY has been over .70, suggesting that about half of all variance in price can be attributed to trader activity at the bid vs. offer across the universe of NYSE stocks.
Since July, 2003 (N = 774 trading days), I found 63 occasions in which the S&P 500 Index (SPY) was up by more than 1% on the day. Four days later, SPY was up on average by .07% (35 up, 28 down). That represents no bullish edge whatsoever relative to the average four-day SPY gain of .14% (432 up, 342 down) for the entire sample.
Now, however, let's factor the NYSE TICK into the mix. When SPY has been up by more than 1% *and* the NYSE TICK has been strong (N = 31), the next four days in SPY average a gain of .39% (22 up, 9 down). When SPY has been up by more than 1% and the TICK has been weak (N = 32), the next four days in SPY have averaged a loss of -.24% (13 up, 19 down). Clearly, the TICK makes a difference: a single day's TICK reading has bullish or bearish implications four days out.
How about when the S&P 500 (SPY) is weak on the day? We had 67 occasions in which SPY has been down by more than 1% in a single day since July, 2003. When the SPY was weak and the NYSE TICK was relatively strong (N = 34), the next four days in SPY average a gain of .39% (21 up, 13 down). When SPY was weak *and* the TICK was weak (N = 33), the next four days in SPY averaged a gain of only .03% (16 up, 17 down). Once again, we see that a single day's TICK reading exerts an influence several days out.
Now let's look at the TICK over multiple days. When the adjusted NYSE TICK averages more than +500 over a four-day period (N = 36), the *next* four days in SPY average a gain of .39% (23 up, 13 down). That is much stronger than the average four-day gain of .14%, as noted above. When the TICK averages less than -500 over a four-day period (N = 34), the next four days in SPY average a gain of .48% (23 up, 11 down)--again much stronger than average.
What we see is that very positive trader sentiment over a several day period tends to generate strength over the next several days, but very negative sentiment tends to lead to reversals. The bottom line is that the moment-to-moment lifting of offers and hitting of bids among traders does make a difference--even on a multi-day time frame.
For this study, I use the Adjusted TICK statistic reported daily on the Trading Psychology Weblog. This is a daily average of the moment-to-moment TICK readings, adjusted to create a zero mean. As a result, positive numbers mean that there has been net buying sentiment on the day; negative numbers indicate the reverse. The correlation between this daily Adjusted TICK reading and daily price change in SPY has been over .70, suggesting that about half of all variance in price can be attributed to trader activity at the bid vs. offer across the universe of NYSE stocks.
Since July, 2003 (N = 774 trading days), I found 63 occasions in which the S&P 500 Index (SPY) was up by more than 1% on the day. Four days later, SPY was up on average by .07% (35 up, 28 down). That represents no bullish edge whatsoever relative to the average four-day SPY gain of .14% (432 up, 342 down) for the entire sample.
Now, however, let's factor the NYSE TICK into the mix. When SPY has been up by more than 1% *and* the NYSE TICK has been strong (N = 31), the next four days in SPY average a gain of .39% (22 up, 9 down). When SPY has been up by more than 1% and the TICK has been weak (N = 32), the next four days in SPY have averaged a loss of -.24% (13 up, 19 down). Clearly, the TICK makes a difference: a single day's TICK reading has bullish or bearish implications four days out.
How about when the S&P 500 (SPY) is weak on the day? We had 67 occasions in which SPY has been down by more than 1% in a single day since July, 2003. When the SPY was weak and the NYSE TICK was relatively strong (N = 34), the next four days in SPY average a gain of .39% (21 up, 13 down). When SPY was weak *and* the TICK was weak (N = 33), the next four days in SPY averaged a gain of only .03% (16 up, 17 down). Once again, we see that a single day's TICK reading exerts an influence several days out.
Now let's look at the TICK over multiple days. When the adjusted NYSE TICK averages more than +500 over a four-day period (N = 36), the *next* four days in SPY average a gain of .39% (23 up, 13 down). That is much stronger than the average four-day gain of .14%, as noted above. When the TICK averages less than -500 over a four-day period (N = 34), the next four days in SPY average a gain of .48% (23 up, 11 down)--again much stronger than average.
What we see is that very positive trader sentiment over a several day period tends to generate strength over the next several days, but very negative sentiment tends to lead to reversals. The bottom line is that the moment-to-moment lifting of offers and hitting of bids among traders does make a difference--even on a multi-day time frame.
Friday, August 11, 2006
Trading With the NYSE TICK - Part Two
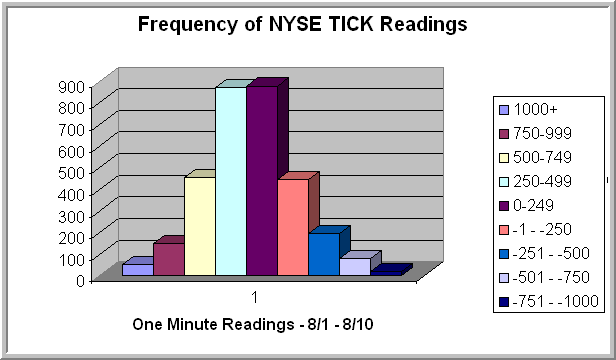
In my last post, I suggested that the NYSE TICK was an effective short-term measure of sentiment and illustrated a common trading setup utilizing the TICK. In this post, I'll show you an application of the TICK that you're unlikely to have encountered anywhere else.
The chart above displays the frequency of closing one-minute NYSE TICK readings for the past eight sessions. I used eight sessions as my lookback period, because the S&P 500 Index has been relatively flat during that period. What that tells me is that this distribution of TICK values (i.e., this distribution of trader short-term sentiment) has been associated with a relatively trendless S&P market.
Note that the median TICK value in the sample is not zero; it is +237. We also tend to have fatter tails on the positive side of the TICK than the negative. (Not shown on the chart are two data points below -1000).
Now how can we use this information to determine the psychology of the market?
My research suggests that, if the relatively flat trading action of the past eight sessions is going to transition to a trending market, we will need to see a shift in the distribution of NYSE TICK values. Such a shift indicates that either buyers are more aggressive in taking offers or in hitting bids. By comparing the distribution of today's TICK readings to the recent distribution, we conduct a running assessment of trader sentiment and whether it is bullish (more positively weighted than the past eight days), bearish (more negatively weighted than the past eight days), or neutral (similar to the past eight days).
It is the distribution of TICK values--and not any single reading in itself--that is significant, indicating shifts in trader sentiment. The beauty of the indicator is that it measures sentiment via trader actions, not their stated beliefs. By viewing TICK distributions in relative terms--comparing today's market to recent markets--we can learn more about those shifts in trader sentiment than we can by focusing on the absolute value of the TICK readings.
A quick and dirty way of accomplishing this is to subtract the median value of the TICK for the lookback period (+237) from each closing one-minute value. If this Adjusted TICK, when cumulated, creates a positive sloping line, you know you have net relative positive sentiment. If the summed values of the Adjusted TICK create a negatively sloping line, you know you have relatively bearish sentiment.
Composite NYSE TICK readings (adjusted for recent lookback periods) are summarized daily on the Trading Psychology Weblog. (Note: the Weblog measure uses 10 second readings of the TICK, not one-minute values). In the third post in this series, I will show how these composite readings make the TICK relevant and useful for longer timeframe traders. The best indicators, I find, are ones that tap into the psychology of the marketplace itself.
Thursday, August 10, 2006
Trading With the NYSE TICK
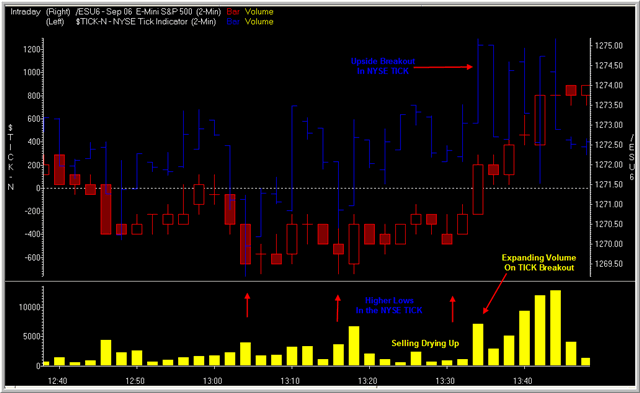
Here's a screen shot from my trade station. It's a little tough to see (click chart for better view), but the red candlesticks are the ES futures, the blue bars are the NYSE TICK, and the yellow bars are ES volume. Everything is in 2-minute increments.
The NYSE TICK tells us how many stocks are trading at their offer price minus those trading at their bid, and the figure is updated several times per minute.
It is a great measure of very short-term sentiment, because it captures the degree to which the broad market reflects aggressiveness of bulls (lifting offers) vs. bears (hitting bids).
Notice above that we make a low with the NYSE TICK dipping to the -600 region (first red arrow pointing up). At subsequent lows, we get higher negative readings in the TICK (next two red arrows). What is happening is that traders are less aggressive in hitting bids during that period. Moreover, volume in the ES is drying up with the selling.
That emboldens the bulls, who begin to lift offers and create an upside breakout in the TICK on increased volume. Catching that development was good for an excellent short-term trade. This setup occurs with daily regularity, as momentum swings from bears to bulls and back again.
Double Outside Days: What Happens Next?
As a kind reader alerted me, we had a rare situation on Wednesday in which the S&P 500 Index (SPY) made its second consecutive outside day. This means that we had a higher high each day and a lower low. What is equally interesting from my vantage point, and as the Trading Psychology Weblog figures note, is that we had more new 20-day highs each day *and* more 20-day new lows. Clearly there's a tug of war between bulls and bears in this market.
Going back to 1996 (N = 2637 trading days), I could only find 8 examples of back-to-back outside days in SPY. Three days after the double outside days, the market was up 6 times, down 2, for an average gain of 1.33%. That's much stronger than the average three-day gain of .11% for the entire sample. While this is too small a group of occurrences to stand on statistically, it's clear that bulls have tended to win the tug of war in the past when we've had double outside days.
Overall since 1996, we've had 286 outside days in SPY. Interestingly, on the next day, SPY has been down on average -.03% (155 up, 131 down), certainly no edge relative to the overall sample. By three days out, however, SPY is up on average by .23% (171 up, 115 down), which is again stronger than the average three-day change for the entire sample (.11%; 1431 up, 1206 down).
Perhaps the most relevant and interesting finding is that, when the market is down after an outside day (N = 131), the drop tends to be reversed in a majority of instances over the next several days. Four days later, for instance, SPY is up by an average of .66% (81 up, 50 down), which is stronger than the market's average four-day gain of .14% (1441 up, 1196 down).
In short, double outside days are rare, but have tended to lead to bullish outcomes. Outside days have tended to be bullish several days out and particularly if the day after an outside day is down. The market is steeply lower overnight as I write this and we've broken below an intermediate-term trading range, as the Weblog noted last night. Let's see if the breakout pattern overwhelms the outside day pattern.
Going back to 1996 (N = 2637 trading days), I could only find 8 examples of back-to-back outside days in SPY. Three days after the double outside days, the market was up 6 times, down 2, for an average gain of 1.33%. That's much stronger than the average three-day gain of .11% for the entire sample. While this is too small a group of occurrences to stand on statistically, it's clear that bulls have tended to win the tug of war in the past when we've had double outside days.
Overall since 1996, we've had 286 outside days in SPY. Interestingly, on the next day, SPY has been down on average -.03% (155 up, 131 down), certainly no edge relative to the overall sample. By three days out, however, SPY is up on average by .23% (171 up, 115 down), which is again stronger than the average three-day change for the entire sample (.11%; 1431 up, 1206 down).
Perhaps the most relevant and interesting finding is that, when the market is down after an outside day (N = 131), the drop tends to be reversed in a majority of instances over the next several days. Four days later, for instance, SPY is up by an average of .66% (81 up, 50 down), which is stronger than the market's average four-day gain of .14% (1441 up, 1196 down).
In short, double outside days are rare, but have tended to lead to bullish outcomes. Outside days have tended to be bullish several days out and particularly if the day after an outside day is down. The market is steeply lower overnight as I write this and we've broken below an intermediate-term trading range, as the Weblog noted last night. Let's see if the breakout pattern overwhelms the outside day pattern.
Wednesday, August 09, 2006
When the U.S. and EAFE Markets Move Together
A nice measure of how equities outside the U.S. are performing is the EAFE ETF (EFA), which taps into stocks across Europe & Australasia Far East. Normally, EFA correlates highly with the S&P 500 Index (SPY). Since March, 2003 (N = 857 trading days), the correlation of 10 day price moves in EFA and SPY has been .74.
Interestingly, when the U.S. and EAFE are highly correlated on a 10-day basis (.925 or greater; N = 84), the next 10 days in SPY average a gain of .87% (58 up, 26 down). This is stronger than the average 10-day gain of .53% (520 up, 339 down).
Conversely, when the U.S. and EAFE are loosely correlated on a 10-day basis (.50 or less; N = 92), the next ten days in SPY average a gain of only .19% (53 up, 39 down).
When the S&P has risen 2% or more in a 10-day period (N = 186), the next 10 days in SPY have averaged a gain of .41% (112 up, 74 down). When the correlation between the U.S. and EAFE has been above average, however (N = 93), the average 10-day gain has been only .25% (52 up, 41 down). When the correlation between the U.S. and EAFE has been below average (N = 93), the average 10-day gain has been stronger at .58% (60 up, 33 down).
What this suggests is that a world that moves in lockstep may have very different implications for future price change than a world that moves in separate directions. Moreover, this relationship appears to be different under bull and bear conditions. This is an area for fruitful research, I suspect.
Interestingly, when the U.S. and EAFE are highly correlated on a 10-day basis (.925 or greater; N = 84), the next 10 days in SPY average a gain of .87% (58 up, 26 down). This is stronger than the average 10-day gain of .53% (520 up, 339 down).
Conversely, when the U.S. and EAFE are loosely correlated on a 10-day basis (.50 or less; N = 92), the next ten days in SPY average a gain of only .19% (53 up, 39 down).
When the S&P has risen 2% or more in a 10-day period (N = 186), the next 10 days in SPY have averaged a gain of .41% (112 up, 74 down). When the correlation between the U.S. and EAFE has been above average, however (N = 93), the average 10-day gain has been only .25% (52 up, 41 down). When the correlation between the U.S. and EAFE has been below average (N = 93), the average 10-day gain has been stronger at .58% (60 up, 33 down).
What this suggests is that a world that moves in lockstep may have very different implications for future price change than a world that moves in separate directions. Moreover, this relationship appears to be different under bull and bear conditions. This is an area for fruitful research, I suspect.
Tuesday, August 08, 2006
Cumulative Demand/Supply Index: The Case for the Bears
On this blog and in the Trading Psychology Weblog, I have tracked an indicator that I call Demand and Supply. It consists of an index of the number of stocks trading with significant positive vs. negative momentum. A cumulative line of the daily Demand/Supply numbers has been a very helpful measure of overbought and oversold markets on an intermediate-term basis.
On Friday and Monday, we hit 50 on the Cumulative DSI Line, which is very overbought. When that has occurred (N = 30) since 2003 (N = 871 trading days), the next 10 days in SPY have averaged a loss of -1.34% (5 up, 25 down). That is a huge bearish edge, relative to the average 10-day performance of SPY (up .46%; 514 up, 357 down) for the entire sample.
In my last post, I found a bullish intermediate-term edge associated with the TRIN. Here I find quite a bearish edge. I post this because it is typical of the messiness associated with markets and historical analyses. It is the preponderance of evidence--not the results of any single analysis--that should drive trading and investment decisions.
On Friday and Monday, we hit 50 on the Cumulative DSI Line, which is very overbought. When that has occurred (N = 30) since 2003 (N = 871 trading days), the next 10 days in SPY have averaged a loss of -1.34% (5 up, 25 down). That is a huge bearish edge, relative to the average 10-day performance of SPY (up .46%; 514 up, 357 down) for the entire sample.
In my last post, I found a bullish intermediate-term edge associated with the TRIN. Here I find quite a bearish edge. I post this because it is typical of the messiness associated with markets and historical analyses. It is the preponderance of evidence--not the results of any single analysis--that should drive trading and investment decisions.
When Investors Don't Believe a Market Rise: High TRIN, High Price
As I mentioned in the Trading Psychology Weblog, we've had an unusual period during the past month in which volume has been concentrated in declining issues (as measured by the Arms Index or TRIN), but the price of the S&P 500 Index has been up. Specifically, over the last 15 trading sessions, we've gained more than 3%, but the average TRIN has been 1.10--and 11 of those 15 sessions have seen TRIN values above 1.0 (showing that the proportion of volume in declining issues is greater than the proportion of volume in advancers).
I went back to the beginning of 1990 to see how common this was (N = 4171 trading days). Since then, we've had 440 occasions in which 10 or more days out of 15 have had TRIN values above 1.0. This tends to occur in declining markets, as you might imagine: the average 15-day price change in the S&P 500 cash index is -2.58%. Fifteen days later, the S&P is down by an average -.14% (223 up, 217 down). That is much weaker than the average 15-day gain of .53% (2444 up, 1727 down) for the entire sample. In other words, when volume has been concentrated in declining issues over a three-week (15-day) period, the next three weeks have tended to underperform on a historical basis.
Interestingly, however, we've had 53 occasions in which there have been 10 or more days in a 15-day period with a TRIN above 1.0, but the S&P 500 Index has been *up* by more than 1% (similar to the current market). Fifteen days later, the S&P was up on average by .66% (32 up, 21 down). And when the S&P was up by more than 2% during a high TRIN 15-day period (N = 29), the market was up 15 days later by an average of 1.52% (22 up, 7 down)--quite an outperformance.
Think of it this way: When investors don't believe a rise, they continue selling the most liquid, high-volume stocks. This creates a situation in which TRIN is high, but price is up. If their selling cannot bring the market down, on average the market tends to go higher. It's when those investors are all buying the most liquid shares, driving TRIN down, that we have greater worries regarding a reversal. I will be watching carefully to see if this pattern plays out in the wake of the Fed meeting.
I went back to the beginning of 1990 to see how common this was (N = 4171 trading days). Since then, we've had 440 occasions in which 10 or more days out of 15 have had TRIN values above 1.0. This tends to occur in declining markets, as you might imagine: the average 15-day price change in the S&P 500 cash index is -2.58%. Fifteen days later, the S&P is down by an average -.14% (223 up, 217 down). That is much weaker than the average 15-day gain of .53% (2444 up, 1727 down) for the entire sample. In other words, when volume has been concentrated in declining issues over a three-week (15-day) period, the next three weeks have tended to underperform on a historical basis.
Interestingly, however, we've had 53 occasions in which there have been 10 or more days in a 15-day period with a TRIN above 1.0, but the S&P 500 Index has been *up* by more than 1% (similar to the current market). Fifteen days later, the S&P was up on average by .66% (32 up, 21 down). And when the S&P was up by more than 2% during a high TRIN 15-day period (N = 29), the market was up 15 days later by an average of 1.52% (22 up, 7 down)--quite an outperformance.
Think of it this way: When investors don't believe a rise, they continue selling the most liquid, high-volume stocks. This creates a situation in which TRIN is high, but price is up. If their selling cannot bring the market down, on average the market tends to go higher. It's when those investors are all buying the most liquid shares, driving TRIN down, that we have greater worries regarding a reversal. I will be watching carefully to see if this pattern plays out in the wake of the Fed meeting.
Monday, August 07, 2006
The Best Psychological Test of All
In my last post, I suggested that we may lose discipline in trading for the right reasons, not wrong ones. We naturally gravitate toward the intersection of our values, our abilities, and our skills: those arenas in which we can do good and do well. If we find ourselves veering from what we tell ourselves we *should* be doing, the answer may not be to "discipline" ourselves to our original path. Rather, it makes sense to view the loss of discipline as information and identify what it might be that we're moving *toward*.
But how can we know if we're truly operating in our ideal niches, whether in trading, romance, or careers? It turns out that there is a very simple psychological test that can provide this information.
Keep a journal of your emotional experience: how you are feeling at the end of your mornings, afternoons, and evenings. Make particular note of the number of occasions in which you were totally absorbed in what you were doing--so much so that you lost your sense of time passing and lost your awareness of yourself. Also make note of occasions in which you felt frustrated for any reason.
The result of your psychological test is simply the ratio of occasions in which you are absorbed to occasions in which you are frustrated. It turns out that highly creative, productive, and successful individuals have an unusually high ratio.
The reason for this is that these successful people are operating at that nexus of interests, talents, and skills. Because they're doing what they love and have the resources to do it well, they become wholly absorbed in their experience. This is the "flow" state described by Mihalyi Csikszentmihalyi: a pleasurable, altered state of consciousness, in which we feel at one with our situation.
During frustration, on the other hand, we are either doing something that doesn't interest us or something for which our skills and talents are poorly matched for the demands of the task. If task demands are too easy, we become frustrated with boredom. If task demands are excessive, we become frustrated by our inadequacies. Frustration divides subject and object; in flow, those are joined. It's the difference between a highly satisfying sexual experience and a highly unsatisfying one.
If you're operating in your proper niche, you will be experiencing a state of flow on a regular basis. You will be doing what you do well, and you will love and value what you're doing. That is true for the job you're in, the marriage you're in, and the trades you're in. That psychological test applies to most of life's arenas.
Too often, we justify frustration today by the vague hope of fulfillment tomorrow. In my book, I mentioned the Kansas bar near my home where a neon sign promised "Free Beer Tomorrow". Of course, naive patrons who returned the next day were always told that the free beer was, indeed, tomorrow.
In the end, life is a succession of situations: careers you're in, people you know, relationships you enter, markets you trade. You are your situation: you always experience the fit--or lack of fit--between who you are and what you're doing. Successful people find good fits in life: their situations bring flow. Taking your emotional temperature at the end of trading days--assessing your periods of flow and frustration--will tell you a great deal as to whether or not you're in the right markets, with the right methods, in the right timeframes, with the right skills.
Don't settle.
But how can we know if we're truly operating in our ideal niches, whether in trading, romance, or careers? It turns out that there is a very simple psychological test that can provide this information.
Keep a journal of your emotional experience: how you are feeling at the end of your mornings, afternoons, and evenings. Make particular note of the number of occasions in which you were totally absorbed in what you were doing--so much so that you lost your sense of time passing and lost your awareness of yourself. Also make note of occasions in which you felt frustrated for any reason.
The result of your psychological test is simply the ratio of occasions in which you are absorbed to occasions in which you are frustrated. It turns out that highly creative, productive, and successful individuals have an unusually high ratio.
The reason for this is that these successful people are operating at that nexus of interests, talents, and skills. Because they're doing what they love and have the resources to do it well, they become wholly absorbed in their experience. This is the "flow" state described by Mihalyi Csikszentmihalyi: a pleasurable, altered state of consciousness, in which we feel at one with our situation.
During frustration, on the other hand, we are either doing something that doesn't interest us or something for which our skills and talents are poorly matched for the demands of the task. If task demands are too easy, we become frustrated with boredom. If task demands are excessive, we become frustrated by our inadequacies. Frustration divides subject and object; in flow, those are joined. It's the difference between a highly satisfying sexual experience and a highly unsatisfying one.
If you're operating in your proper niche, you will be experiencing a state of flow on a regular basis. You will be doing what you do well, and you will love and value what you're doing. That is true for the job you're in, the marriage you're in, and the trades you're in. That psychological test applies to most of life's arenas.
Too often, we justify frustration today by the vague hope of fulfillment tomorrow. In my book, I mentioned the Kansas bar near my home where a neon sign promised "Free Beer Tomorrow". Of course, naive patrons who returned the next day were always told that the free beer was, indeed, tomorrow.
In the end, life is a succession of situations: careers you're in, people you know, relationships you enter, markets you trade. You are your situation: you always experience the fit--or lack of fit--between who you are and what you're doing. Successful people find good fits in life: their situations bring flow. Taking your emotional temperature at the end of trading days--assessing your periods of flow and frustration--will tell you a great deal as to whether or not you're in the right markets, with the right methods, in the right timeframes, with the right skills.
Don't settle.
Sunday, August 06, 2006
Discipline and Devotion
No issue so pervades the trading psychology literature as that of "discipline". It is very common for traders to lay their plans and define their setups, only to find that their actions undermine their careful preparation.
A good deal of the advice dispensed by trading coaches and psychologists addresses this discipline problem.
But what if the lack of discipline is not a problem? What if we view departures from trading plans and intentions as *information*, not as weakness? As it turns out, those departures can be quite informative.
You see, we naturally gravitate toward the nexus of our values (interests), talents (native abilities), and skills (acquired competencies). On average, we tend to enjoy doing what we're good at and we tend to build skills when there is a foundation of talents to support them. The artist who spends long hours at the canvas doesn't have to draw upon "discipline" to sustain an interest in painting. The hard work is hard play: the discipline stems from a devotion to a craft--and to the ability of that craft to crystallize the artists' interests, talents, and skills.
My son Macrae labors over writing assignments in school. It takes quite a bit of discipline to get the work done. It's not where his interests, talents, and skills are conjoined. He will focus on video games, however, for hours at a time and master a new game in a single day. The action of the game story line, combined with the demand for quick response and rapid recognition, create a kind of devotion that makes discipline unnecessary.
When we veer from our market discipline, there's an important piece of information in that. Our trading style (or maybe even trading in general) is more like my son's writing than his video gaming. If we pursue a market and a trading style that truly capture our interests and exercise our talents and skills, we will be as absorbed in what we do as the artist or gamer. The lack of devotion--and our need to invoke discipline as motivation--informs us that we are not doing what we are meant to be doing.
My favorite example of this occurred when I first tried to trade on a full-time basis. I stayed in touch with other traders by IM and soon found myself spending more time interacting with them (and helping them with their trading) than following the market myself. Incredibly, I missed quite a few good trades because of the volume of my messaging.
Was my "lack of discipline" a weakness? No! It reflected my strengths. I'm a psychologist for a reason: that's where my values, talents, and skills come together. We will always gravitate toward what *means* the most to us--and many times that will take us away from the things we tell ourselves we *should* be doing. The answer is not more discipline; it's to pursue our devotion.
There's something on this Earth you're meant to do and, when you find it, you won't need discipline to make you pursue it. The greats, to paraphrase Ed Seykota, don't have talents; the talents have them. If you're veering from your path, figure out what you're heading toward. You may just find your passion.
A good deal of the advice dispensed by trading coaches and psychologists addresses this discipline problem.
But what if the lack of discipline is not a problem? What if we view departures from trading plans and intentions as *information*, not as weakness? As it turns out, those departures can be quite informative.
You see, we naturally gravitate toward the nexus of our values (interests), talents (native abilities), and skills (acquired competencies). On average, we tend to enjoy doing what we're good at and we tend to build skills when there is a foundation of talents to support them. The artist who spends long hours at the canvas doesn't have to draw upon "discipline" to sustain an interest in painting. The hard work is hard play: the discipline stems from a devotion to a craft--and to the ability of that craft to crystallize the artists' interests, talents, and skills.
My son Macrae labors over writing assignments in school. It takes quite a bit of discipline to get the work done. It's not where his interests, talents, and skills are conjoined. He will focus on video games, however, for hours at a time and master a new game in a single day. The action of the game story line, combined with the demand for quick response and rapid recognition, create a kind of devotion that makes discipline unnecessary.
When we veer from our market discipline, there's an important piece of information in that. Our trading style (or maybe even trading in general) is more like my son's writing than his video gaming. If we pursue a market and a trading style that truly capture our interests and exercise our talents and skills, we will be as absorbed in what we do as the artist or gamer. The lack of devotion--and our need to invoke discipline as motivation--informs us that we are not doing what we are meant to be doing.
My favorite example of this occurred when I first tried to trade on a full-time basis. I stayed in touch with other traders by IM and soon found myself spending more time interacting with them (and helping them with their trading) than following the market myself. Incredibly, I missed quite a few good trades because of the volume of my messaging.
Was my "lack of discipline" a weakness? No! It reflected my strengths. I'm a psychologist for a reason: that's where my values, talents, and skills come together. We will always gravitate toward what *means* the most to us--and many times that will take us away from the things we tell ourselves we *should* be doing. The answer is not more discipline; it's to pursue our devotion.
There's something on this Earth you're meant to do and, when you find it, you won't need discipline to make you pursue it. The greats, to paraphrase Ed Seykota, don't have talents; the talents have them. If you're veering from your path, figure out what you're heading toward. You may just find your passion.
Saturday, August 05, 2006
Signs of a Risk-Averse Market
Back in the late 1990s, the NASDAQ was perceived as the stock exchange representing high growth as well as high tech. Ah, what a difference a few years makes. On Friday, we had 181 NYSE stocks making new 52-week highs, according to the excellent Barchart site. A total of 24 NYSE issus made fresh 52-week lows. On the NASDAQ, only 81 stocks made new highs, against 71 new lows.
If we just look at the S&P 500, we see that 43 stocks made new 52-week highs, against 6 new lows. Among the NASDAQ 100 issues, 7 made new highs and 1 made a new low.
Fully three-quarters of all S&P energy stocks are trading above their 50-day moving averages, and over 50% of all S&P 500 stocks. Alas, only about a third of NASDAQ issues are displaying comparable strength.
But it's not just the NASDAQ. Signs of a risk averse market abound. The top four performing sectors, according to Barchart, are gold, silver, soft drink/beverages, and copper. According to Decision Point, the top three Rydex sector funds in terms of assets are Energy Services (228.3 million), Precious Metals (209.7 million), and Energy (175.3 million). No other sector reaches 100 million dollars in assets. Technology? It's down to 16.8 million. Internet? 3.9 million.
The ratio of Rydex bear fund assets plus money market assets to bull market assets is 1.09, in Decision Point's latest tally. Traders are not pouring money into Energy Services, Precious Metals, and Energy because they love stocks. They are making big bets on Dollar Armageddon, just as daytraders back in the day made big bets on the Internet.
In such an environment, big is better because it's perceived as safer. Of stocks trading above $10 a share, 289 made new 52-week highs on Friday and only 49 new lows. But stocks trading under $10? 19 new 52-week highs and 78 new lows. The percentage of S&P 600 small-cap stocks trading above their 50-day moving averages has lagged that of the large cap S&P stocks since May--as has the small-cap advance-decline line vs. that of the large caps.
During the early part of the recent bull market, small and midcap stocks led the way up. That is no longer the case. Value stocks among the S&P 500 have recently trounced growth issues, and value funds in the Rydex attract far more assets than growth. It's a risk-averse mentality, and it's one of the few things keeping my own bearishness in check. If there's one truism in finance, it's that markets do not reward systematic risk aversion.
If we just look at the S&P 500, we see that 43 stocks made new 52-week highs, against 6 new lows. Among the NASDAQ 100 issues, 7 made new highs and 1 made a new low.
Fully three-quarters of all S&P energy stocks are trading above their 50-day moving averages, and over 50% of all S&P 500 stocks. Alas, only about a third of NASDAQ issues are displaying comparable strength.
But it's not just the NASDAQ. Signs of a risk averse market abound. The top four performing sectors, according to Barchart, are gold, silver, soft drink/beverages, and copper. According to Decision Point, the top three Rydex sector funds in terms of assets are Energy Services (228.3 million), Precious Metals (209.7 million), and Energy (175.3 million). No other sector reaches 100 million dollars in assets. Technology? It's down to 16.8 million. Internet? 3.9 million.
The ratio of Rydex bear fund assets plus money market assets to bull market assets is 1.09, in Decision Point's latest tally. Traders are not pouring money into Energy Services, Precious Metals, and Energy because they love stocks. They are making big bets on Dollar Armageddon, just as daytraders back in the day made big bets on the Internet.
In such an environment, big is better because it's perceived as safer. Of stocks trading above $10 a share, 289 made new 52-week highs on Friday and only 49 new lows. But stocks trading under $10? 19 new 52-week highs and 78 new lows. The percentage of S&P 600 small-cap stocks trading above their 50-day moving averages has lagged that of the large cap S&P stocks since May--as has the small-cap advance-decline line vs. that of the large caps.
During the early part of the recent bull market, small and midcap stocks led the way up. That is no longer the case. Value stocks among the S&P 500 have recently trounced growth issues, and value funds in the Rydex attract far more assets than growth. It's a risk-averse mentality, and it's one of the few things keeping my own bearishness in check. If there's one truism in finance, it's that markets do not reward systematic risk aversion.
Friday, August 04, 2006
Seeing The Gorillas in the Middle of the Market
Laurence Gonzales, in his fascinating book "Deep Survival: Who Lives, Who Dies, and Why", describes a research study from Harvard psychologists. They showed people a film of basketball players passing the ball to each other. During the film, a man in a gorilla costume walks into the middle of the action and stays visible on the screen for about five seconds. One group of subjects is asked to count the number of passes among the players; the other group is simply asked to watch the film. Incredibly, 56% of the subjects who count the passes don't ever see the gorilla. Of course, everyone asked to simply watch the film notices the gorilla man on the basketball court.
The point is that the brain is a kind of search engine: a Googler of reality. If we program our search to look for passes among basketball players, that's the output we receive from the brain. What is extraneous to our search (gorillas) is eliminated. When we conduct a broad search, we receive a wider range of outputs. Focused searches work well if we're looking for a specific item, such as lost car keys. They don't work so well when we need to process all of the information needed to survive in an environment of risk and uncertainty.
It is very easy to approach the markets in focused search mode. We develop a hypothesis about the market (bullish or bearish) and we prime ourselves to look for certain chart patterns or indicator readings. In our haste to find what we're looking for, we can miss the gorillas in the middle of the market. Afterwords, we might look back on market action and think, "How in the *&#@ could I have missed that??!!"
Gonzales writes, "The practice of Zen teaches that it is impossible to add anything more to a cup that is already full. If you pour in more tea, it simply spills over and is wasted. The same is true of the mind. A closed attitude, an attitude that says, 'I already know', may cause you to miss important information. Zen teaches openness. Survival instructors refer to that quality of openness as 'humility'. In my experience, elite performers, such as high-angle rescue professionals, who risk their lives to save others, have an exceptional balance of boldness and humility..." (p. 91).
There is a concise formula for trading success: boldness and humility. The boldness to act on what you see with the conviction, and the humility to realize that what you see may not be all that is there.
Notice how so many of the excellent market bloggers--Charles Kirk and Trader Mike come readily to mind--track a variety of sectors and indices, examining the market from multiple angles. They're not just looking for the passes on the basketball court; they want to make sure they're not missing any gorillas in the picture.
It's those gorillas in the middle of the market that we don't see that can catch us when we're lacking Gonzales' humility.
Oh, and by the way, did you know that, in yesterday's market, 917 stocks trading above $10 a share made 20-day highs and only 258 made new lows? But, among stocks trading under $10 a share, 199 made new 20-day highs and 241 made new lows.
How easy it is to miss those gorillas.
The point is that the brain is a kind of search engine: a Googler of reality. If we program our search to look for passes among basketball players, that's the output we receive from the brain. What is extraneous to our search (gorillas) is eliminated. When we conduct a broad search, we receive a wider range of outputs. Focused searches work well if we're looking for a specific item, such as lost car keys. They don't work so well when we need to process all of the information needed to survive in an environment of risk and uncertainty.
It is very easy to approach the markets in focused search mode. We develop a hypothesis about the market (bullish or bearish) and we prime ourselves to look for certain chart patterns or indicator readings. In our haste to find what we're looking for, we can miss the gorillas in the middle of the market. Afterwords, we might look back on market action and think, "How in the *&#@ could I have missed that??!!"
Gonzales writes, "The practice of Zen teaches that it is impossible to add anything more to a cup that is already full. If you pour in more tea, it simply spills over and is wasted. The same is true of the mind. A closed attitude, an attitude that says, 'I already know', may cause you to miss important information. Zen teaches openness. Survival instructors refer to that quality of openness as 'humility'. In my experience, elite performers, such as high-angle rescue professionals, who risk their lives to save others, have an exceptional balance of boldness and humility..." (p. 91).
There is a concise formula for trading success: boldness and humility. The boldness to act on what you see with the conviction, and the humility to realize that what you see may not be all that is there.
Notice how so many of the excellent market bloggers--Charles Kirk and Trader Mike come readily to mind--track a variety of sectors and indices, examining the market from multiple angles. They're not just looking for the passes on the basketball court; they want to make sure they're not missing any gorillas in the picture.
It's those gorillas in the middle of the market that we don't see that can catch us when we're lacking Gonzales' humility.
Oh, and by the way, did you know that, in yesterday's market, 917 stocks trading above $10 a share made 20-day highs and only 258 made new lows? But, among stocks trading under $10 a share, 199 made new 20-day highs and 241 made new lows.
How easy it is to miss those gorillas.
Thursday, August 03, 2006
Thursday Update: Waning Market Momentum
After an initial push down, we bounced higher on Thursday before retracing a bit of the gain late in the day. As a result, we continue to grind higher, but in choppy fashion with fewer stocks displaying positive momentum. My Demand measure from the Trading Psychology Weblog (an index of the number of operating company issues showing superior positive momentum) ended the day at 84; Supply (reflecting the number of issues exhibiting significant downside momentum) was 53. New 20 day highs fell to 1116; new 20 day lows remain stubbornly high at 499. Among the stocks in my large cap basket, 9 now trade in intermediate-term uptrends; 6 in downtrends; and 2 neutral, leaving the Institutional Momentum at a relatively modest +280. On the whole, market rises on waning momentum--and especially with rising new lows--are more easily reversed than market strength that is broad and vigorous.
The pattern of fewer stocks making new highs has been going on for a while now. Among the S&P 500 stocks, we had 92 new 52-week highs in March, 75 in May, and only 27 during today's trade. The pattern is the same among the S&P 600 small caps: 100 new highs in April, 80 in May, and only 24 on Thursday. Markets lose strength before they gain weakness; until this pattern changes, I view the action since March as part of a broad topping process, with May as a candidate high for the bull market.
The pattern of fewer stocks making new highs has been going on for a while now. Among the S&P 500 stocks, we had 92 new 52-week highs in March, 75 in May, and only 27 during today's trade. The pattern is the same among the S&P 600 small caps: 100 new highs in April, 80 in May, and only 24 on Thursday. Markets lose strength before they gain weakness; until this pattern changes, I view the action since March as part of a broad topping process, with May as a candidate high for the bull market.
Becoming an Agent of Continuous Learning
Note: I will be on the road from today through the weekend and will not be posting the usual market updates on the Trading Psychology Weblog during that time. I will, however, continue to post to TraderFeed, including a basic market summary.
Much of my morning routine before the market open consists of looking at what has made the recent market distinctive. Perhaps it's an extreme indicator reading or an unusual pattern of price change. Whatever that distinctive element is, I then look back in market history to see what has characteristically occurred following that event. That, many times, gives me a clue for the market's overall direction during the coming day. I then track volume flows trade by trade and minute by minute (as outlined in my recent post) to see if large traders are indeed trading in the direction anticipated by my historical study. When those factors--historical tendency and reading of the tape--are in line, that is when I will take a trade.
My performance, as a result boils down to three elements:
Much of my morning routine before the market open consists of looking at what has made the recent market distinctive. Perhaps it's an extreme indicator reading or an unusual pattern of price change. Whatever that distinctive element is, I then look back in market history to see what has characteristically occurred following that event. That, many times, gives me a clue for the market's overall direction during the coming day. I then track volume flows trade by trade and minute by minute (as outlined in my recent post) to see if large traders are indeed trading in the direction anticipated by my historical study. When those factors--historical tendency and reading of the tape--are in line, that is when I will take a trade.
My performance, as a result boils down to three elements:
- Strategy - aligning my trade with historical odds;
- Tactics - aligning my trade with volume flows for the day;
- Execution - using a reading of large trader behavior to obtain good prices on entry and exit and using position sizing and stops to ensure that I take equal, moderate risk on all trades.
Breaking down my performance that way allows me to more readily see where I have gone wrong in trading and what I'm doing right. I've recently hit personal equity curve highs, and it is amazing how much of this profitability has been determined by #3. Your particular strategy (source of overall market edge), tactics (ways of exploiting that edge from day to day), and execution (position management) may be much different from mine, but breaking down your performance into these categories may help you see your strengths as a trader (so you can maximize them) and your weaknesses.
Military units conduct after-action reviews to identify what went right and wrong with a recently completed mission. Coaches will review game tapes with players to work on strengths and weaknesses. Traders can do the same by grading themselves on strategy, tactics, and execution. It's part of becoming an agent of continuous learning.
Wednesday, August 02, 2006
Reading the Market: More on What Every Short-Term Trader Should Know
In an earlier post, I outlined a reality that every short-term trader should know. Here I want to follow up on that with a practical application and example.
Imagine the market oscillating from moment to moment. It trades a number of contracts at the bid price, then several at the offer, then more at the bid, and yet more at the offer. This is happening from second to second as you focus on the order book and what is actually trading. What is actually trading is different from the bids and offers in the book, which may or may not actually trade, given the frequency with which large traders will pull their bids and offers before they are hit.
So we want to focus on what is real. What is real is what trades and *where* it is trading. Second to second, it is trading alternately at the bid and offer.
When a large trader lifts 500 from the book (i.e., purchases 500 contracts at the market's offer price), that, in the context of the moment-to-moment market, is a breakout trade. The only reason for buyers to take the offer price is if they think the market's oscillation is going to end and we will find a new, higher bid-offer range.
In that very short-term context, every buyer at the offer and seller at the bid is a breakout trader. The degree to which the market is trending at this shortest timeframe is reflected by the ease with which these breakout traders get paid out. In a rising market, the purchaser of 500 contracts at the market will find other demand coming in to support the price and the market will move higher.
If a large trader lifts an offer or hits a bid and doesn't get paid out, by definition his or her order was not sufficient to budge the market from its oscillation range. (And, of course, if the large trader' s position goes more than a tick in the red, the market is trending against that trader).
Yesterday AM, I had two points of profit in a short trade. The market had already made a nice down move and suddenly a seller hit the bid with 1500 contracts. I knew from experience that, on average, large size hitting bids after sizable down moves have already occurred often provides liquidity for smart buyers who perceive short-term value in the market. When the market did not immediately go lower in the face of that large trade, I took my profit and avoided a nasty run upward shortly thereafter.
If the market could easily absorb a large sell order after having moved steadily lower on orders that were no larger, that told me that we were nearing an equilibrium point. If the large trader is not getting paid out, the market is not trending on the shortest time frame.
This is not theory. This is not hammer and shooting star chart patterns, Fibonacci retracement numbers, wave sequences, oscillator readings, news events, statistical models, or monetary/economic conditions. This is simply how the market is trading and the ebb and flow of supply and demand in the marketplace.
When you combine historical market tendencies (such as those researched on this blog) with a keen reading of real-time supply and demand shifts, it is indeed possible to generate short-term edges in the market. The key is watching the market and what is actually happening, not getting lost in theories and what you think should happen.
Imagine the market oscillating from moment to moment. It trades a number of contracts at the bid price, then several at the offer, then more at the bid, and yet more at the offer. This is happening from second to second as you focus on the order book and what is actually trading. What is actually trading is different from the bids and offers in the book, which may or may not actually trade, given the frequency with which large traders will pull their bids and offers before they are hit.
So we want to focus on what is real. What is real is what trades and *where* it is trading. Second to second, it is trading alternately at the bid and offer.
When a large trader lifts 500 from the book (i.e., purchases 500 contracts at the market's offer price), that, in the context of the moment-to-moment market, is a breakout trade. The only reason for buyers to take the offer price is if they think the market's oscillation is going to end and we will find a new, higher bid-offer range.
In that very short-term context, every buyer at the offer and seller at the bid is a breakout trader. The degree to which the market is trending at this shortest timeframe is reflected by the ease with which these breakout traders get paid out. In a rising market, the purchaser of 500 contracts at the market will find other demand coming in to support the price and the market will move higher.
If a large trader lifts an offer or hits a bid and doesn't get paid out, by definition his or her order was not sufficient to budge the market from its oscillation range. (And, of course, if the large trader' s position goes more than a tick in the red, the market is trending against that trader).
Yesterday AM, I had two points of profit in a short trade. The market had already made a nice down move and suddenly a seller hit the bid with 1500 contracts. I knew from experience that, on average, large size hitting bids after sizable down moves have already occurred often provides liquidity for smart buyers who perceive short-term value in the market. When the market did not immediately go lower in the face of that large trade, I took my profit and avoided a nasty run upward shortly thereafter.
If the market could easily absorb a large sell order after having moved steadily lower on orders that were no larger, that told me that we were nearing an equilibrium point. If the large trader is not getting paid out, the market is not trending on the shortest time frame.
This is not theory. This is not hammer and shooting star chart patterns, Fibonacci retracement numbers, wave sequences, oscillator readings, news events, statistical models, or monetary/economic conditions. This is simply how the market is trading and the ebb and flow of supply and demand in the marketplace.
When you combine historical market tendencies (such as those researched on this blog) with a keen reading of real-time supply and demand shifts, it is indeed possible to generate short-term edges in the market. The key is watching the market and what is actually happening, not getting lost in theories and what you think should happen.
Tuesday, August 01, 2006
What History Says About the Stock Market's Prospects
If we look at the Dow over a period of years, we can see that it is up a little over 20% on a three-year basis, a little more than 10% on a two-year basis, and a little more than 5% on a one-year basis. I decided to go back all the way to 1942 and investigate all historical periods that had a similar trajectory: three year returns between 20-30%; two-year returns between 10-20%; and one-year returns between 5-10%. The resulting sample, drawn from 15,740 trading days, gave me 191 occasions, but many of these were clustered within the same cyclical periods.
The most recent occasion when we saw the market trading similarly was February, 2001. If you recall, the NASDAQ had taken quite a tumble over the previous year, but the large cap Dow stocks had held up well. Over the next two years, however, the Dow fell a grievous 26%.
The largest number of occasions cluster in the 1992-1995 time period--particularly during March-October, 1994. Here, if you recall, the market faced rising interest rates, but the economy did not go into deep recession. The market drop was quite mild and, two years later, we were up by about 50%.
We next see a cluster in January and February of 1981. Sadly, I'm showing my age by remembering that market quite well. It was also a period of high interest rates. We had bounced off a 1980 low, but were headed lower later that year and steadily until August, 1982, when we launched the great bull market. One year after the 1981 period that resembled our current market, we were down about 10%, but two years later we were up by the same amount, thanks to that 1982 lift off.
February, 1973 provides the next cluster of days similar to the current one. It was not a good time in the market, as we bounced off a decline from the 1972 highs, but then fell precipitously into the December, 1974 lows. This was a time of high energy prices, high interest rates, and deep recession. Two years later, the market was down by more than 25%.
February, 1962 is our next correlate. We had the missile scare and market plunge that year, but quickly righted ourself. The market was down about 3% one year later, but up a little over 10% two years afterward.
Next we have our second largest cluster of similar market periods spanning 1953-1954, with the majority of occasions in Feb.-May, 1953. That market had risen sharply off 1949 lows and was showing modestly higher highs and lower lows for over a year. One year later, the market was up about 10% on average, but two years later it was up by about 50%, reflecting the strong growth of the post-war period.
If we lump all the occasions, we can see that the market was up on average by 10.9% one year later and 36.1% two years later. That two-year performance is stronger than the market's average two-year gain of 17.09% covering the entire sample. Clearly, the two periods of real weakness (2001 and 1973) occurred in the context of major economic slowdown, augmented by event shocks (oil, WTC bombing).
Here's the interesting part. If we look *three* years out, all periods similar to the current one were profitable, except for those 2001 and 1973 occasions, which only lost less than 3% at worst. Indeed, the average three-year gain was 72.4%, much stronger than the average three-year gain of 26.3% for the sample overall.
This time may be different, I suppose, but the historical record suggests that buying for the longer run on near-term weakness would not be a bad strategy. Unless you're anticipating a rerun of 1929, 1973, or 2001, buying a three-year up market in which gains have been moderate over the past year is an attractive proposition. I'll post more on this in the Trading Psychology Weblog tonight.
The most recent occasion when we saw the market trading similarly was February, 2001. If you recall, the NASDAQ had taken quite a tumble over the previous year, but the large cap Dow stocks had held up well. Over the next two years, however, the Dow fell a grievous 26%.
The largest number of occasions cluster in the 1992-1995 time period--particularly during March-October, 1994. Here, if you recall, the market faced rising interest rates, but the economy did not go into deep recession. The market drop was quite mild and, two years later, we were up by about 50%.
We next see a cluster in January and February of 1981. Sadly, I'm showing my age by remembering that market quite well. It was also a period of high interest rates. We had bounced off a 1980 low, but were headed lower later that year and steadily until August, 1982, when we launched the great bull market. One year after the 1981 period that resembled our current market, we were down about 10%, but two years later we were up by the same amount, thanks to that 1982 lift off.
February, 1973 provides the next cluster of days similar to the current one. It was not a good time in the market, as we bounced off a decline from the 1972 highs, but then fell precipitously into the December, 1974 lows. This was a time of high energy prices, high interest rates, and deep recession. Two years later, the market was down by more than 25%.
February, 1962 is our next correlate. We had the missile scare and market plunge that year, but quickly righted ourself. The market was down about 3% one year later, but up a little over 10% two years afterward.
Next we have our second largest cluster of similar market periods spanning 1953-1954, with the majority of occasions in Feb.-May, 1953. That market had risen sharply off 1949 lows and was showing modestly higher highs and lower lows for over a year. One year later, the market was up about 10% on average, but two years later it was up by about 50%, reflecting the strong growth of the post-war period.
If we lump all the occasions, we can see that the market was up on average by 10.9% one year later and 36.1% two years later. That two-year performance is stronger than the market's average two-year gain of 17.09% covering the entire sample. Clearly, the two periods of real weakness (2001 and 1973) occurred in the context of major economic slowdown, augmented by event shocks (oil, WTC bombing).
Here's the interesting part. If we look *three* years out, all periods similar to the current one were profitable, except for those 2001 and 1973 occasions, which only lost less than 3% at worst. Indeed, the average three-year gain was 72.4%, much stronger than the average three-year gain of 26.3% for the sample overall.
This time may be different, I suppose, but the historical record suggests that buying for the longer run on near-term weakness would not be a bad strategy. Unless you're anticipating a rerun of 1929, 1973, or 2001, buying a three-year up market in which gains have been moderate over the past year is an attractive proposition. I'll post more on this in the Trading Psychology Weblog tonight.
Monday, July 31, 2006
The Sound of Breaking China?

Props to Bloomberg for the chart. We're looking at three months' worth of China's Shanghai (Shenzhen Composite Index) market, and we're looking at multiweek lows.
That, in itself, might not be newsworthy, other than the fact that economists in China are now joining the call for a stronger Yuan. The Yuan has hit its highest level relative to the dollar, a development reportedly supported by the U.S. Treasury Secretary. New IPOs are weighing on the Shanghai market and liquidity concerns abound. So far, China's command economy has not done a good job of obeying commands; the recent response of Shanghai stocks to Yuan strength suggests that, for better or for worse, markets may at last be listening.
Is There a Bias to End-of-Month Trading?
Are market returns superior at month's end, when institutions may put capital to work? I decided to take a look.
Specifically, I went back to late December, 2002 (N = 903 trading days) and examined returns from the last three days of the month and the first three days of the following month. These six day periods averaged a gain in the S&P 500 Index (SPY) of .15% (156 up, 102 down). That is stronger than the average one-day gain of .04% (494 up, 409 down) for the entire sample.
A look at the 2006 figures suggests that this outperformance has not fallen prey to changing cycles. Since late December, 2005, the average gain in SPY during the last three days of the month and first three days of the next month has averaged .11% (25 up, 17 down). That is stronger than the average one-day gain in SPY of .02% (75 up, 72 down) over that same period.
It does appear that, during the recent bull market, the ends and beginnings of months have been positively tinged. My calculations show that the first three days of the month have been particularly bullish, averaging a gain in SPY of .20% (77 up, 51 down) since 2003.
Specifically, I went back to late December, 2002 (N = 903 trading days) and examined returns from the last three days of the month and the first three days of the following month. These six day periods averaged a gain in the S&P 500 Index (SPY) of .15% (156 up, 102 down). That is stronger than the average one-day gain of .04% (494 up, 409 down) for the entire sample.
A look at the 2006 figures suggests that this outperformance has not fallen prey to changing cycles. Since late December, 2005, the average gain in SPY during the last three days of the month and first three days of the next month has averaged .11% (25 up, 17 down). That is stronger than the average one-day gain in SPY of .02% (75 up, 72 down) over that same period.
It does appear that, during the recent bull market, the ends and beginnings of months have been positively tinged. My calculations show that the first three days of the month have been particularly bullish, averaging a gain in SPY of .20% (77 up, 51 down) since 2003.
Sunday, July 30, 2006
Whatever Happened to the Last Hour of Trading?
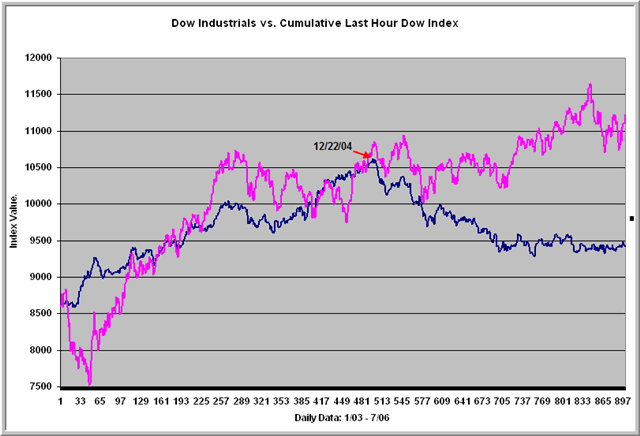 What does it mean when traders are buying or selling stocks in the last hour of the day? Some have suggested that this might be a "smart money" indicator, in that institutions that want to position themselves for anticipated moves will do so prior to the close to take advantage of overseas strength or weakness. Another way to view trading in the last hour is as a sentiment gauge. Heavy buying (selling) in the last hour means that bulls (bears) are so convinced of their positions that they're not willing to wait until the next day's open to place their orders.
Yet another view is that buying/selling in the last hour reflects risk-taking (willingness to assume overnight risk), while avoidance of buying/selling reflects risk aversion.
Whatever the explanation, we can see that a cumulative index of price changes in the Dow over the last hour of trading has failed to keep up with the Dow's price advance since the end of 2004. Early in the bull market, traders were buying during the last hour. Since 2005, this has not been the case. Even on Friday and over the past two weeks, when we had a nice pop in the Dow, there was no push to buy in the last hour.
Is smart money avoiding the market? Is sentiment bearish? Are traders behaving in a risk-averse fashion? Perhaps all the above. What we can see for certain is that willingness to step up and buy in the last hour has essentially vanished from this market.
RSP and SPY: Unweighted and Weighted S&P 500 Index
With the Rydex equal-weighted S&P 500 ETF (RSP), traders can now trade a version of the popular market average that has performed quite well in recent history. (See today's entry in the Trading Psychology Weblog for a chart). Going back to May, 2003, for example, the weighted S&P (SPY) has been up about 39%. The unweighted RSP, however, has risen by almost 66%. What that's telling us is that the smaller components of the S&P 500 have outperformed their larger counterparts--which is exactly what we've seen with the outperformance of the small and mid caps relative to large caps over the same period.
During the past five days of trading, SPY has been up by 3.25%, but RSP has lagged a bit, with a gain of 3.07%. Since May, 2003 (N = 809), we've had 48 days in which SPY has been up more than 2.5% over a five-day period. Over the next five days, SPY has been up on average by .66% (33 up, 15 down). That is much stronger than the average five-day gain of .20% (454 up, 355 down) for the entire sample.
When we divide the strong SPY periods in half, however, based on RSP performance, a pattern emerges. When SPY is strong over five days and RSP is relatively strong compared to SPY (N = 24), the next five days in SPY average a large gain of .96% (17 up, 7 down). When SPY is strong over five days and RSP is relatively weak (N = 24), the next five days in SPY average a gain of .37% (16 up, 8 down).
In other words, a strong five-day period since May, 2003 has led to strength over the next five days, but that strength has been more pronounced when the small stocks in the S&P 500 Index have been outperformers (which has not been the case over the last week).
Once again, however, we do have to be concerned about changing cycles. Since the start of 2005, we've had 10 occasions in which SPY has been up by more than 2.5% in a five-day period. Five days later, SPY has been up 4 times, down 6, for an average loss of -.10%. In 2006, three of the four occasions in which we've seen a strong SPY (up more than 2.5% over five days) have led to losses five days later.
During the past five days of trading, SPY has been up by 3.25%, but RSP has lagged a bit, with a gain of 3.07%. Since May, 2003 (N = 809), we've had 48 days in which SPY has been up more than 2.5% over a five-day period. Over the next five days, SPY has been up on average by .66% (33 up, 15 down). That is much stronger than the average five-day gain of .20% (454 up, 355 down) for the entire sample.
When we divide the strong SPY periods in half, however, based on RSP performance, a pattern emerges. When SPY is strong over five days and RSP is relatively strong compared to SPY (N = 24), the next five days in SPY average a large gain of .96% (17 up, 7 down). When SPY is strong over five days and RSP is relatively weak (N = 24), the next five days in SPY average a gain of .37% (16 up, 8 down).
In other words, a strong five-day period since May, 2003 has led to strength over the next five days, but that strength has been more pronounced when the small stocks in the S&P 500 Index have been outperformers (which has not been the case over the last week).
Once again, however, we do have to be concerned about changing cycles. Since the start of 2005, we've had 10 occasions in which SPY has been up by more than 2.5% in a five-day period. Five days later, SPY has been up 4 times, down 6, for an average loss of -.10%. In 2006, three of the four occasions in which we've seen a strong SPY (up more than 2.5% over five days) have led to losses five days later.
Saturday, July 29, 2006
Smooth Moves and Choppy Seas - Part Two
 In my last entry, we found that 10-day rises that were smooth--i.e. that had seven or more of its days finishing to the upside--had a more favorable short-term outcome than ten-day rises that were choppy, with four or more declining days in the mix. This was not because the smooth rises were larger than the choppy ones; their average size was quite similar. Rather, it appears that how a market moves from Point A to Point B matters as much as the size of the move itself.
I went back to the entire sample from February, 1996 (N = 2618 trading days) and simply compared smooth ten-day rises in SPX (those with 7 or more up days) with smooth ten-day declines (those with 7 or more down days). Here there is an obvious overlap with price change: the smooth 10-day rises averaged a gain of 3.24%; the smooth 10-day declines averaged a loss of -4.05%.
When SPX had seven or more days out of 10 to the upside, (N = 499), the next five days in SPX averaged a gain of only .08% (288 up, 211 down). That is no better than the average five-day change of .16% (1422 up, 1196 down) for the entire sample. When SPX had seven or more days out of 10 to the downside (N = 301), the next five days averaged an above average gain of .47% (174 up, 127 down). That is quite a bit better than average.
A different pattern appears when we look 20 days out, however. When SPX has been up 7 or more times out of 10, the market 20 days later averages a gain of .82% (302 up, 197 down). That is a bit stronger than the average 20-day gain of .61% (1521 up, 1097 down) for the entire sample. When SPX has been down 7 or more times out of 10, the market 20 days later averages a gain of only .36% (156 up, 145 down).
When we put those results together, what we find is that markets that move smoothly do not follow through on their moves in the next five trading sessions--and indeed often correct a bit--but then do follow through with their original moves in the subsequent 15 sessions.
The paths of various rises and falls across different time frames strikes me as a fruitful line of further inquiry. A smooth trending move appears to correct in the short run before continuing in its original direction thereafter.
Smooth Moves and Choppy Seas - Part One
 If a market moves from Point A to Point B in a smooth, steady fashion, does that lead to different short-term outcomes than if the move is choppy? For instance, over the last two weeks (10 trading days), we've risen almost 3.5% in the S&P 500 Index ($SPX). The move has been relatively choppy, however, with five of the days rising and five declining.
I went back to February, 1996 (N = 2618 trading days) and found 565 periods in which SPX had risen between 2%-5% in a ten-day period. When the move was smooth--seven or more of the days rising (N = 248)--the next ten days were up on average by .44% (154 up, 94 down). When the move was not smooth--six or fewer of the days rising (N = 317)--the next ten days were up on average only .08% (166 up, 151 down).
It thus appears that rises interspersed with selling have poorer near-term outcomes than rises that are smooth and consistent. The market's recent 10-day rise, by this gauge, is not necessarily a stimulus for superior returns going forward. This smoothness/choppiness is a variable that could be studied across many time frames--intraday as well as daily--for any trading instrument. I will be following this up with further investigations.
Friday, July 28, 2006
Enticement, Deception, and the Daily American Idol of Trading
I opened a trading magazine last night, and here was the copy to an advertisement encouraging retail traders to enter the foreign exchange markets:
"Just because you've got a nice, solid, grown-up stock portfolio doesn't mean you can't have any fun. Why not add currency trading into the mix...It's fast, exciting, open 24 hours a day--and there are no commissions...But best of all, it's easy to get started. All you need is $250 to open an account."
Now reread the above copy and just substitute the words "casino gambling" for "currency trading". You get the picture.
What is even sadder is that, after traders have run through their several hundred dollar trading stake (no doubt aided by the 3-pip wide spreads that accompany "free" trading), many of them contact me as a trading psychologist. They (incredibly) harbor hopes that they will parlay hundreds of dollars into many thousands and they're seeing those dreams dashed before their eyes.
So I end up playing Simon Fuller and telling them that they don't actually have a good voice and can't possibly be America's next Idol.
Deception abounds. How about this line of copy from a commercial website ostensibly devoted to the teaching of traders:
"Due in part to its size, Forex is less volatile than other markets. Lower volatility equals lower risk. For example, the S&P 500 Index trading range is between 4% and 5% daily, while the daily volatility range in the Euro is around 1%."
WTF?? Forex is *less* volatile than the S&P 500 Index?? Even ignoring the fact that currency traders typically trade with more leverage than equity traders, since when has the S&P 500 Index sported trading ranges between 4 and 5% daily?? That would be the equivalent of 50-60 ES points every single day!!
In this case, I actually wrote to the firm and reported research that showed that Forex was *not* less volatile than equities (actually, it has a more leptokurtic distribution of price changes, with lots of small ones and a smaller number of phenomenally large ones) and was not a superior trending vehicle (the conditional probability of the next period following the direction of the previous one was no better than 50/50 and actually somewhat worse).
I received no reply to my research. To this day, the advertorial copy hasn't been changed.
So there it is. One company markets currency trading as a casino, the other as a safe haven with non-volatile trending.
Either way, I get the emails describing dashed hopes and expectations.
"Just because you've got a nice, solid, grown-up stock portfolio doesn't mean you can't have any fun. Why not add currency trading into the mix...It's fast, exciting, open 24 hours a day--and there are no commissions...But best of all, it's easy to get started. All you need is $250 to open an account."
Now reread the above copy and just substitute the words "casino gambling" for "currency trading". You get the picture.
What is even sadder is that, after traders have run through their several hundred dollar trading stake (no doubt aided by the 3-pip wide spreads that accompany "free" trading), many of them contact me as a trading psychologist. They (incredibly) harbor hopes that they will parlay hundreds of dollars into many thousands and they're seeing those dreams dashed before their eyes.
So I end up playing Simon Fuller and telling them that they don't actually have a good voice and can't possibly be America's next Idol.
Deception abounds. How about this line of copy from a commercial website ostensibly devoted to the teaching of traders:
"Due in part to its size, Forex is less volatile than other markets. Lower volatility equals lower risk. For example, the S&P 500 Index trading range is between 4% and 5% daily, while the daily volatility range in the Euro is around 1%."
WTF?? Forex is *less* volatile than the S&P 500 Index?? Even ignoring the fact that currency traders typically trade with more leverage than equity traders, since when has the S&P 500 Index sported trading ranges between 4 and 5% daily?? That would be the equivalent of 50-60 ES points every single day!!
In this case, I actually wrote to the firm and reported research that showed that Forex was *not* less volatile than equities (actually, it has a more leptokurtic distribution of price changes, with lots of small ones and a smaller number of phenomenally large ones) and was not a superior trending vehicle (the conditional probability of the next period following the direction of the previous one was no better than 50/50 and actually somewhat worse).
I received no reply to my research. To this day, the advertorial copy hasn't been changed.
So there it is. One company markets currency trading as a casino, the other as a safe haven with non-volatile trending.
Either way, I get the emails describing dashed hopes and expectations.
Thursday, July 27, 2006
When Stocks Contradict the Stock Market - Part II
My previous post found that the S&P 500 Index tended to reverse moves when those moves were accompanied by both an expansion of new 20-day highs and new 20-day lows. When more stocks make new lows on an up day or vice versa, the next day tends to retrace the previous move.
During the past three trading sessions in SPY, we've been up significantly but the number of stocks during that time that have shown strong upside momentum, as measured by my Demand/Supply measure (which is given daily in the Trading Psychology Weblog), has declined during that time. When the stocks contradict the market by showing waning momentum in the face of price gains, what happens next?
Since September, 2002 (N = 963 trading days), we have had 139 occasions in which SPY has been up by more than 1.5% over three trading sessions. When those three sessions are accompanied by declining stock momentum (N = 71), the next four days in SPY average a gain of .05% (40 up, 31 down), weaker than the average four-day gain of .17% (532 up, 431 down). When, however, the three strong sessions are accompanied by broadening stock momentum (N = 68), the next four days in SPY average a sizable gain of .64% (43 up, 25 down)--much stronger than average.
Once again we see that what happens among individual stocks truly affects the broad market. When market rises are accompanied by broadening upside momentum, near-term returns have been much better than when rising prices have been contradicted by narrowing momentum.
During the past three trading sessions in SPY, we've been up significantly but the number of stocks during that time that have shown strong upside momentum, as measured by my Demand/Supply measure (which is given daily in the Trading Psychology Weblog), has declined during that time. When the stocks contradict the market by showing waning momentum in the face of price gains, what happens next?
Since September, 2002 (N = 963 trading days), we have had 139 occasions in which SPY has been up by more than 1.5% over three trading sessions. When those three sessions are accompanied by declining stock momentum (N = 71), the next four days in SPY average a gain of .05% (40 up, 31 down), weaker than the average four-day gain of .17% (532 up, 431 down). When, however, the three strong sessions are accompanied by broadening stock momentum (N = 68), the next four days in SPY average a sizable gain of .64% (43 up, 25 down)--much stronger than average.
Once again we see that what happens among individual stocks truly affects the broad market. When market rises are accompanied by broadening upside momentum, near-term returns have been much better than when rising prices have been contradicted by narrowing momentum.
When Stocks Contradict the Stock Market
Yesterday we had a rising market, but the number of stocks making fresh 20-day lows increased, even as we had an increase in new 20-day highs. What happens when stocks contradict the market and expand new lows on rising days and expand new highs on falling days?
Since September, 2002 (N = 963 trading days), we've had 92 occasions in which the market (SPY) has risen on the day with expanding new 20-day highs, but also with expanding new 20-day lows. This is what we saw yesterday. The next day of trading, SPY was down by an average -.20% (42 up, 50 down). That is much weaker than the average one-day gain of .04% (517 up, 446 down) for the entire sample. Conversely, when SPY has fallen for the day, but new highs have expanded as well as new lows (N = 84), the next day in SPY has risen by a strong .19% (54 up, 30 down). It thus appears that market moves that are contradicted by the stocks tend to reverse the next day. It is but one more reminder that the market of stocks does indeed affect the stock market.
Since September, 2002 (N = 963 trading days), we've had 92 occasions in which the market (SPY) has risen on the day with expanding new 20-day highs, but also with expanding new 20-day lows. This is what we saw yesterday. The next day of trading, SPY was down by an average -.20% (42 up, 50 down). That is much weaker than the average one-day gain of .04% (517 up, 446 down) for the entire sample. Conversely, when SPY has fallen for the day, but new highs have expanded as well as new lows (N = 84), the next day in SPY has risen by a strong .19% (54 up, 30 down). It thus appears that market moves that are contradicted by the stocks tend to reverse the next day. It is but one more reminder that the market of stocks does indeed affect the stock market.
Wednesday, July 26, 2006
When the Week Gets Off to a Bang
 This week has gotten off to a bang, with rises on Monday and Tuesday providing us with more than a 2% gain in the Dow Jones Industrial Average. But what happens when the market starts the week with a bang? Do we get more fireworks later in the week or does the bang become a whimper?
I went back to December, 1988 (N = 4443 trading days) and found exactly 100 occasions in which the market was up on both Monday and Tuesday and had a total two-day gain of over 1.5%. Two days later, the Dow was down by an average -.21% (42 up, 58 down), which is much weaker than the average two-day gain of .08% (2384 up, 2059 down) for the entire sample.
Interestingly, we have not started the week with a bang at all up until now in 2006 and only had one occasion in 2005. Since the recent bull market began in March, 2003, we've had 12 starts to the week with a bang. Two days later, the market was up 5 times, down 7 for an average loss of -.13%.
Also interestingly, consecutive two-day gains which, together, produce a rise of more than 1.5% show somewhat subdued returns, but nothing as subnormal as the two-day "bang" gains at the start of a week. At least in recent market history, strong starts to the week have not produced strong finishes.
Tuesday, July 25, 2006
Big Swingin' TICK Days in the Market
Yesterday's post took a look at sentiment on a longer-term basis; today we'll look at a very short-term measure of sentiment. The NYSE TICK tracks the cumulative difference in the number of stocks trading at their offer price minus those trading at their bid. As a result, it is an excellent measure for identifying the degree to which traders in the broad market are aggressive buyers (transacting at the offer across many different stocks) vs. aggressive sellers (hitting bids across many issues).
Each day in the Trading Psychology Weblog, I provide a daily summary of a version of the NYSE TICK that is adjusted to create a zero mean. Positive values of the Adjusted TICK thus indicate net positive short-term sentiment on the day, while negative values reveal net negative short-term sentiment.
Monday was truly a big swingin' TICK day: We were up solidly from Friday's close to Monday's open and then added significantly to the gains through the session on a strong Adjusted TICK. This means that there was strong positive sentiment, and that sentiment was carried out in action.
I went back to July, 2003 (N = 765 trading days) and found only 10 big swingin' TICK days in the S&P 500 Index (SPY). Those occasions had to be up from the previous close to the current open by more than .30% and had to be up from open to close more than .50%, with an Adjusted TICK greater than +700.
Interestingly, two days following the big swingin' TICK day, SPY was down by an average of -.50% (3 up, 7 down)--much weaker than the average two-day change of .06% (403 up, 362 down) for the entire sample.
What is even more striking is that strong TICK days that are *not* big swingin' TICK days (i.e., that aren't up strongly close to open and again from open to close; N = 47) have quite favorable expectations over a two-day horizon. Specifically, they are up on average by .27% (27 up, 20 down).
What this suggests is that there is a tendency for the market to correct in the near term when highly positive short-term sentiment provides sustained price gains. A hard man may be good to find, but the market apparently doesn't like big swingin' TICKS.
Each day in the Trading Psychology Weblog, I provide a daily summary of a version of the NYSE TICK that is adjusted to create a zero mean. Positive values of the Adjusted TICK thus indicate net positive short-term sentiment on the day, while negative values reveal net negative short-term sentiment.
Monday was truly a big swingin' TICK day: We were up solidly from Friday's close to Monday's open and then added significantly to the gains through the session on a strong Adjusted TICK. This means that there was strong positive sentiment, and that sentiment was carried out in action.
I went back to July, 2003 (N = 765 trading days) and found only 10 big swingin' TICK days in the S&P 500 Index (SPY). Those occasions had to be up from the previous close to the current open by more than .30% and had to be up from open to close more than .50%, with an Adjusted TICK greater than +700.
Interestingly, two days following the big swingin' TICK day, SPY was down by an average of -.50% (3 up, 7 down)--much weaker than the average two-day change of .06% (403 up, 362 down) for the entire sample.
What is even more striking is that strong TICK days that are *not* big swingin' TICK days (i.e., that aren't up strongly close to open and again from open to close; N = 47) have quite favorable expectations over a two-day horizon. Specifically, they are up on average by .27% (27 up, 20 down).
What this suggests is that there is a tendency for the market to correct in the near term when highly positive short-term sentiment provides sustained price gains. A hard man may be good to find, but the market apparently doesn't like big swingin' TICKS.
Monday, July 24, 2006
When It's Popular to be a Bear, Beware
David Korn makes the interesting observation that the sentiment data from the AAII are highly skewed toward the bears. Indeed, with roughly 58% bears and only 24% bulls, this is one of the most bearish readings since 1989 (N = 906 weeks). Of course, I wanted to see if such highly bearish sentiment truly is associated with intermediate-term market returns.
First off, we've only had 25 weekly occasions in which bears have been over 50%. Of these readings, 16 occurred during the late 1990-early 1991 period, which was a major market bottom. Other times we've seen over 50% bears have been February-March, 2003 (another major bottom); individual weekly readings from July - October, 2002; and individual readings in March and December, 2000.
On 20 of these 25 occasions, the Dow Jones Industrial Average (DJI) has been down for the 10 weeks *prior* to the bearish sentiment reading. In other words, bearish sentiment has tended to occur after prolonged market weakness. This is true of the current bearish sentiment reading as well.
When bears have exceeded bulls by more than 20% in the AAII survey (N = 46), the next ten weeks in the Dow have averaged a gain of 4.48 (37 up, 9 down). That is a whopping advantage over the average 10-week gain in the Dow of 1.93% (596 up, 310 down) for the entire sample.
Conversely, when bulls have exceeded bears by 30% or more (N = 142), the next 10 weeks in the Dow have been up by an average of only .83% (78 up, 64 down)--less than half the average return for the sample.
Interestingly, when bears have exceeded bulls by more than 20% and there has been a bullish advantage going forward, the *previous* ten weeks in the Dow have been down on average by over 4%. When the bulls have exceeded the bears by more than 30% and there have been subnormal returns going forward, the previous ten weeks in the Dow have been *up* on average by over 4%.
So there you have it. Down markets followed by extreme bearish sentiment have tended to be bullish in the intermediate-term; up markets followed by strongly bullish sentiment have tended to yield subnormal returns in the next two months. Occasions in which we've had more than 50% bears have tended to be either major cyclical bottoms or intermediate-term low points during bear markets that have preceded sharp rallies. Please note that these are small samples, particularly given the clustering of bearish readings at certain points in time.
Per the Trading Psychology Weblog's Monday entry, note also that we have been seeing a recent reduction in stocks registering new intermediate-term lows--a surprising finding as bearishness has expanded.
First off, we've only had 25 weekly occasions in which bears have been over 50%. Of these readings, 16 occurred during the late 1990-early 1991 period, which was a major market bottom. Other times we've seen over 50% bears have been February-March, 2003 (another major bottom); individual weekly readings from July - October, 2002; and individual readings in March and December, 2000.
On 20 of these 25 occasions, the Dow Jones Industrial Average (DJI) has been down for the 10 weeks *prior* to the bearish sentiment reading. In other words, bearish sentiment has tended to occur after prolonged market weakness. This is true of the current bearish sentiment reading as well.
When bears have exceeded bulls by more than 20% in the AAII survey (N = 46), the next ten weeks in the Dow have averaged a gain of 4.48 (37 up, 9 down). That is a whopping advantage over the average 10-week gain in the Dow of 1.93% (596 up, 310 down) for the entire sample.
Conversely, when bulls have exceeded bears by 30% or more (N = 142), the next 10 weeks in the Dow have been up by an average of only .83% (78 up, 64 down)--less than half the average return for the sample.
Interestingly, when bears have exceeded bulls by more than 20% and there has been a bullish advantage going forward, the *previous* ten weeks in the Dow have been down on average by over 4%. When the bulls have exceeded the bears by more than 30% and there have been subnormal returns going forward, the previous ten weeks in the Dow have been *up* on average by over 4%.
So there you have it. Down markets followed by extreme bearish sentiment have tended to be bullish in the intermediate-term; up markets followed by strongly bullish sentiment have tended to yield subnormal returns in the next two months. Occasions in which we've had more than 50% bears have tended to be either major cyclical bottoms or intermediate-term low points during bear markets that have preceded sharp rallies. Please note that these are small samples, particularly given the clustering of bearish readings at certain points in time.
Per the Trading Psychology Weblog's Monday entry, note also that we have been seeing a recent reduction in stocks registering new intermediate-term lows--a surprising finding as bearishness has expanded.
Sunday, July 23, 2006
When Markets are Salmon, Do Traders Get Smoked?
Charles Kirk of The Kirk Report referred to Friday as a salmon day. By that he meant that the market struggled to move higher early in the day only to be pushed backward as the day wore on. I thought that was a particularly descriptive metaphor for what Friday's market felt like.
Of course, that had me thinking about ways of quantifying salmon days. I decided that, for this first attempt, a salmon day would be a day that had the following characteristics: 1) a higher open (to show the salmon moving upstream); 2) a move from today's open to high that was weaker than the move from yesterday's close to today's open (to show the poor fish struggling); 3) a range between today's high and low that exceeded 1% (to show a reasonably strong current to the stream); and 4) today's close within .25% of today's low (to show the salmon losing the struggle).
Lo and behold, I found that, not only was Friday a salmon day, but Thursday qualified as well! Clearly this is a bagel and cream cheese market.
To my surprise, we've only had two other bagel and cream cheese occasions (i.e., two back to back salmon days) in the market since January, 1996. FWIW, the market was solidly higher after two days following both of those occasions.
Overall since January, 1996 (N = 2625 trading days), we've had 90 salmon days. Three days later in the S&P 500 Index (SPY), the market has been up by an average .37% (54 up, 36 down). That is considerably stronger than the average three-day gain of .10% (1420 up, 1205 down) for the entire sample. These superior gains following salmon days occurred between 2004 and the present (N = 19), although to a more moderate degree. All three salmon days in 2006 to this point have been solidly profitable three days later.
In short, lox aren't so bad for stocks: traders don't seem to get smoked after salmon days. Indeed, after falling back following an opening advance, the salmon tends to make some progress in the near term.
The larger point is that thinking in images and metaphors--a trademark, by the way, of Victor Niederhoffer and Laurel Kenner's website--can often lead to fruitful hypotheses that can be quantified. It is at this junction of art and science that traders can often find creative edges in the marketplace.
Pass the cream cheese.
Of course, that had me thinking about ways of quantifying salmon days. I decided that, for this first attempt, a salmon day would be a day that had the following characteristics: 1) a higher open (to show the salmon moving upstream); 2) a move from today's open to high that was weaker than the move from yesterday's close to today's open (to show the poor fish struggling); 3) a range between today's high and low that exceeded 1% (to show a reasonably strong current to the stream); and 4) today's close within .25% of today's low (to show the salmon losing the struggle).
Lo and behold, I found that, not only was Friday a salmon day, but Thursday qualified as well! Clearly this is a bagel and cream cheese market.
To my surprise, we've only had two other bagel and cream cheese occasions (i.e., two back to back salmon days) in the market since January, 1996. FWIW, the market was solidly higher after two days following both of those occasions.
Overall since January, 1996 (N = 2625 trading days), we've had 90 salmon days. Three days later in the S&P 500 Index (SPY), the market has been up by an average .37% (54 up, 36 down). That is considerably stronger than the average three-day gain of .10% (1420 up, 1205 down) for the entire sample. These superior gains following salmon days occurred between 2004 and the present (N = 19), although to a more moderate degree. All three salmon days in 2006 to this point have been solidly profitable three days later.
In short, lox aren't so bad for stocks: traders don't seem to get smoked after salmon days. Indeed, after falling back following an opening advance, the salmon tends to make some progress in the near term.
The larger point is that thinking in images and metaphors--a trademark, by the way, of Victor Niederhoffer and Laurel Kenner's website--can often lead to fruitful hypotheses that can be quantified. It is at this junction of art and science that traders can often find creative edges in the marketplace.
Pass the cream cheese.
Saturday, July 22, 2006
What Every Short-Term Trader Should Know
The one thing short-term traders should know is that size matters. It is of vital importance at all times to know whether the traders in size are leaning to the buy or sell side. Because volatility is intimately connected to volume, the presence or absence of large traders will determine the amount of movement in the market. The degree to which large traders are hitting bids or lifting offers will determine the market's tendency to sustain directional moves (i.e., trend).
(IMO, understanding--really understanding--those last two sentences will keep many traders out of bad trades and bad markets).
Let's take the opening period of Friday's trade as an example. I'm looking at the time period just before the NYSE open to the end of the first half hour of trade (9:25 AM - 10:00 AM ET) in the S&P 500 e-mini (ES) market. During that period, we had 13,954 trades that included 212,684 contracts.
Of these trades, 5148--almost 40%--were one-lots. Those one-lots accounted for about 2-1/2% of all market volume during the opening period.
Conversely, 431 trades--only about 3% of the total--were trades of 100 contracts or more. This group of large traders, however, accounted for 82,127 contracts traded, or nearly 40% of the total.
So there you have it. Give or take a bit, the smallest 40% of trades account for 3% of the volume, and the 3% of largest trades control 40% of the volume.
A number of excellent short-term trading guides can arise from these observations. For instance, we can compare the number of large trades occuring during a time period and compare it to the average number of large trades that occur during that time period, and we'll have a rough idea of the degree to which large players are dominant and volatility can be expected.
We can also parcel out the large trades that occur at the bid price (meaning a large seller is anxious to exit the market) vs. the large trades that occur at the offer (a large buyer is eager to get into the market) as a way of tracking the moment-to-moment sentiment of large traders.
Trade by trade analyses of market action that capture the sequencing of large trades at market tops and bottoms are also quite revealing, as they display how one-sided markets (those dominated by buyers or sellers) become two-sided when other timeframe participants perceive that the market has moved too far from value. That period on Friday from just before the open to the end of the first half-hour of trade neatly caught such a sequence.
There's value in looking at charts of markets that cover many days. That's viewing the market through a telescope. The short-term trader, however, can also benefit from observing the teeming life under the microscope. What moves the market in the short run is not what fundamentally moves the market over the long haul. Taking advantage of the data appropriate for your timeframe is all-important.
Tonight, I'll post a chart to the Trading Psychology Weblog that illustrates some of these ideas.
(IMO, understanding--really understanding--those last two sentences will keep many traders out of bad trades and bad markets).
Let's take the opening period of Friday's trade as an example. I'm looking at the time period just before the NYSE open to the end of the first half hour of trade (9:25 AM - 10:00 AM ET) in the S&P 500 e-mini (ES) market. During that period, we had 13,954 trades that included 212,684 contracts.
Of these trades, 5148--almost 40%--were one-lots. Those one-lots accounted for about 2-1/2% of all market volume during the opening period.
Conversely, 431 trades--only about 3% of the total--were trades of 100 contracts or more. This group of large traders, however, accounted for 82,127 contracts traded, or nearly 40% of the total.
So there you have it. Give or take a bit, the smallest 40% of trades account for 3% of the volume, and the 3% of largest trades control 40% of the volume.
A number of excellent short-term trading guides can arise from these observations. For instance, we can compare the number of large trades occuring during a time period and compare it to the average number of large trades that occur during that time period, and we'll have a rough idea of the degree to which large players are dominant and volatility can be expected.
We can also parcel out the large trades that occur at the bid price (meaning a large seller is anxious to exit the market) vs. the large trades that occur at the offer (a large buyer is eager to get into the market) as a way of tracking the moment-to-moment sentiment of large traders.
Trade by trade analyses of market action that capture the sequencing of large trades at market tops and bottoms are also quite revealing, as they display how one-sided markets (those dominated by buyers or sellers) become two-sided when other timeframe participants perceive that the market has moved too far from value. That period on Friday from just before the open to the end of the first half-hour of trade neatly caught such a sequence.
There's value in looking at charts of markets that cover many days. That's viewing the market through a telescope. The short-term trader, however, can also benefit from observing the teeming life under the microscope. What moves the market in the short run is not what fundamentally moves the market over the long haul. Taking advantage of the data appropriate for your timeframe is all-important.
Tonight, I'll post a chart to the Trading Psychology Weblog that illustrates some of these ideas.
Friday, July 21, 2006
What Happens After a Broad Market Rise?
Note: A complete market update will be posted to the Trading Psychology Weblog this AM.
Wednesday's rise featured the highest ratio of advancing stocks to declining issues--about 6:1--that we've seen since 2001 (N = 1388 trading days). Thursday's market declined following this broad rise. I decided to take a look at how markets follow through on broad rises to see if that might tell us something about the market's near-term future.
Since 2001, we've had 43 days in which the ratio of advancing stocks to declining ones was better than 3:1. There has been a bullish edge in the S&P 500 Index (SPY) two days after the broad rise, with an average gain of over .25% (25 up, 18 down). That compares to an average two-day gain in the entire sample of .01% (727 up, 661 down).
When the broad rise was followed by a down day (such as happened yesterday; N = 18), the *next* five days in SPY averaged a gain of .46% (12 up, 6 down). When the broad rise was followed by an up day (N = 25), the next five days in SPY averaged a gain of .30% (14 up, 11 down). All told, there has tended to be a bullish leaning to the next five days of trading following a broad market rise.
Now for the caveat, however. When the market rise has been *very* broad (i.e., with advancing stocks outnumbering declining issues by more than 4:1), the market has been down on five of those occasions, as reported in today's post on the Trading Psychology Weblog. Could it be that moderately broad rises fare better in the short-run than very broad rises, simply because the very broad rises are indiscriminate in their buying? It's a hypothesis worth looking into.
Wednesday's rise featured the highest ratio of advancing stocks to declining issues--about 6:1--that we've seen since 2001 (N = 1388 trading days). Thursday's market declined following this broad rise. I decided to take a look at how markets follow through on broad rises to see if that might tell us something about the market's near-term future.
Since 2001, we've had 43 days in which the ratio of advancing stocks to declining ones was better than 3:1. There has been a bullish edge in the S&P 500 Index (SPY) two days after the broad rise, with an average gain of over .25% (25 up, 18 down). That compares to an average two-day gain in the entire sample of .01% (727 up, 661 down).
When the broad rise was followed by a down day (such as happened yesterday; N = 18), the *next* five days in SPY averaged a gain of .46% (12 up, 6 down). When the broad rise was followed by an up day (N = 25), the next five days in SPY averaged a gain of .30% (14 up, 11 down). All told, there has tended to be a bullish leaning to the next five days of trading following a broad market rise.
Now for the caveat, however. When the market rise has been *very* broad (i.e., with advancing stocks outnumbering declining issues by more than 4:1), the market has been down on five of those occasions, as reported in today's post on the Trading Psychology Weblog. Could it be that moderately broad rises fare better in the short-run than very broad rises, simply because the very broad rises are indiscriminate in their buying? It's a hypothesis worth looking into.
Thursday, July 20, 2006
The Fundamental Mistake of Trading Psychology
Just as there are two types of trader, there are two basic ways in which psychology can assist traders. The first is by helping traders reduce or eliminate unwanted negative patterns of thought, feeling, or action. This is the trading psychologist’s historical stock in trade. Many traders seek to improve their performance by ridding themselves of bad habits.
There is, however, a second way in which psychology can assist traders that is less appreciated. Even when traders have found their edge and are making money, they may not take full advantage of the opportunities that they have. Instead of losing large sums, they are leaving significant money on the table. Such traders can benefit from psychology by learning how to do more of what works. Their goal is to build positive action patterns, not reduce undesirable ones.
The confusion of these two modes (and how they sometimes can work together) creates what I call the fundamental mistake of trading psychology. Traders assume that, in order to be successful, they need to dig into their problems and eliminate them. Research tells us, on the other hand, that most highly successful people across a variety of fields—from arts to athletics and science—succeed by maximizing their strengths, not by focusing efforts on their weaknesses.
This is such an important topic—and it is so important to avoid the fundamental mistake of trading psychology—that I will post an entire article on the theme to my personal website this weekend.
A recent book by management guru Marcus Buckingham makes this essential point: great businesses (and managers) play to their strengths. They don’t get bogged down in efforts to make themselves less weak in particular areas. Instead, they find ways to compensate for weaknesses and take full advantage of strengths.
Many traders are much more familiar with their weaknesses than their strengths, especially after they’ve gone through a slump. They haven’t truly analyzed their performance to see what they do well. As long as that is the case, they cannot focus on those strengths and learn to apply them to a greater range of situations. The fundamental mistake keeps them problem-focused, when instead they should be building solutions.
Who you ultimately are—and what you’re truly good at—may be different from the person you’re trying to be. Michael Jordan longed to be a baseball player and could have spent untold years working on becoming a decent player. Fortunately, he returned to the NBA and to his very special talents.
After an exhaustive review of my trading performance, I found that I was most successful trading short-term morning patterns in the ES. I would love to be a longer-term trader and (at times of volatility and opportunity) a full-time trader, but that is not where my talents lie. The fundamental mistake would have me work on becoming less bad at trading afternoons or longer-term. The right application of psychology has me learning to build my consistency and grow my size at what I do best.
Sometimes the greatest challenge is the simplest: to just be who we really are and do what we do best—and embrace that for all it’s worth.
There is, however, a second way in which psychology can assist traders that is less appreciated. Even when traders have found their edge and are making money, they may not take full advantage of the opportunities that they have. Instead of losing large sums, they are leaving significant money on the table. Such traders can benefit from psychology by learning how to do more of what works. Their goal is to build positive action patterns, not reduce undesirable ones.
The confusion of these two modes (and how they sometimes can work together) creates what I call the fundamental mistake of trading psychology. Traders assume that, in order to be successful, they need to dig into their problems and eliminate them. Research tells us, on the other hand, that most highly successful people across a variety of fields—from arts to athletics and science—succeed by maximizing their strengths, not by focusing efforts on their weaknesses.
This is such an important topic—and it is so important to avoid the fundamental mistake of trading psychology—that I will post an entire article on the theme to my personal website this weekend.
A recent book by management guru Marcus Buckingham makes this essential point: great businesses (and managers) play to their strengths. They don’t get bogged down in efforts to make themselves less weak in particular areas. Instead, they find ways to compensate for weaknesses and take full advantage of strengths.
Many traders are much more familiar with their weaknesses than their strengths, especially after they’ve gone through a slump. They haven’t truly analyzed their performance to see what they do well. As long as that is the case, they cannot focus on those strengths and learn to apply them to a greater range of situations. The fundamental mistake keeps them problem-focused, when instead they should be building solutions.
Who you ultimately are—and what you’re truly good at—may be different from the person you’re trying to be. Michael Jordan longed to be a baseball player and could have spent untold years working on becoming a decent player. Fortunately, he returned to the NBA and to his very special talents.
After an exhaustive review of my trading performance, I found that I was most successful trading short-term morning patterns in the ES. I would love to be a longer-term trader and (at times of volatility and opportunity) a full-time trader, but that is not where my talents lie. The fundamental mistake would have me work on becoming less bad at trading afternoons or longer-term. The right application of psychology has me learning to build my consistency and grow my size at what I do best.
Sometimes the greatest challenge is the simplest: to just be who we really are and do what we do best—and embrace that for all it’s worth.
Wednesday, July 19, 2006
Market Update: Gauging the Breakout Move
Note: I will return to full daily market updates, along with links and market context, on Friday in the Trading Psychology Weblog.
After two days of unconvincing consolidation, we broke to the upside on Wednesday in the wake of Fed comments. The gauge of any breakout move is twofold: 1) we look for breadth as well as price strength, as those rising tides that lift all boats are more likely to be sustained; and 2) we look for the first pullback after the initial upthrust and see if the market can hold that level on subsequent selling. Those two conditions make for bull trend days.
Breadth was certainly present, as advancing issues outnumbered declines by over 2400 issues on the Big Board. I notice that my measure of Demand was a very, very strong 243; Supply was only 14. For those not familiar with this Weblog measure, it means that the number of stocks displaying significant upside momentum outnumbered those with significant downside momentum by a ratio of about 17:1. With this upthrust, we now see 46% of S&P 500 issues above their 50-day moving averages--not a level normally associated with market tops.
The usual pattern is for such broad strength to continue in the near term. Twice during the recent correction that did not happen after we had big up days. Nonetheless, as long as we see prices hold above that initial pullback level and the number of stocks making new highs expand, we have to go with what the market tells us on those big breakout moves.
After two days of unconvincing consolidation, we broke to the upside on Wednesday in the wake of Fed comments. The gauge of any breakout move is twofold: 1) we look for breadth as well as price strength, as those rising tides that lift all boats are more likely to be sustained; and 2) we look for the first pullback after the initial upthrust and see if the market can hold that level on subsequent selling. Those two conditions make for bull trend days.
Breadth was certainly present, as advancing issues outnumbered declines by over 2400 issues on the Big Board. I notice that my measure of Demand was a very, very strong 243; Supply was only 14. For those not familiar with this Weblog measure, it means that the number of stocks displaying significant upside momentum outnumbered those with significant downside momentum by a ratio of about 17:1. With this upthrust, we now see 46% of S&P 500 issues above their 50-day moving averages--not a level normally associated with market tops.
The usual pattern is for such broad strength to continue in the near term. Twice during the recent correction that did not happen after we had big up days. Nonetheless, as long as we see prices hold above that initial pullback level and the number of stocks making new highs expand, we have to go with what the market tells us on those big breakout moves.
Two Kinds of Traders
Since the publication of The Psychology of Trading, I've been honored to work with many groups of traders. Some have been home-based and independent; others have worked for proprietary trading firms, hedge funds, or investment banks. FWIW, I would say that, based on this experience, about half of what is written about trader psychology and successful trading is not grounded in reality. A simple example of this is the bromide that successful traders either control or eliminate their emotions in trading. I consistently find this to not be the case. Successful traders are extremely competitive individuals who, as a whole, hate losing. They don't take losing lightly, but they channel that emotion constructively, to enable them to overcome loss.
In general, I find there are two kinds of traders. The first kind trades visually, from patterns that are evident on visual inspection. Those include chart patterns, oscillator patterns, Elliott waves, and the like. Their trading decisions are discretionary, in that they elect to buy, hold, and sell based upon their perception of patterns and their judgment as to their meaning.
The second kind of trader distrusts visual inspection. Such traders are more likely to buy into the behavioral finance notion that unaided human perception and judgment are subject to a variety of biases. Accordingly, these traders use some form of historical/statistical analysis and/or system development to test ideas and trade only those that test out in a promising way.
Now here's the interesting part: The first group of traders almost universally asks me to help them tame their emotions. They have problems with impulsive trading, failing to honor risk limits, failing to take valid signals due to anxiety, etc. The second group of traders, having researched successful strategies, almost universally asks me to help them take maximum advantage of their edge. They want help taking *more* risk and trading larger positions.
The trading psychology literature focuses strongly on the first group of traders, because much of the universe of retail traders falls into this category. At many investment banks and hedge funds, however, visual trading is practically non-existent. If you don't have a model with a demonstrable edge, you don't trade. Such traders tend to have solid analytical strengths, but are not necessarily risk-takers.
So there you have it: some traders are risk-takers without a demonstrable edge; other traders are researchers who find an edge but have trouble assuming the risk of trading it. The true rarity is the trader who has both head and gut: the ability to find an edge and the fortitude to trade it aggressively.
In general, I find there are two kinds of traders. The first kind trades visually, from patterns that are evident on visual inspection. Those include chart patterns, oscillator patterns, Elliott waves, and the like. Their trading decisions are discretionary, in that they elect to buy, hold, and sell based upon their perception of patterns and their judgment as to their meaning.
The second kind of trader distrusts visual inspection. Such traders are more likely to buy into the behavioral finance notion that unaided human perception and judgment are subject to a variety of biases. Accordingly, these traders use some form of historical/statistical analysis and/or system development to test ideas and trade only those that test out in a promising way.
Now here's the interesting part: The first group of traders almost universally asks me to help them tame their emotions. They have problems with impulsive trading, failing to honor risk limits, failing to take valid signals due to anxiety, etc. The second group of traders, having researched successful strategies, almost universally asks me to help them take maximum advantage of their edge. They want help taking *more* risk and trading larger positions.
The trading psychology literature focuses strongly on the first group of traders, because much of the universe of retail traders falls into this category. At many investment banks and hedge funds, however, visual trading is practically non-existent. If you don't have a model with a demonstrable edge, you don't trade. Such traders tend to have solid analytical strengths, but are not necessarily risk-takers.
So there you have it: some traders are risk-takers without a demonstrable edge; other traders are researchers who find an edge but have trouble assuming the risk of trading it. The true rarity is the trader who has both head and gut: the ability to find an edge and the fortitude to trade it aggressively.
Tuesday, July 18, 2006
Market Update: Tracking the Bulls and Bears
A useful gauge of market sentiment that is based on what bears and bulls are *actually* doing, rather than on their stated leanings is the ratio of assets in Rydex bear and bull funds. A related set of measures tracks the flows of funds (cash flow) in and out of the bear and bull funds. Carl Swenlin of Decision Point does a great job of tracking these numbers.
What we find is that the ratio of bear and money market assets to bull assets is 1.16. Since 2004, intermediate-term bottoms in the market have all seen ratios greater than 1.0 but less than 1.5. Interestingly, this measure hit a very elevated reading of approximately 3.0 at the important cyclical market bottom in March, 2003. Thus, while the current readings are elevated as might be expected during a normal correction in a bull market, they are not the stuff of which bear market bottoms are made.
The Rydex cash flow measures show lower peaks for the bull funds and rising peaks for the bear funds, meaning that, with each market advance during much of 2005 and 2006, we see less money put into the bull funds. With each market decline, we've seen more money put to work in the bear funds.
We saw more rangebound action on Tuesday, but nothing to change the downward short-term trend. The number of stocks making new 20 day highs was 331; the new 20-day lows were 1748. We need to see sufficiently broad rally action to lift stocks off these lows before a bottoming process can commence. The last two days of consolidation have not provided that broad strength.
On another front, we see 30% of S&P 500 stocks trading above their 50-day moving averages. As noted earlier, readings below 20% have characterized intermediate-term market bottoms in the past several years.
I'll be returning to the Trading Psychology Weblog on Friday with a full update of market stats.
What we find is that the ratio of bear and money market assets to bull assets is 1.16. Since 2004, intermediate-term bottoms in the market have all seen ratios greater than 1.0 but less than 1.5. Interestingly, this measure hit a very elevated reading of approximately 3.0 at the important cyclical market bottom in March, 2003. Thus, while the current readings are elevated as might be expected during a normal correction in a bull market, they are not the stuff of which bear market bottoms are made.
The Rydex cash flow measures show lower peaks for the bull funds and rising peaks for the bear funds, meaning that, with each market advance during much of 2005 and 2006, we see less money put into the bull funds. With each market decline, we've seen more money put to work in the bear funds.
We saw more rangebound action on Tuesday, but nothing to change the downward short-term trend. The number of stocks making new 20 day highs was 331; the new 20-day lows were 1748. We need to see sufficiently broad rally action to lift stocks off these lows before a bottoming process can commence. The last two days of consolidation have not provided that broad strength.
On another front, we see 30% of S&P 500 stocks trading above their 50-day moving averages. As noted earlier, readings below 20% have characterized intermediate-term market bottoms in the past several years.
I'll be returning to the Trading Psychology Weblog on Friday with a full update of market stats.
How the Market Rewards Risk-Taking: Day of the Week and the Dow
 Since 2000 (N = 1642 trading days), the Dow Jones Industrial Average has lost a little more than 750 points. It turns out, however, that those points are hardly evenly distributed by day of the week.
On Mondays, the Dow has gained a cumulative 1932.63 points;
On Tuesdays, the Dow has gained 265.40 points;
On Wednesdays, the Dow has lost 466.45 points;
On Thursdays, the Dow has gained 1267.72 points;
On Fridays, the Dow has lost 3736.69 points.
In other words, if traders had simply bought at the close on Friday and sold at Thursday's close, instead of losing over 750 points, they would have gained nearly 3000 points.
Since 2006, the Dow is down on the year, but once again is up on a Monday through Thursday basis. Overall, since 2000, we have had 161 up Mondays and 169 down. Conversely, we've had 161 up Mondays and 147 down. (Interestingly, Mondays have not been profitable during 2006).
Could it be that risk-averse traders dump stocks on Friday, not wanting to hold positions over the weekend? If so, they've left an opportunity for those willing to assume risk by buying at the end of the week.
Monday, July 17, 2006
When Failed Patterns Are Good Market Indicators
Many of the measures I follow in the Trading Psychology Weblog each day are reflecting broad selling in the past several days. We recently saw stocks with significant downside momentum outnumber those with significant upside momentum by more than 10:1. Moreover, we've seen more sellers hitting bids than buyers lifting offers in the broad market for three consecutive days. During that time, declining stocks have outnumbered advancers by more than 2:1.
Does that reflect a degree of indiscriminate selling that might be associated with a market bounce once more rational valuations kick in?
I went back to 1990 (N = 4165 trading days) and, to my surprise, only found 41 occasions in which we've had a more lopsided ratio of decliners to advancers over a three-day period. That tells me that the recent selling is relatively extreme.
I looked at all occasions since 1990 in which the number of declining stocks over three days outnumbered advancing issues by more than 2:1 (N = 140). Two days later, the S&P 500 Index was up on average by .49% (93 up, 47 down). That is much stronger than the average two-day gain of .07% (2225 up, 1940 down) for the entire sample.
Interestingly, this pattern has held up during recent market history as well. Since 2004, we have had 27 occasions in which three-day declining stocks outnumbered advancers by more than 2:1. The S&P 500 Index was up two days later by an average of .52% (20 up, 7 down).
It does appear that such broad and concentrated selling yields favorable returns in the short run. That doesn't mean, however, that the pattern is not without its risks. As we were making lows in August, 1990, the pattern yielded two-day losses in excess of 3% before the market righted itself. The pattern also got ugly as we made an important bottom in March, 2004, giving us two-day losses of 3%. In late August, 1998, the pattern would have provided us with a bonecrushing loss of 8% in two days, and in September, 2001 (right after 9/11), we would have had a loss of over 5% in that time.
Note that the times the pattern failed big were relative washout periods in the market that ultimately provided superior buying opportunities. Ironically, when the pattern has failed in the short run, it has provided some of the best long-term returns. When markets go from a selling extreme to an even *greater* selling extreme, that's when you get bottoms of long-term interest.
Does that reflect a degree of indiscriminate selling that might be associated with a market bounce once more rational valuations kick in?
I went back to 1990 (N = 4165 trading days) and, to my surprise, only found 41 occasions in which we've had a more lopsided ratio of decliners to advancers over a three-day period. That tells me that the recent selling is relatively extreme.
I looked at all occasions since 1990 in which the number of declining stocks over three days outnumbered advancing issues by more than 2:1 (N = 140). Two days later, the S&P 500 Index was up on average by .49% (93 up, 47 down). That is much stronger than the average two-day gain of .07% (2225 up, 1940 down) for the entire sample.
Interestingly, this pattern has held up during recent market history as well. Since 2004, we have had 27 occasions in which three-day declining stocks outnumbered advancers by more than 2:1. The S&P 500 Index was up two days later by an average of .52% (20 up, 7 down).
It does appear that such broad and concentrated selling yields favorable returns in the short run. That doesn't mean, however, that the pattern is not without its risks. As we were making lows in August, 1990, the pattern yielded two-day losses in excess of 3% before the market righted itself. The pattern also got ugly as we made an important bottom in March, 2004, giving us two-day losses of 3%. In late August, 1998, the pattern would have provided us with a bonecrushing loss of 8% in two days, and in September, 2001 (right after 9/11), we would have had a loss of over 5% in that time.
Note that the times the pattern failed big were relative washout periods in the market that ultimately provided superior buying opportunities. Ironically, when the pattern has failed in the short run, it has provided some of the best long-term returns. When markets go from a selling extreme to an even *greater* selling extreme, that's when you get bottoms of long-term interest.
Sunday, July 16, 2006
May You Stay Forever Young
What prompted this Alphaville or Bob Dylan moment (actually, for the record, as I'm writing this The Sisters of Mercy are playing "More", which equally suits the occasion) was an exercise I tackled this weekend. I decided to research how I would make trading decisions if I *had* to place trades in the first few minutes after the open using only the most recent market data. Of course, this meant that I had to toss out all my historical research, indicators, etc. and figure things out from scratch.
It was really hard.
But it was amazing how I ended up seeing patterns in high frequency data that I would never have seen otherwise.
It even gave me an idea for a promising trading concept, based on figuring out the early odds of trending vs. mean reversion.
But it was really hard.
Of course, not everyone tackles these kinds of projects on weekends. Some people get by with a little understanding; some people get by with a whole lot more.
If I have one fear, it's the fear of ossification. It's that body snatchers fear that somehow, someway you'll wake up and become like everyone else. You'll think the same thoughts you always thought, visit the same places, listen to the same music. Imperceptibly, you'll have become old. Not in years, but in spirit.
I recently bought a new car. There were lots of great luxury cars on the market, with incredibly comfortable rides. So, of course, I bought the car with the performance-tuned suspension, rear wheel steering, and torque-at-every-point-in-the-curve. Not a comfortable car at all.
Hard to drive well.
Hard, like figuring out what to do in the markets based on several minutes of data.
But there's something to be said for operating out of the comfort zone. Novelty keeps you fresh. Throwing away the old, and facing the world with an empty mind is a bit scary, but it's the only thing that lets new things inside.
There's a great quote from a book I'm reading this summer: Lila, by Robert Pirsig:
"If you want to drink new tea you have to get rid of the old tea that's in your cup, otherwise you cup just overflows and you get a wet mess. Your head is like that cup. It has a limited capacity and if you want to learn something about the world you should keep your head empty in order to learn it. It's very easy to spend your whole life swishing old tea around in your cup thinking it's great stuff because you've never tried anything new, because you could never get it in, because the old stuff prevented its entry because you were so sure the old stuff was so good, because you never really tried anything new...on and on in an endless circular pattern" (p. 25).
Getting old is that endless circular pattern, the point at which you're snatched for good and forever entrenched in your comfort zone.
Better to be forever young: to always be willing to operate outside of comfort, encounter new experiences, and learn new things. But that takes an empty mind and a willingness to throw out old tea.
Back when I was in school, our teacher made us tell the class which animal we'd like to be.
Some students wanted to be dogs, others cats, some horses.
I said I'd like to be a moth, because moths burn themselves out chasing distant lights. That pretty well brought the exercise to a halt.
But hey, hey, my, my, Neil Young would have understood.
May you never rust.
May you stay forever young.
It was really hard.
But it was amazing how I ended up seeing patterns in high frequency data that I would never have seen otherwise.
It even gave me an idea for a promising trading concept, based on figuring out the early odds of trending vs. mean reversion.
But it was really hard.
Of course, not everyone tackles these kinds of projects on weekends. Some people get by with a little understanding; some people get by with a whole lot more.
If I have one fear, it's the fear of ossification. It's that body snatchers fear that somehow, someway you'll wake up and become like everyone else. You'll think the same thoughts you always thought, visit the same places, listen to the same music. Imperceptibly, you'll have become old. Not in years, but in spirit.
I recently bought a new car. There were lots of great luxury cars on the market, with incredibly comfortable rides. So, of course, I bought the car with the performance-tuned suspension, rear wheel steering, and torque-at-every-point-in-the-curve. Not a comfortable car at all.
Hard to drive well.
Hard, like figuring out what to do in the markets based on several minutes of data.
But there's something to be said for operating out of the comfort zone. Novelty keeps you fresh. Throwing away the old, and facing the world with an empty mind is a bit scary, but it's the only thing that lets new things inside.
There's a great quote from a book I'm reading this summer: Lila, by Robert Pirsig:
"If you want to drink new tea you have to get rid of the old tea that's in your cup, otherwise you cup just overflows and you get a wet mess. Your head is like that cup. It has a limited capacity and if you want to learn something about the world you should keep your head empty in order to learn it. It's very easy to spend your whole life swishing old tea around in your cup thinking it's great stuff because you've never tried anything new, because you could never get it in, because the old stuff prevented its entry because you were so sure the old stuff was so good, because you never really tried anything new...on and on in an endless circular pattern" (p. 25).
Getting old is that endless circular pattern, the point at which you're snatched for good and forever entrenched in your comfort zone.
Better to be forever young: to always be willing to operate outside of comfort, encounter new experiences, and learn new things. But that takes an empty mind and a willingness to throw out old tea.
Back when I was in school, our teacher made us tell the class which animal we'd like to be.
Some students wanted to be dogs, others cats, some horses.
I said I'd like to be a moth, because moths burn themselves out chasing distant lights. That pretty well brought the exercise to a halt.
But hey, hey, my, my, Neil Young would have understood.
May you never rust.
May you stay forever young.
Saturday, July 15, 2006
The Market is Wired Differently From Human Brains
Human brains are wired to think inductively. If something happens, then it happens again, and again, again, and again, we begin to perceive a regularity. We expect rainstorms to follow from dark, threatening clouds, not bright, blue skies. We've seen the pattern many times before.
It would be a strange world if hours of bright sun and blue sky increased the odds of rainfall, or if a stretch of rain suddenly reverted to brilliant, cloudless days.
Yet that is the world of the stock market. After spending time at one extreme, it is wired to revert to the opposite extreme. That means that, just when human brains expect one extreme to persist, the other one kicks in. As soon as the trader is ready to bring an umbrella to work, the sun comes out. No sooner does the trader put on suntan lotion than clouds appear and drench the poor fool.
There are all sorts of bits of wisdom about the market's tendency to reverse extremes. One trader recently reminded me that the truly great traders are bulls who buy big when the markets have made a plunge. "Yeah," I replied, "that's because they were smart enough to be in cash at the top."
It's nice to put points on the board, but it's still defense that wins Super Bowls, dude.
Quick: What's the total return of a trader who makes a 90% profit in Period One, 90% in Period Two, 90% in Period Three, and a 90% loss in Period Four? If I'm not mistaken, he's down nearly 33% on his original capital and needs a 50% gain just to return to where he started. That's where a 75% win/loss ratio will take you without risk management.
That's important, because the market is wired differently from human brains in one other respect. We're accustomed to events that are normally distributed. We expect our children to grow to a height somewhere between 4 and 7 feet, with a nice big cluster of expectations toward the middle. But if the market governed the growth of our kids, we'd have occasional clusters of offspring that were doll-sized or true giants. Three standard deviation events occur about half of one percent of the time normally, but far more often in markets.
So yes, while markets revert to their extremes, they also more often than normally push those extremes to extremes, wiping out those that rely on smug market wisdom.
Which gets us back to playing defense.
Even if your trading methods make you right 60% of the time and you trade once a day, you'll have, on average, five stretches of time in which you're wrong on four consecutive trades. Bet big on those four trades, and your winning system takes you to the poorhouse.
Just a note of caution from the same guy who tells you that over 1000 stocks made fresh 65-day lows on Friday. When that has happened since September, 2002 (N = 42), the S&P 500 (SPY) has been up 20 days later by an average of 3.59% (33 up, 9 down). That's a whole lot better than the average 20-day gain of .92% for that period as a whole (612 up, 333 down).
Of course, if you had bought that pattern in August, 1974 or October, 1987, the S&P 500 would have lost over 10% in a month's time, not one of life's kinder prospects for a leveraged trader.
Go with the odds, but make sure you can survive the odds you're wrong. Better advice than that I cannot give.
It would be a strange world if hours of bright sun and blue sky increased the odds of rainfall, or if a stretch of rain suddenly reverted to brilliant, cloudless days.
Yet that is the world of the stock market. After spending time at one extreme, it is wired to revert to the opposite extreme. That means that, just when human brains expect one extreme to persist, the other one kicks in. As soon as the trader is ready to bring an umbrella to work, the sun comes out. No sooner does the trader put on suntan lotion than clouds appear and drench the poor fool.
There are all sorts of bits of wisdom about the market's tendency to reverse extremes. One trader recently reminded me that the truly great traders are bulls who buy big when the markets have made a plunge. "Yeah," I replied, "that's because they were smart enough to be in cash at the top."
It's nice to put points on the board, but it's still defense that wins Super Bowls, dude.
Quick: What's the total return of a trader who makes a 90% profit in Period One, 90% in Period Two, 90% in Period Three, and a 90% loss in Period Four? If I'm not mistaken, he's down nearly 33% on his original capital and needs a 50% gain just to return to where he started. That's where a 75% win/loss ratio will take you without risk management.
That's important, because the market is wired differently from human brains in one other respect. We're accustomed to events that are normally distributed. We expect our children to grow to a height somewhere between 4 and 7 feet, with a nice big cluster of expectations toward the middle. But if the market governed the growth of our kids, we'd have occasional clusters of offspring that were doll-sized or true giants. Three standard deviation events occur about half of one percent of the time normally, but far more often in markets.
So yes, while markets revert to their extremes, they also more often than normally push those extremes to extremes, wiping out those that rely on smug market wisdom.
Which gets us back to playing defense.
Even if your trading methods make you right 60% of the time and you trade once a day, you'll have, on average, five stretches of time in which you're wrong on four consecutive trades. Bet big on those four trades, and your winning system takes you to the poorhouse.
Just a note of caution from the same guy who tells you that over 1000 stocks made fresh 65-day lows on Friday. When that has happened since September, 2002 (N = 42), the S&P 500 (SPY) has been up 20 days later by an average of 3.59% (33 up, 9 down). That's a whole lot better than the average 20-day gain of .92% for that period as a whole (612 up, 333 down).
Of course, if you had bought that pattern in August, 1974 or October, 1987, the S&P 500 would have lost over 10% in a month's time, not one of life's kinder prospects for a leveraged trader.
Go with the odds, but make sure you can survive the odds you're wrong. Better advice than that I cannot give.
Subscribe to:
Posts (Atom)


 Posts


