
Readers of the Trading Psychology Weblog are familiar with the Demand and Supply measures, which reflect the number of operating company stocks that are displaying significant bullish momentum (Demand) and bearish momentum (Supply). I measure this by seeing how many stocks close above and below two volatility envelopes: one surrounding a short-term moving average, the other surrounding an intermediate-term moving average. To qualify, the stock must close above both envelopes.
On Thursday, we had Supply exceed Demand by more than 10:1. I went back to September, 2002 (when I first began collecting these data) and looked at all occasions in which Supply was greater than 175 and exceeded Demand by at least 7:1 (N = 15). Instead of looking at what happens by the close of the following days (my usual analysis), I looked at the subsequent days' high and low prices in the S&P 500 Index (SPY).
What I found was that, during the next day of trade, 14 of the 15 occasions traded above their close at some point during the day. But 13 of the 15 occasions also traded below their close during the day. In all, 12 of the 15 days traded *both* above and below their prior day's close.
During the second day of trade after the extreme Supply reading, 13 of the 15 occasions traded above the close from the extreme day, and 13 also traded below the close. In all, 11 of the 15 days traded *both* above and below the close from two days prior.
In other words, in the short run, once there has been an extreme momentum day to the downside, it has been common to get volatility--but not necessarily directional volatility. Rather, prices have tended to whip above and below the close of the extreme downside momentum day. This might provide a note of caution to traders trying to ride short-term trends.
Friday, July 14, 2006
Thursday, July 13, 2006
One Way to Figure Out When the Trend Will End
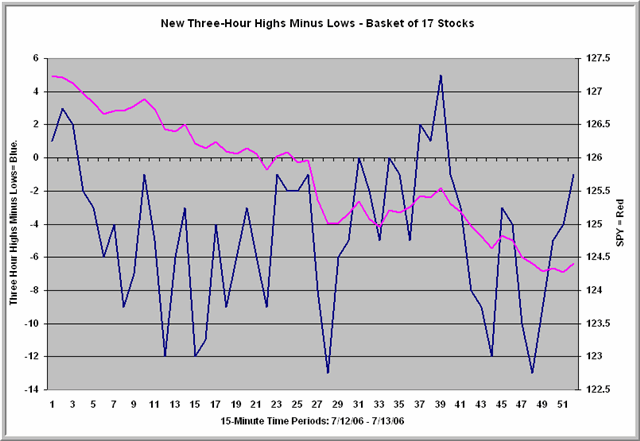
Is the market going to continue to trend or will it reverse?
Take a basket of stocks that represents (i.e. is well-correlated with) the index you're trading.
Count the proportion of those stocks that are making fresh closing highs minus lows on a three-hour basis and update that figure every 15 minutes.
If more than half of the stocks are participating in a market move, the odds of continuation are improved.
That was a useful guide today. Even on the rallies, 5 or fewer of the 17 stocks in my basket could muster new three-hour highs. On the declines, we consistently saw 10 or more registering new lows.
The cumulative tally of new highs minus new lows might be viewed as a kind of trend measure itself.
Time frames for new highs/lows shorter than 3 hours might help very short-term traders catch turns in markets.
Food for thought.


ETF vs. Exchange Volume: Why It Matters for the S&P 500
I've been working on a promising line of research that identifies the proportion of volume (intraday and daily) that is attributable to directional trading vs. arbitrage/program trading. It turns out that historical expectations are different when volume is elevated due to an increase in directional trading vs. an increase in arb.
Along the way doing that research, I began to look at the proportion of ETF volume to total stock exchange volume. Specifically, following a line of research that I originally heard about from Jason Goepfert, I looked at the proportion of daily SPY volume to total NYSE volume.
Yesterday, for example, we declined over 1% in SPY on an above-average proportion of SPY:NYSE volume. Since 2003 (N = 844 trading days), we've had 81 days in which SPY has declined by 1% or more. When the proportion of SPY:NYSE volume is above average (N = 40), the next two days in SPY average a gain of .44% (22 up, 18 down). When the proportion of SPY:NYSE volume is below average (N = 41), the next two days in SPY average a gain of only .13% (19 up, 22 down).
Similarly, when SPY has risen by 1% or more (N = 81), the proportion of SPY:NYSE volume has made a difference. When SPY has been strong and SPY volume is high relative to NYSE (N = 40), the next four days in SPY average a gain of .55% (26 up, 14 down). When SPY has been strong and SPY volume is low relative to NYSE (N = 41), the next four days in SPY average a gain of only .03% (22 up, 19 down).
This will be a promising line of research for other ETFs and their underlying indices.
Along the way doing that research, I began to look at the proportion of ETF volume to total stock exchange volume. Specifically, following a line of research that I originally heard about from Jason Goepfert, I looked at the proportion of daily SPY volume to total NYSE volume.
Yesterday, for example, we declined over 1% in SPY on an above-average proportion of SPY:NYSE volume. Since 2003 (N = 844 trading days), we've had 81 days in which SPY has declined by 1% or more. When the proportion of SPY:NYSE volume is above average (N = 40), the next two days in SPY average a gain of .44% (22 up, 18 down). When the proportion of SPY:NYSE volume is below average (N = 41), the next two days in SPY average a gain of only .13% (19 up, 22 down).
Similarly, when SPY has risen by 1% or more (N = 81), the proportion of SPY:NYSE volume has made a difference. When SPY has been strong and SPY volume is high relative to NYSE (N = 40), the next four days in SPY average a gain of .55% (26 up, 14 down). When SPY has been strong and SPY volume is low relative to NYSE (N = 41), the next four days in SPY average a gain of only .03% (22 up, 19 down).
This will be a promising line of research for other ETFs and their underlying indices.
Wednesday, July 12, 2006
When the Market is Up on Concentrated Selling
We have an unusual situation in which the S&P 500 Index (SPY) is up on a five-day basis thanks to yesterday's rally, but the NYSE Arms Index (TRIN) has been over 1.0 each of those five days. What this means is that volume has been concentrated in the falling stocks despite the fact that stocks overall have not been falling.
What happens when the five-day Arms is high, but the market is up over that five-day period? Does the bull go away or is it one big holiday?
First let's start with basics. Since 2003 (N = 842 trading days), we've had 211 days in which the five-day Arms Index has averaged over 1.0. Four days later, SPY has been up by an average .68% (143 up, 68 down). That is much stronger than the average four-day gain of .06% (335 up, 296 down) for the remainder of the sample.
When the five-day Arms Index has averaged more than 1.0 and SPY has been up over that five-day period (N = 50), the next four days in SPY average a gain of .88% (39 up, 11 down). That's a helluva edge.
I took a look at the high Arms/up SPY periods since 2005 to detect evidence of changing cycles (N = 20). The next four days in SPY averaged a gain of .46% (14 up, 6 down)--still a considerable upside edge.
In short, when stocks overall are strong but volume is concentrated in weak issues, the outlook for the market has been bullish. On average, it takes volume chasing the rise to put an end to the bull.
What happens when the five-day Arms is high, but the market is up over that five-day period? Does the bull go away or is it one big holiday?
First let's start with basics. Since 2003 (N = 842 trading days), we've had 211 days in which the five-day Arms Index has averaged over 1.0. Four days later, SPY has been up by an average .68% (143 up, 68 down). That is much stronger than the average four-day gain of .06% (335 up, 296 down) for the remainder of the sample.
When the five-day Arms Index has averaged more than 1.0 and SPY has been up over that five-day period (N = 50), the next four days in SPY average a gain of .88% (39 up, 11 down). That's a helluva edge.
I took a look at the high Arms/up SPY periods since 2005 to detect evidence of changing cycles (N = 20). The next four days in SPY averaged a gain of .46% (14 up, 6 down)--still a considerable upside edge.
In short, when stocks overall are strong but volume is concentrated in weak issues, the outlook for the market has been bullish. On average, it takes volume chasing the rise to put an end to the bull.
Tuesday, July 11, 2006
Heavy NASDAQ Selling: A Pattern That Hasn't Changed
We've seen heavy selling in the NASDAQ 100 Index (QQQQ) over the past four days, with the NASDAQ TRIN (Arms Index) averaging a whopping 2.15. Since March, 2003 (N = 842 trading days), when the four-day NASDAQ Arms Index averages over 1.5 (N = 71), the next four days in QQQQ average a very solid gain of 1.29% (50 up, 21 down). That's much stronger than the average four-day gain of .13% (411 up, 360 down) for the remainder of the sample.
By now, we've learned that patterns can shift. So I looked at the four-day NASDAQ Arms Index pattern since 2005 to see what has happened next. When the four-day Arms Index has exceeded 1.5 (N = 18), the next four days in QQQQ have averaged a gain of .62% (13 up, 5 down)--again much stronger than the average index performance. Interestingly, the edge has seemed to be on a multiday basis; the next trading day, we don't see a bullish edge.
My recent analyses are highlighting the importance of choosing the proper lookback periods for assessing market patterns and tendencies.
By now, we've learned that patterns can shift. So I looked at the four-day NASDAQ Arms Index pattern since 2005 to see what has happened next. When the four-day Arms Index has exceeded 1.5 (N = 18), the next four days in QQQQ have averaged a gain of .62% (13 up, 5 down)--again much stronger than the average index performance. Interestingly, the edge has seemed to be on a multiday basis; the next trading day, we don't see a bullish edge.
My recent analyses are highlighting the importance of choosing the proper lookback periods for assessing market patterns and tendencies.
Double Bottom: More Evidence of Changing Cycles
On Monday, we found the S&P 500 Index (SPY) establish some support near its Friday low, bouncing late in the day. I decided to look at days in which the low price of the day was within .10% of the low for the previous day. These can be viewed as candidates for double bottoms in the market. But do they really behave that way?
From March, 2003 to the present (N = 842 trading days), we've had 124 candidate double bottom days such as Monday. Two days later, SPY is up by an average of .19% (74 up, 50 down). That is stronger than the average two-day gain in SPY of .11% (452 up, 390 down).
When we divide the double bottom day sample in half, however, based upon when they occurred, a distinct pattern emerges.
When the double bottom patterns happened relatively early in the bull market (N = 62; March, 2003 - December, 2004), the next three days in SPY averaged a robust gain of .33% (41 up, 21 down). When the patterns have occurred later in the bull market (N = 62; late December, 2004 to the present), the next three days in SPY have averaged a tepid gain of .05% (33 up, 29 down).
Think of it this way: trends are what happen in between periods of consolidation. The double bottom formation is capturing a short-term consolidation in the market. Such consolidations tended to be followed by short-term gains in 2003-2004, but that has not been the case since then. How markets behave in the face of consolidation is itself a worthy trend indicator, one reason I track what the market does following "neutral trend periods" in the Trading Psychology Weblog.
From March, 2003 to the present (N = 842 trading days), we've had 124 candidate double bottom days such as Monday. Two days later, SPY is up by an average of .19% (74 up, 50 down). That is stronger than the average two-day gain in SPY of .11% (452 up, 390 down).
When we divide the double bottom day sample in half, however, based upon when they occurred, a distinct pattern emerges.
When the double bottom patterns happened relatively early in the bull market (N = 62; March, 2003 - December, 2004), the next three days in SPY averaged a robust gain of .33% (41 up, 21 down). When the patterns have occurred later in the bull market (N = 62; late December, 2004 to the present), the next three days in SPY have averaged a tepid gain of .05% (33 up, 29 down).
Think of it this way: trends are what happen in between periods of consolidation. The double bottom formation is capturing a short-term consolidation in the market. Such consolidations tended to be followed by short-term gains in 2003-2004, but that has not been the case since then. How markets behave in the face of consolidation is itself a worthy trend indicator, one reason I track what the market does following "neutral trend periods" in the Trading Psychology Weblog.
Monday, July 10, 2006
Down Day at the End of a Down Week: Changing Cycles?
Friday was a down day at the end of a five-day down period. What have been recent expectations after we've had a down session at the end of a down week?
Since 2004 (N = 628 trading days), we've had 142 down days at the end of down weeks. Four days later, the S&P 500 Index (SPY) has been up by an average .21% (85 up, 57 down). That is considerably stronger than the average four-day gain of .05% (259 up, 227 down) for the remainder of the sample.
Interestingly, however, during 2006 this pattern has not been profitable (N = 29). Four days after we've had a down day at the end of a down week, SPY has been down on average -.11% (16 up, 13 down).
This is but one example of how patterns that were showing up earlier in the bull market are not panning out well in the present environment. A similar shift of patterns occurred early in 2000 and was a helpful alert to a major change in trend.
Since 2004 (N = 628 trading days), we've had 142 down days at the end of down weeks. Four days later, the S&P 500 Index (SPY) has been up by an average .21% (85 up, 57 down). That is considerably stronger than the average four-day gain of .05% (259 up, 227 down) for the remainder of the sample.
Interestingly, however, during 2006 this pattern has not been profitable (N = 29). Four days after we've had a down day at the end of a down week, SPY has been down on average -.11% (16 up, 13 down).
This is but one example of how patterns that were showing up earlier in the bull market are not panning out well in the present environment. A similar shift of patterns occurred early in 2000 and was a helpful alert to a major change in trend.
Sunday, July 09, 2006
SOX: The Dynamics of Boom and Bust
Semiconductor stocks ($SOX) have been weak of late, but it's important to take a step back and recognize that these stocks have been weak for years now. Let's go back and retrace the incredible bull and bear run in these issues and see if we might learn something about the dynamics of market bubbles and their bursting.
We start in October, 1996. The SOX is trading in the 180s. Six months later, the SOX had gained 50%, reaching the 290s in February of 1997. By August of that year, the SOX was trading in the 390's--a double within a year's time--before thudding back to earth in the 240s by the end of the year.
By April, 1998, the SOX is back to the 320s, rising about a third in several months' time, before again crashing to the 180s in October of that year.
What we see in the SOX are periods of significant boom and bust that left the average unchanged over a two-year period and this was before the real boom and bust had occurred! In other words, the prelude to the bubble and the burst of the bubble was significant volatility.
Now the bubble begins in earnest. From October, 1998 to January, 1999 the SOX index doubles in value. A consolidation through May of that year is followed by another 50% spike higher by September, 1999, leaving the SOX in the 570s. Within a year's time, the SOX has tripled in value.
A quick bust in October, 1999 takes about 100 points off the index, but this ground is retraced--and more--by the end of the month. Then, from October, 1999 to March, 2000, the SOX moves steadily higher to an amazing 1362: well over doubling in less than half a year's time. Indeed, in about a year's time, the SOX had almost quadrupled in value.
Now came the bust. Just one month later, in April, 2000, the SOX was down to the 870s, an amazing drop of over a third. The average made it back over 1200 by July of that year--incredible volatility--only to fall back to the 880s later that month and rise back to the 1100s in September. Then, by November, the SOX dropped all the way to 516: more than a 50% drop in just two months. We bounced to the 700s by January, 2001--still significant volatility--but that would prove the index high that year. In the aftermath of 9/11, the SOX declined all the way back to the 340s.
And the eventual market bottom? After a vigorous bounce to the 600s in March, 2002 (still phenomenal volatility), we dropped unceremoniously to the very low 200s in October of that year. With that, we had retraced nearly all gains back to that 1996 beginning.
The SOX bounced nicely after that, hitting 560 in January, 2004. Since then, levels above 500 have been stymied. Most recently, we peaked in the 530s in April, 2006 and are now trading in the 420s.
What the SOX tell us is that, even with the bull market of 2002-present, we are down 2/3 from the market peak in 2000 and down even from that bounce off the September, 2001 lows. While much of the rest of the market has been in bull mode--especially the smaller caps--the SOX (and much of its NASDAQ cohorts) has been unwinding its market bubble.
If the bubble experiences of gold in 1980 and Japan's stock market in the late 1980s are any indication, it could take years to unwind the incredible run in the SOX. Indeed, as hard as it may be to fathom, it may well be that we have not yet seen the ultimate post-bubble lows in many of these stocks.
And the bubble markets of today? We will see them first by their boom-bust volatility; then by their ramping volume and new highs. As we can see from the SOX, however, these remain volatile--and potentially profitable--trading vehicles well after their bull peaks. In their boom-bust behavior, gold (and other metals) and emerging country stocks are certainly candidates.
An important paper by Lee and Swaminathan details the momentum lifecycles of stocks. If you read it carefully, you'll develop a deep appreciation for how booms and busts occur--and how you might locate the next ones.
We start in October, 1996. The SOX is trading in the 180s. Six months later, the SOX had gained 50%, reaching the 290s in February of 1997. By August of that year, the SOX was trading in the 390's--a double within a year's time--before thudding back to earth in the 240s by the end of the year.
By April, 1998, the SOX is back to the 320s, rising about a third in several months' time, before again crashing to the 180s in October of that year.
What we see in the SOX are periods of significant boom and bust that left the average unchanged over a two-year period and this was before the real boom and bust had occurred! In other words, the prelude to the bubble and the burst of the bubble was significant volatility.
Now the bubble begins in earnest. From October, 1998 to January, 1999 the SOX index doubles in value. A consolidation through May of that year is followed by another 50% spike higher by September, 1999, leaving the SOX in the 570s. Within a year's time, the SOX has tripled in value.
A quick bust in October, 1999 takes about 100 points off the index, but this ground is retraced--and more--by the end of the month. Then, from October, 1999 to March, 2000, the SOX moves steadily higher to an amazing 1362: well over doubling in less than half a year's time. Indeed, in about a year's time, the SOX had almost quadrupled in value.
Now came the bust. Just one month later, in April, 2000, the SOX was down to the 870s, an amazing drop of over a third. The average made it back over 1200 by July of that year--incredible volatility--only to fall back to the 880s later that month and rise back to the 1100s in September. Then, by November, the SOX dropped all the way to 516: more than a 50% drop in just two months. We bounced to the 700s by January, 2001--still significant volatility--but that would prove the index high that year. In the aftermath of 9/11, the SOX declined all the way back to the 340s.
And the eventual market bottom? After a vigorous bounce to the 600s in March, 2002 (still phenomenal volatility), we dropped unceremoniously to the very low 200s in October of that year. With that, we had retraced nearly all gains back to that 1996 beginning.
The SOX bounced nicely after that, hitting 560 in January, 2004. Since then, levels above 500 have been stymied. Most recently, we peaked in the 530s in April, 2006 and are now trading in the 420s.
What the SOX tell us is that, even with the bull market of 2002-present, we are down 2/3 from the market peak in 2000 and down even from that bounce off the September, 2001 lows. While much of the rest of the market has been in bull mode--especially the smaller caps--the SOX (and much of its NASDAQ cohorts) has been unwinding its market bubble.
If the bubble experiences of gold in 1980 and Japan's stock market in the late 1980s are any indication, it could take years to unwind the incredible run in the SOX. Indeed, as hard as it may be to fathom, it may well be that we have not yet seen the ultimate post-bubble lows in many of these stocks.
And the bubble markets of today? We will see them first by their boom-bust volatility; then by their ramping volume and new highs. As we can see from the SOX, however, these remain volatile--and potentially profitable--trading vehicles well after their bull peaks. In their boom-bust behavior, gold (and other metals) and emerging country stocks are certainly candidates.
An important paper by Lee and Swaminathan details the momentum lifecycles of stocks. If you read it carefully, you'll develop a deep appreciation for how booms and busts occur--and how you might locate the next ones.
Saturday, July 08, 2006
QQV: NASDAQ Option Volatility and Short-Term Returns
The QQV is a measure of the implied volatility of a hypothetical at-the-money QQQQ (NASDAQ 100 Index) option, expressed as an annual standard deviation of returns. It is intended as a measure of trader sentiment regarding future volatility of the Index. Like the better known VIX, QQV tends to rise in falling markets and fall in rising markets.
Since 2004 (N = 623 trading days), when QQV has made a 10-day low (N = 102), the next five days in QQQQ have averaged a loss of -.14% (49 up, 53 down). That is worse than the average five-day gain in QQQQ of .08% (271 up, 250 down) for the remainder of the sample.
On the other hand, when QQV has made a 10-day high (N = 87), the next five days in QQQQ have averaged a sizable gain of .48% (55 up, 32 down). That is much stronger than the average five-day loss in QQQQ of -.03% (265 up, 271 down).
It appears that when traders are feeling safest--i.e., expecting the least volatility--returns are subnormal in the NASDAQ. When traders are expecting the greatest turmoil, returns are superior. Perhaps there really is opportunity in crisis!
Since 2004 (N = 623 trading days), when QQV has made a 10-day low (N = 102), the next five days in QQQQ have averaged a loss of -.14% (49 up, 53 down). That is worse than the average five-day gain in QQQQ of .08% (271 up, 250 down) for the remainder of the sample.
On the other hand, when QQV has made a 10-day high (N = 87), the next five days in QQQQ have averaged a sizable gain of .48% (55 up, 32 down). That is much stronger than the average five-day loss in QQQQ of -.03% (265 up, 271 down).
It appears that when traders are feeling safest--i.e., expecting the least volatility--returns are subnormal in the NASDAQ. When traders are expecting the greatest turmoil, returns are superior. Perhaps there really is opportunity in crisis!
Friday, July 07, 2006
Market Returns as Cycles Age: More on Time as an Indicator
In the last post, we saw how time can serve as a market indicator that measures how long it takes an expectable event to occur. The longer we had gone without seeing a five-day price high, the more bullish were the near term returns. In a Trading Markets article due out today, I also found this dynamic to hold for the number of 20-day lows exceeding 20-day highs. The longer it takes for us to get a reading in which 20 day highs exceed 20-day lows, the more bullish the short-term outcomes. (Note: 20 day new highs and lows are reported daily in the Trading Psychology Weblog).
But does this dynamic work the other way as well? If we see a long time pass before we see 20-day new lows exceed new highs, does that have bearish implications?
It appears so. Since 2004 (N = 609), we've had 84 daily occasions in which there have been 15 or more days passing before we've seen 20 day lows exceed new highs. Five days later, the S&P 500 Index (SPY) has been down by an average -.22% (39 up, 45 down). That is much weaker than the average five-day gain of .16% (296 up, 229 down) for the remainder of the sample.
Once again, we see that the market confounds human nature. Returns are subnormal when we've had a run of market strength (new highs outnumbering new lows) and--as the Trading Markets article shows--returns are superior when we've had a run of market weakness (new lows outnumbering new highs).
What this indicator is tapping, I believe, is cyclical behavior in the markets. By measuring the time that elapses before bullish or bearish market events occur, we are really assessing the aging of market cycles. It is not surprising from this vantage point that, as cycles age, countertrend returns become superior. It will be interesting to look at this phenomenon on longer time frames.
But does this dynamic work the other way as well? If we see a long time pass before we see 20-day new lows exceed new highs, does that have bearish implications?
It appears so. Since 2004 (N = 609), we've had 84 daily occasions in which there have been 15 or more days passing before we've seen 20 day lows exceed new highs. Five days later, the S&P 500 Index (SPY) has been down by an average -.22% (39 up, 45 down). That is much weaker than the average five-day gain of .16% (296 up, 229 down) for the remainder of the sample.
Once again, we see that the market confounds human nature. Returns are subnormal when we've had a run of market strength (new highs outnumbering new lows) and--as the Trading Markets article shows--returns are superior when we've had a run of market weakness (new lows outnumbering new highs).
What this indicator is tapping, I believe, is cyclical behavior in the markets. By measuring the time that elapses before bullish or bearish market events occur, we are really assessing the aging of market cycles. It is not surprising from this vantage point that, as cycles age, countertrend returns become superior. It will be interesting to look at this phenomenon on longer time frames.
Thursday, July 06, 2006
How the Market Confounds Human Nature: Time as a Market Indicator
Normally, we look for the occurrence of an event to signal a possible directional edge in the marketplace. In this analysis and the ones that will follow, we're actually looking at the absence of an occurrence as our market signal. Specifically, we'll take a look at how many days pass in the market before we see the S&P 500 (SPY) make a five-day price high. If many days pass without a five-day price high, we know we've been in a downtrend. If zero days pass without a five-day high, that means that the current trading session includes a five-day high.
Since March, 2003 (N = 833), we've had 77 days in which eight or more days have lapsed before making a five-day high. (The largest number of days without a five-day high during this period was 15, achieved during May, 2004 and March, 2005). Two days after the string of eight or more days without a high, SPY was up by an average of .39% (51 up, 26 down). That is much stronger than the average two-day gain of .07% (397 up, 359 down) for the remainder of the sample.
When the market has actually made a five-day high during the current trading session (N = 298), the next two days in SPY have averaged a gain of only .03% (156 up, 142 down). Streaks without a five-day high have thus been bullish in the short run, while the achievement of a five-day high has led to subnormal returns in the near term.
This is a good example of how the market runs contrary to human nature. After many days without price highs, traders tend to become bearish (as shown by sentiment measures). Once we achieve price highs, there is a tendency to become bullish. This overweighting of recent market information keeps players on the wrong side of short-term market cycles.
Since March, 2003 (N = 833), we've had 77 days in which eight or more days have lapsed before making a five-day high. (The largest number of days without a five-day high during this period was 15, achieved during May, 2004 and March, 2005). Two days after the string of eight or more days without a high, SPY was up by an average of .39% (51 up, 26 down). That is much stronger than the average two-day gain of .07% (397 up, 359 down) for the remainder of the sample.
When the market has actually made a five-day high during the current trading session (N = 298), the next two days in SPY have averaged a gain of only .03% (156 up, 142 down). Streaks without a five-day high have thus been bullish in the short run, while the achievement of a five-day high has led to subnormal returns in the near term.
This is a good example of how the market runs contrary to human nature. After many days without price highs, traders tend to become bearish (as shown by sentiment measures). Once we achieve price highs, there is a tendency to become bullish. This overweighting of recent market information keeps players on the wrong side of short-term market cycles.
Wednesday, July 05, 2006
When New 20-Day Highs Make New 20-Day Highs
On Friday--and then again on Monday--the number of stocks making fresh 20-day highs itself made a high reading for the past 20 sessions. Since 2004, we've had 43 occasions in which the 20-day highs have made 20-day highs. What we see going forward is a modest short-term momentum effect in the S&P 500 (SPY). Two days later, SPY is up by an average .22% (25 up, 18 down), stronger than the average gain of .06% for the sample overall. Beyond two days, going out to as far as 20 days, there is no edge when new highs hit new highs. It has not been profitable to short such occasions overall; but neither have there been superior upside returns.
Since 2004, when 20-day highs have made 5-day peaks, but not peaks at 10 and 20 days (which tends to occur in topping markets), returns over the next two days are actually subnormal. It's when 20-day highs are also at 20-day highs that we see the modest momentum effect.
Since 2004, when 20-day highs have made 5-day peaks, but not peaks at 10 and 20 days (which tends to occur in topping markets), returns over the next two days are actually subnormal. It's when 20-day highs are also at 20-day highs that we see the modest momentum effect.
Tuesday, July 04, 2006
Near-Perfect Market Indicator Discovered
Years of Research Reveals Consistent Trading Edge in Aurora, IL
Stock market researchers at the University of Chicago yesterday announced a breakthrough in their efforts to find the perfect market indicator. He is Delbert Dunmore, a home-based trader in Aurora, Illinois.
According to Giovanni Celini, Ph.D. of the University's Institute for Market Research, Mr. Dunmore has failed to make money for 18 consecutive years of trading, with only a single month of gains during that time.
"This is a result far beyond chance," Dr. Celini noted. "Mr. Dunmore has been remarkably consistent in his ability to lose money."
At first, the University researchers thought that Dunmore had discovered a key to losing in the markets. Only after careful observation, however, did they find that Dunmore himself was the key.
"The man has incredibly poor judgment," Dr. Celini reports in The Behavioral Finance Journal. "We call it a 'Reverse Midas Effect': everything he touches turns to shit."
Dr. Wayne Byerly, behavioral finance researcher at Cornell University, believes that the Reverse Midas Effect may win the Chicago researchers a Nobel Prize. "Mr. Dunmore is helping us answer questions that have never been asked before, such as 'What keeps people trading when they are so obviously devoid of talent?'"
None of this seems to faze the 42 year old Illinois trader, who was recently hired by a well-known New York investment bank to head their Contrary Opinion desk. "People say I lose all the time," Dunmore explained, "but at least I'm good at something." Indeed, his incredible consistency has brought him celebrity status, as he recently shared a STuBY award with Native Americans, Salem witches, and the Chicago Cubs, honoring America's greatest losers.
His brush with fame, however, almost never came to be as he recently experienced his first winning month in nearly two decades of trading. "I felt pretty good coming into June," Dunmore explained, "and I bought a boatload of Harold's Stores (HLD) stock in the middle of the month. I didn't realize that I typed in the wrong symbol, though, and wound up owning the exchange-traded fund for gold (GLD). Damn thing went through the roof."
This was quite a blow for Dunmore. "I couldn't believe I lost my losing streak," he lamented. "For days, I went around feeling like a total loser."
Lately, however, the Chicago suburbanite has returned to consistent form, as he shorted the oil market after reading an online bulletin board tip that massive new hurricanes had not demolished the Gulf coast overnight. This trade was so spectacularly misconceived that it landed Dunmore a spot on a local access cable television show in Aurora.
Dunmore attributes his success as a market failure to a strategy a trading coach helped him implement many years ago. "At the end of every year, I replenish my trading account," he explained. "If I didn't do that, I'd never have become the trader I am today."
Bio:
Brett N. Steenbarger, Ph.D. lives perilously close to Aurora, IL and offers a tip of the hat to The Onion and the many Delbert Dunmores who keep trading psychologists busy.
Three Consecutive Days of Buying: What Happens Next?
 We've had three consecutive days of strong buying, as shown by high readings of over +400 in the Adjusted NYSE TICK (quoted daily in the Trading Psychology Weblog). Since July 2003 (N = 750 trading days), we've had 24 similar occasions of strong buying for three straight days. On average, the next trading day in the S&P 500 Index (SPY) has risen by .32% (16 up, 8 down). That is considerably stronger than the average one-day gain of .03% (397 up, 353 down) for the sample overall.
Viewed differently, when the Adjusted TICK has averaged more than +500 per day over a three-day period (N = 47), the next three days in SPY have averaged an impressive gain of .46% (34 up, 13 down). That is much stronger than the average three-day gain of .09% (427 up, 323 down) for the entire sample.
As noted in the previous post, periods of very strong buying, as measured by the Adjusted TICK, tend to be followed by strength in the short run. We have had a solid burst of buying off the recent lows, kicked off by the Fed announcement. Such bursts, on average, have not quickly reversed themselves. I mentioned yesterday that we were not, as of that writing, at a point where we typically see positive momentum effects. With Monday's solid buying, that is no longer the case.
Monday, July 03, 2006
The NYSE TICK and Momentum Effects
The Adjusted NYSE TICK is a measure of the number of stocks trading at their bid vs. offer price at 10 second intervals through the day, with the raw values adjusted to create a zero mean. This statistic is summed to create a daily measure of buying and selling pressure and is reported each day on the Trading Psychology Weblog.
The Adjusted TICK captures interesting short-term momentum effects in the S&P 500 Index (SPY). Since July, 2003 (N = 741 trading days), when the five-day Adjusted TICK has exceeded 1500 (N = 71), the next five days in SPY have averaged a gain of .53% (49 up, 22 down). That is much stronger than the average five-day gain of .16% (414 up, 327 down) for the sample overall.
This suggests that strong buying interest tends to be followed by additional market strength in the short run.
When the five-day Adjusted TICK has been less than -1500 (N = 78), the next five days in SPY have averaged a gain of .54% (50 up, 28 down). Again, this is much stronger than the average five-day gain.
This indicates that strong selling pressure tends to reverse in the near term.
The bottom line is that, on a five-day basis, very strong, positive Adjusted TICK readings and very weak, negative readings have been associated with favorable returns. When the Adjusted TICK has been neither very strong nor weak (N = 592), the average five-day gain in SPY has been only .06% (315 up, 277 down), far weaker than when the Adjusted TICK is nearer its extremes. Of the indicators I've tested, the Adjusted TICK appears to be most sensitive to these momentum effects.
Interestingly, despite the big rise in the market on the heels of the Fed announcement, we are not at a level in the Adjusted TICK that is normally associated with short-term positive momentum effects.
The Adjusted TICK captures interesting short-term momentum effects in the S&P 500 Index (SPY). Since July, 2003 (N = 741 trading days), when the five-day Adjusted TICK has exceeded 1500 (N = 71), the next five days in SPY have averaged a gain of .53% (49 up, 22 down). That is much stronger than the average five-day gain of .16% (414 up, 327 down) for the sample overall.
This suggests that strong buying interest tends to be followed by additional market strength in the short run.
When the five-day Adjusted TICK has been less than -1500 (N = 78), the next five days in SPY have averaged a gain of .54% (50 up, 28 down). Again, this is much stronger than the average five-day gain.
This indicates that strong selling pressure tends to reverse in the near term.
The bottom line is that, on a five-day basis, very strong, positive Adjusted TICK readings and very weak, negative readings have been associated with favorable returns. When the Adjusted TICK has been neither very strong nor weak (N = 592), the average five-day gain in SPY has been only .06% (315 up, 277 down), far weaker than when the Adjusted TICK is nearer its extremes. Of the indicators I've tested, the Adjusted TICK appears to be most sensitive to these momentum effects.
Interestingly, despite the big rise in the market on the heels of the Fed announcement, we are not at a level in the Adjusted TICK that is normally associated with short-term positive momentum effects.
Sunday, July 02, 2006
An Unusually Sensitive Indicator--and What It Says Now
I recently posted on the topic of when Demand (the number of stocks displaying significant upside short- and intermediate-term momentum) exceeds Supply (the number of stocks displaying significant downside momentum on both timeframes). These figures, recall, represent an index computed from the number of operating company stocks that close above and below volatility envelopes surrounding two moving averages. The daily values are posted daily to the Trading Psychology Weblog.
I've noticed over the years that, by cumulating the daily difference between Demand and Supply, we obtain a very reliable overbought/oversold indicator. Since October, 2002 (N = 946 trading days), this index has varied between +57 and -36. The value of this cumulative Demand/Supply Index have correlated quite nicely with five-day returns in the S&P 500 Index (SPY).
After Thursday's sizable rally, we hit an overbought cumulative index value of +50. Since October, 2002, we've only had 20 daily readings of +50 or greater. Over the next five days, the S&P 500 Index has averaged a loss of -1.05% (!), with 3 occasions up, 17 down. That's about as sizable a downside edge as I've seen from an indicator.
Overall, when the cumulative Demand/Supply Index has been in negative territory (N = 208), the next five days in SPY have averaged a gain of .59% (126 up, 82 down). When the index has been in positive territory (N = 738), the next five days in SPY have averaged a gain of .10% (401 up, 337 down).
In general, readings above +40 have yielded meaningfully bearish returns; readings below -10 have been extremely bullish. The low for the recent downturn was -2 on 6/14; at the May peak on 5/5, we saw a reading of +55. I'll keep a close eye on this unusually sensitive indicator and report readings on the Trading Psychology Weblog and further research here.
I've noticed over the years that, by cumulating the daily difference between Demand and Supply, we obtain a very reliable overbought/oversold indicator. Since October, 2002 (N = 946 trading days), this index has varied between +57 and -36. The value of this cumulative Demand/Supply Index have correlated quite nicely with five-day returns in the S&P 500 Index (SPY).
After Thursday's sizable rally, we hit an overbought cumulative index value of +50. Since October, 2002, we've only had 20 daily readings of +50 or greater. Over the next five days, the S&P 500 Index has averaged a loss of -1.05% (!), with 3 occasions up, 17 down. That's about as sizable a downside edge as I've seen from an indicator.
Overall, when the cumulative Demand/Supply Index has been in negative territory (N = 208), the next five days in SPY have averaged a gain of .59% (126 up, 82 down). When the index has been in positive territory (N = 738), the next five days in SPY have averaged a gain of .10% (401 up, 337 down).
In general, readings above +40 have yielded meaningfully bearish returns; readings below -10 have been extremely bullish. The low for the recent downturn was -2 on 6/14; at the May peak on 5/5, we saw a reading of +55. I'll keep a close eye on this unusually sensitive indicator and report readings on the Trading Psychology Weblog and further research here.
Saturday, July 01, 2006
When Institutions Are Strong Buyers
As noted in recent posts here, the Trading Psychology Weblog tracks Institutional Buying and Institutional Selling as separate variables. Often, as before the Fed announcement, markets will move up not because of high buying, but because of the absence of normal selling activity. Other times, as on the Thursday of the Fed announcement, we see the market move up on *both* above average buying *and* below average selling. This reveals a true demand among institutions.
Going back to July, 2003 (N = 742 trading days), I found 25 days in which Institutional Buying was very strong (over +400) and Institutional Selling was very light (over +400). Interestingly, there was no edge for the next day of trading, as the average price change for SPY was a loss of -.09% (12 up, 13 down). This is weaker than the average one-day change of .03% (404 up, 338 down) for the sample overall.
By four days out, however, the strong Institutional Buying days averaged a gain of .20% (15 up, 10 down). This is modestly stronger than the average gain of .13% (409 up, 333 down) for the sample as a whole.
This is a common pattern I've found after market gains: very near term consolidation followed by renewed short-term strength. We saw a bit of that consolidation on Friday and, post holiday, will have an opportunity to see if this rise lives up to the historical pattern.
Going back to July, 2003 (N = 742 trading days), I found 25 days in which Institutional Buying was very strong (over +400) and Institutional Selling was very light (over +400). Interestingly, there was no edge for the next day of trading, as the average price change for SPY was a loss of -.09% (12 up, 13 down). This is weaker than the average one-day change of .03% (404 up, 338 down) for the sample overall.
By four days out, however, the strong Institutional Buying days averaged a gain of .20% (15 up, 10 down). This is modestly stronger than the average gain of .13% (409 up, 333 down) for the sample as a whole.
This is a common pattern I've found after market gains: very near term consolidation followed by renewed short-term strength. We saw a bit of that consolidation on Friday and, post holiday, will have an opportunity to see if this rise lives up to the historical pattern.
Friday, June 30, 2006
When Demand Swamps Supply
The Demand measure followed by the Trading Psychology Weblog is an index of the number of stocks displaying significant momentum (bullish/bearish) on a short- and intermediate-term basis. After Thursday's rise on the heels of the Fed news, we had the strongest Demand to Supply reading since the bull market began in late 2002.
When Demand has been extraordinarily high (over 160; N = 12) since October, 2002 (N = 942), the market (SPY) has been up by an average of .78% four days later (11 up, 1 down)--much stronger than the average four-day gain of .16% (518 up, 424 down) for the entire sample.
This fits well with my prior research, which suggests that strong and broad upmoves tend to persist in the near term.
When Demand has been extraordinarily high (over 160; N = 12) since October, 2002 (N = 942), the market (SPY) has been up by an average of .78% four days later (11 up, 1 down)--much stronger than the average four-day gain of .16% (518 up, 424 down) for the entire sample.
This fits well with my prior research, which suggests that strong and broad upmoves tend to persist in the near term.
Thursday, June 29, 2006
The Dual Road to Trading Success
By collecting hard data on our trading--metrics on the average size, holding time, and number of winning/losing trades; performance under different market conditions, etc.--we work on developing our market edge and we work on our ability to consistently exploit that edge. Knowing what we're doing and how well we're doing it tells us what we're doing right (so we can do more of it) and what we're doing wrong (so we can make improvements). We have patterns of success and we have patterns of failure; the challenge is identifying and understanding these and using them to spur improvement.
"Trading success is a function of possessing a statistical edge in the market and being able to exploit this edge with regularity. Trading failure is most likely to occur when you trade subjective, untested methods that possess no valid edge or when you are incapable of consistently applying edges that are available. Improving your psychology as a trader by itself will not confer an objective edge. Developing or purchasing a valid trading system will not in and of itself make you a great trader. The development of trading methods and the development of yourself as a trader thus must proceed in concert. You are only as good as the methods you implement and your ability to implement the methods."
"Trading success is a function of possessing a statistical edge in the market and being able to exploit this edge with regularity. Trading failure is most likely to occur when you trade subjective, untested methods that possess no valid edge or when you are incapable of consistently applying edges that are available. Improving your psychology as a trader by itself will not confer an objective edge. Developing or purchasing a valid trading system will not in and of itself make you a great trader. The development of trading methods and the development of yourself as a trader thus must proceed in concert. You are only as good as the methods you implement and your ability to implement the methods."
The Psychology of Trading, p. 295
Wednesday, June 28, 2006
A Lesson to be Learned--and Relearned
Charles Kirk a little while back made the useful observation that keeping a journal provides a great resource much later in time when you reacquaint yourself with your own best ideas. The most important trading lessons, such as risk management, are ones that not only have to be learned, but relearned. Our journals and notes can be valuable tools of relearning. Here's one of my own writings that I've revisited lately in pursuit of new research and trading methods:
"A stationary price series is one that is generated by a single process. If cards are drawn at random from a deck in a game of blackjack, the distribution of cards selected will show evidence of stationarity; that is, they will follow a stable, predictable distribution over time.
If, however, the dealer at the casino shifts from using a single deck of cards to using a shoe of several decks, the distribution of cards selected will change. The distribution will now show evidence of nonstationarity--there will be significant differences in the frequency of cards coming up using many decks versus one.
Stationarity is important to traders because every so often the markets switch the number of decks from which they're dealing. The market will meander in a given direction with low volatility for a while and then suddenly zoom off on high volatility. If you look at the statistical distribution of price changes, you can see evidence of nonstationarity...
One of the greatest weaknesses of the methods utilized by many traders I have interviewed is the failure to assess stationarity and factor that into decisions. Instead of identifying the type of market they are in and trading methods specific to that kind of market, they adopt mechanical signals and uniform chart or oscillator patterns to apply to all markets. As long as the market works from the same number of decks, their methods may produce profits. Once the changing cycles described by Niederhoffer change the decks, however, the formerly useful methodologies will produce substandard results.
Any single set of trading rules or methods is vulnerable to breakdown if repeatedly traded across nonstationary periods."
"A stationary price series is one that is generated by a single process. If cards are drawn at random from a deck in a game of blackjack, the distribution of cards selected will show evidence of stationarity; that is, they will follow a stable, predictable distribution over time.
If, however, the dealer at the casino shifts from using a single deck of cards to using a shoe of several decks, the distribution of cards selected will change. The distribution will now show evidence of nonstationarity--there will be significant differences in the frequency of cards coming up using many decks versus one.
Stationarity is important to traders because every so often the markets switch the number of decks from which they're dealing. The market will meander in a given direction with low volatility for a while and then suddenly zoom off on high volatility. If you look at the statistical distribution of price changes, you can see evidence of nonstationarity...
One of the greatest weaknesses of the methods utilized by many traders I have interviewed is the failure to assess stationarity and factor that into decisions. Instead of identifying the type of market they are in and trading methods specific to that kind of market, they adopt mechanical signals and uniform chart or oscillator patterns to apply to all markets. As long as the market works from the same number of decks, their methods may produce profits. Once the changing cycles described by Niederhoffer change the decks, however, the formerly useful methodologies will produce substandard results.
Any single set of trading rules or methods is vulnerable to breakdown if repeatedly traded across nonstationary periods."
From The Psychology of Trading; p. 86-7.
Tuesday, June 27, 2006
Top Ten Reasons Traders Lose Their Discipline
Losing discipline is not a trading problem; it is the common result of a number of trading-related problems. Here are the most common sources of loss of discipline, culled from my work with traders:
10) Environmental distractions and boredom cause a lack of focus;
9) Fatigue and mental overload create a loss of concentration;
8) Overconfidence follows a string of successes;
7) Unwillingness to accept losses, leading to alterations of trade plans after the trade has gone into the red;
6) Loss of confidence in one's trading plan/strategy because it has not been adequately tested and battle-tested;
5) Personality traits that lead to impulsivity and low frustration tolerance in stressful situations;
4) Situational performance pressures, such as trading slumps and increased personal expenses, that change how traders trade (putting P/L ahead of making good trades);
3) Trading positions that are excessive for the account size, created exaggerated P/L swings and emotional reactions;
2) Not having a clearly defined trading plan/strategy in the first place;
1) Trading a time frame, style, or market that does not match your talents, skills, risk tolerance, and personality.
10) Environmental distractions and boredom cause a lack of focus;
9) Fatigue and mental overload create a loss of concentration;
8) Overconfidence follows a string of successes;
7) Unwillingness to accept losses, leading to alterations of trade plans after the trade has gone into the red;
6) Loss of confidence in one's trading plan/strategy because it has not been adequately tested and battle-tested;
5) Personality traits that lead to impulsivity and low frustration tolerance in stressful situations;
4) Situational performance pressures, such as trading slumps and increased personal expenses, that change how traders trade (putting P/L ahead of making good trades);
3) Trading positions that are excessive for the account size, created exaggerated P/L swings and emotional reactions;
2) Not having a clearly defined trading plan/strategy in the first place;
1) Trading a time frame, style, or market that does not match your talents, skills, risk tolerance, and personality.
Monday, June 26, 2006
Why Your Trading Isn't Working Out
A good physician knows that, before cure comes a diagnosis. You cannot treat a problem before you identify what that problem is.
All too often, traders assume that their performance problems are due to a single cause: trading the wrong chart pattern or indicator, having the wrong mindset, etc. As a result, they seek out one trading guru or coach after another, only to see their P/L head steadily south.
The reality is that there are quite a few reasons why trading might be unprofitable. Figuring out which might apply to you is the first step is getting the right help.
Here's a fourfold scheme that I have found helpful in conceptualizing trading problems:
1) Problems of training and experience - Many traders put their money at risk well before they have developed their own trading styles based on the identification of an objective edge in the marketplace. They are not emotionally prepared to handle risk and reward, and they are not sufficiently steeped in markets to separate randomness from meaningful market patterns. They are like beginning golfers who decide to enter a competitive tournament. Their frustrations are the result of lack of preparation and experience. The answer to these problems is to develop a training program that helps you develop confidence and competence in identifying meaningful market patterns and acting upon those. Online trading rooms, where you can observe experienced traders apply their skills, are helpful for this purpose.
2) Problems of changing markets - When traders have had consistent success, but suddenly lose money with consistency, a reasonable hypothesis is that markets have changed and what once was an edge no longer is profitable. This happened to many momentum traders after the late 1990s bull market, and it also has been the case for many scalpers after volatility came out of the stock indices. Here the challenge is to remake one's trading, either by retaining the core strategy and seeking other markets with opportunity or by finding new strategies for one's market. The answer to these problems is to reduce your trading size and re-enter a learning curve to become acquainted with new markets and methods. Figuring out how you learned the markets initially will help you identify steps you need to take to relearn new patterns.
3) Situational emotional problems - These are emotional stresses that are recent in origin and that interfere with decision making and performance. Some of these stresses might pertain to trading, such as frustration after a slump or loss. Some might stem from one's personal life, as in a relationship breakup or increased financial pressures due to a new home or child. Very often these problems create performance anxieties by putting the making of money ahead of the placing of good trades. The answer to these problems is to seek out short-term counseling to help you gain perspective on the problems and cope with them effectively.
4) Ongoing emotional problems - These are emotional patterns that predate trading and that show up in areas of life apart from trading. They include depression, anxiety, anger, attention deficits, and substance abuse. Such problems skew how people experience themselves and the world and lead to biases in processing information. As a result, it is difficult to trade (and manage risk) with consistency. The answer to these problems is to seek out competent professional help from a licensed psychologist or psychiatrist, including (possibly) counseling and medication assistance.
The important point is that not all trading problems are psychological in nature. Sometimes we need to work on the markets, sometimes we need to work on ourselves, and sometimes we need to do both. But first of all, we need to identify what our problems are. If you seek help for your trading concerns, make sure you do so from an individual who is experienced in both trading and psychology. If people only possess hammers, they'll treat you like a nail. You want mentors who possess multiple tools and who can design the kind of help that will be right for you.
For the trader, as the physician, diagnosing problems is the first step toward cure.
All too often, traders assume that their performance problems are due to a single cause: trading the wrong chart pattern or indicator, having the wrong mindset, etc. As a result, they seek out one trading guru or coach after another, only to see their P/L head steadily south.
The reality is that there are quite a few reasons why trading might be unprofitable. Figuring out which might apply to you is the first step is getting the right help.
Here's a fourfold scheme that I have found helpful in conceptualizing trading problems:
1) Problems of training and experience - Many traders put their money at risk well before they have developed their own trading styles based on the identification of an objective edge in the marketplace. They are not emotionally prepared to handle risk and reward, and they are not sufficiently steeped in markets to separate randomness from meaningful market patterns. They are like beginning golfers who decide to enter a competitive tournament. Their frustrations are the result of lack of preparation and experience. The answer to these problems is to develop a training program that helps you develop confidence and competence in identifying meaningful market patterns and acting upon those. Online trading rooms, where you can observe experienced traders apply their skills, are helpful for this purpose.
2) Problems of changing markets - When traders have had consistent success, but suddenly lose money with consistency, a reasonable hypothesis is that markets have changed and what once was an edge no longer is profitable. This happened to many momentum traders after the late 1990s bull market, and it also has been the case for many scalpers after volatility came out of the stock indices. Here the challenge is to remake one's trading, either by retaining the core strategy and seeking other markets with opportunity or by finding new strategies for one's market. The answer to these problems is to reduce your trading size and re-enter a learning curve to become acquainted with new markets and methods. Figuring out how you learned the markets initially will help you identify steps you need to take to relearn new patterns.
3) Situational emotional problems - These are emotional stresses that are recent in origin and that interfere with decision making and performance. Some of these stresses might pertain to trading, such as frustration after a slump or loss. Some might stem from one's personal life, as in a relationship breakup or increased financial pressures due to a new home or child. Very often these problems create performance anxieties by putting the making of money ahead of the placing of good trades. The answer to these problems is to seek out short-term counseling to help you gain perspective on the problems and cope with them effectively.
4) Ongoing emotional problems - These are emotional patterns that predate trading and that show up in areas of life apart from trading. They include depression, anxiety, anger, attention deficits, and substance abuse. Such problems skew how people experience themselves and the world and lead to biases in processing information. As a result, it is difficult to trade (and manage risk) with consistency. The answer to these problems is to seek out competent professional help from a licensed psychologist or psychiatrist, including (possibly) counseling and medication assistance.
The important point is that not all trading problems are psychological in nature. Sometimes we need to work on the markets, sometimes we need to work on ourselves, and sometimes we need to do both. But first of all, we need to identify what our problems are. If you seek help for your trading concerns, make sure you do so from an individual who is experienced in both trading and psychology. If people only possess hammers, they'll treat you like a nail. You want mentors who possess multiple tools and who can design the kind of help that will be right for you.
For the trader, as the physician, diagnosing problems is the first step toward cure.
Double Inside Days
Thanks to a reader who suggested that I look at the phenomenon that we had as of Friday's close, in which Thursday and Friday's action were inside Wednesday's high and low. This double inside day represents a sizable short-term period of consolidation. Interestingly, the pattern has been bullish since 1990 and more specifically from 2004 to the present, where we see favorable returns five days out.
The important pattern, however, is that the double inside day appears to be bullish during bull markets and bearish during bear markets (as in 2000-2002). When you think about it, this makes some sense. By definition, a market's directional activity does not occur during consolidation periods. It's what happens afterward that sets the trend. A market tells you quite a bit by how it behaves in the face of consolidation. This itself might be a useful market indicator.
The important pattern, however, is that the double inside day appears to be bullish during bull markets and bearish during bear markets (as in 2000-2002). When you think about it, this makes some sense. By definition, a market's directional activity does not occur during consolidation periods. It's what happens afterward that sets the trend. A market tells you quite a bit by how it behaves in the face of consolidation. This itself might be a useful market indicator.
Sunday, June 25, 2006
Why It's Valuable to Track the Market Herd
In my upcoming Trading Markets article, I will be examining the ratio of advancing to declining volume as an indication of herd-like behavior in the market. I do this both in the traditional fashion of cumulating volume in advancing stocks vs. volume in declining stocks and in a new, intraday version that cumulates volume in advancing vs. declining ES time periods. The moral of the story is that it's worth tracking the behavior of the trading herd.
Going back to 2004 (N = 621 trading days), we've had 42 days in the S&P 500 Index that have been up by 1% or more. Overall, the market has been up by an average of .06% the next day (24 up, 18 down), not much of an edge over the average gain of .02% (343 up, 278 down) for the entire sample.
When we divide the strong up days in the S&P in half based on the ratio of advancing stock volume to declining stock volume, however, we see an interesting pattern. When the S&P 500 is up strong and volume is heavily concentrated among advancers (i.e., the herd is buying), the next day in the S&P averages a loss of -.07% (10 up, 11 down). When the S&P 500 is up strong and volume is not heavily concentrated among advancers, the next day in the S&P averages a gain of .19% (14 up, 7 down).
It thus appears that strong market rises are more likely to persist in the near term if they are not accepted by the herd.
How about during market declines?
Since 2004, we've had 47 days in which we've had a decline of 1% or greater. Overall, the next day in the S&P 500 Index has been up by an average of .04% (28 up, 19 down). Again, that's not much of an edge compared to the average gain of .02% (343 up, 278 down) for the entire sample.
Here, too, though we see a pattern. When the S&P is down sharply and volume is concentrated in declining issues (N = 23), the next day averages a loss of -.03% (11 up, 12 down). When the S&P is down sharply and volume is not concentrated in declining issues (N = 24), the next day averages a gain of .11% (17 up, 7 down).
What that means is that sharp declines are more likely to persist the next day if the herd is selling. When the decline is large but selling is not indiscriminate across issues, we're more likely to have a snap back the next day.
Finally, let's look at market days that are relatively flat. Since 2004, we've had 84 days in which the S&P 500 Index has closed within a range of plus or minus .10%. The next day, the S&P has averaged a gain of .02% (44 up, 40 down), no edge over the sample as a whole. When volume was relatively concentrated in advancing stocks, however, the next day in the S&P averaged a loss of -.05% (20 up, 22 down). When volume was relatively concentrated in declining stocks, the next day averaged a gain of .10% (24 up, 18 down).
I've looked at this over multiple time frames and the results are similar. When volume is concentrated at one end of the extreme or the other, it generally has meaningful implications for the market's near-term performance.
Going back to 2004 (N = 621 trading days), we've had 42 days in the S&P 500 Index that have been up by 1% or more. Overall, the market has been up by an average of .06% the next day (24 up, 18 down), not much of an edge over the average gain of .02% (343 up, 278 down) for the entire sample.
When we divide the strong up days in the S&P in half based on the ratio of advancing stock volume to declining stock volume, however, we see an interesting pattern. When the S&P 500 is up strong and volume is heavily concentrated among advancers (i.e., the herd is buying), the next day in the S&P averages a loss of -.07% (10 up, 11 down). When the S&P 500 is up strong and volume is not heavily concentrated among advancers, the next day in the S&P averages a gain of .19% (14 up, 7 down).
It thus appears that strong market rises are more likely to persist in the near term if they are not accepted by the herd.
How about during market declines?
Since 2004, we've had 47 days in which we've had a decline of 1% or greater. Overall, the next day in the S&P 500 Index has been up by an average of .04% (28 up, 19 down). Again, that's not much of an edge compared to the average gain of .02% (343 up, 278 down) for the entire sample.
Here, too, though we see a pattern. When the S&P is down sharply and volume is concentrated in declining issues (N = 23), the next day averages a loss of -.03% (11 up, 12 down). When the S&P is down sharply and volume is not concentrated in declining issues (N = 24), the next day averages a gain of .11% (17 up, 7 down).
What that means is that sharp declines are more likely to persist the next day if the herd is selling. When the decline is large but selling is not indiscriminate across issues, we're more likely to have a snap back the next day.
Finally, let's look at market days that are relatively flat. Since 2004, we've had 84 days in which the S&P 500 Index has closed within a range of plus or minus .10%. The next day, the S&P has averaged a gain of .02% (44 up, 40 down), no edge over the sample as a whole. When volume was relatively concentrated in advancing stocks, however, the next day in the S&P averaged a loss of -.05% (20 up, 22 down). When volume was relatively concentrated in declining stocks, the next day averaged a gain of .10% (24 up, 18 down).
I've looked at this over multiple time frames and the results are similar. When volume is concentrated at one end of the extreme or the other, it generally has meaningful implications for the market's near-term performance.
Saturday, June 24, 2006
How to Kill a Trending Market
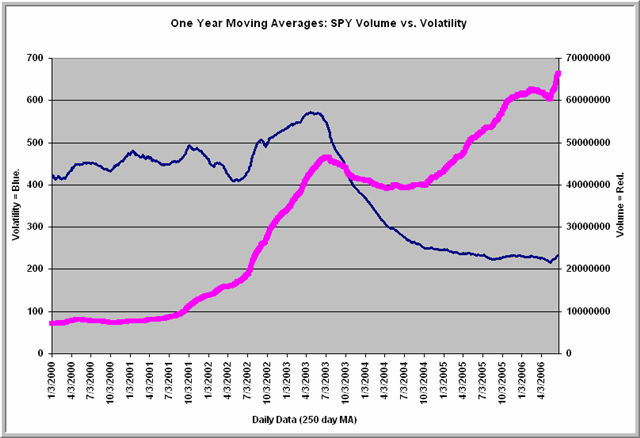
One of the best ways of killing a trending market is to develop a tradable index for it. And if you really want to drive a stake in its heart, you develop multiple tradable indices.
Why?
The indices provide arbitrage opportunities, which mean that an increasing proportion of volume is devoted to keeping stocks in line with the index, index 1 in line with index 2, etc.
That's how you get the chart above, which tracks average volume and volatility in SPY from 2000 to the present. Note that volume in SPY has steadily risen to all time highs. Volatility, however, has steadily decreased from 2003 to the present, the recent uptick notwithstanding.
With the recent hyperexpansion of ETFs, this has important implications. Increased liquidity over time will bring a range of markets to the average stock trader that, to this point, have not been available. With that volume, however, may come trading patterns that make the market harder to trade with traditional momentum/trend tools.
In a recent study, I showed how the propensity to trend has been coming out of the S&P market on a long-term basis. If I'm right, this might be the future for those stock sectors and markets that attract significant attention from index players. Automated index arbitrage brings significant volume to markets, but it is not necessarily the volume that contributes to directional market trade.
Friday, June 23, 2006
Trending Behavior and Short-Term Stock Index Performance
I'm in the process of studying short-term market trending and its impact on prices in the near term. My Power Measure, charted each day on the Trading Psychology Weblog, is a metric that captures the propensity of any market to behave in a trending way. It is scaled in such as way as to vary between +100 (perfect upside trending) and -100 (perfect downside trending), with zero representing the complete absence of trending.
Readings of +90 or greater, interestingly, are associated with stronger prices in the near term. Since March of this year (N = 1894 15-minute periods), we've had 98 occasions in which the Power Measure has exceeded +90. The market (SPY) six hours later has averaged a gain of .10% (57 up, 41 down). When the Power Measure has been positive (greater than +20) but less than +90, the next six hours in SPY have averaged a loss of -.12% (291 up, 385 down).
What this suggests is that vigorous bull trends tend to continue in the near term, but moderately positive ones are subject to reversal.
What I'm also seeing is a relationship between intraday volume and trendiness. When the trend is very strong and positive (greater than +90), but volume is relatively light (N = 49), the next six hours in SPY average a solid gain of .17%. When trendiness is strong to the upside and volume is relatively high (N = 50), the next six hours in SPY only averages a gain of .02%.
Similarly, when trendiness is strong and negative (less than -90), but volume is relatively light (N = 59), the next six hours in SPY average a gain of .06%. When trendiness is strong to the downside and volume is relatively heavy (N = 58), the next six hours in SPY average a loss of -.11%. High volume during a strong bullish trend appears to lead to short-term underperformance; high volume during a strong bearish trend appears to lead to further short-term bearish performance.
These are very preliminary findings, with much more study to come. The goal is to see when trends tend to continue and when they tend to reverse.
Readings of +90 or greater, interestingly, are associated with stronger prices in the near term. Since March of this year (N = 1894 15-minute periods), we've had 98 occasions in which the Power Measure has exceeded +90. The market (SPY) six hours later has averaged a gain of .10% (57 up, 41 down). When the Power Measure has been positive (greater than +20) but less than +90, the next six hours in SPY have averaged a loss of -.12% (291 up, 385 down).
What this suggests is that vigorous bull trends tend to continue in the near term, but moderately positive ones are subject to reversal.
What I'm also seeing is a relationship between intraday volume and trendiness. When the trend is very strong and positive (greater than +90), but volume is relatively light (N = 49), the next six hours in SPY average a solid gain of .17%. When trendiness is strong to the upside and volume is relatively high (N = 50), the next six hours in SPY only averages a gain of .02%.
Similarly, when trendiness is strong and negative (less than -90), but volume is relatively light (N = 59), the next six hours in SPY average a gain of .06%. When trendiness is strong to the downside and volume is relatively heavy (N = 58), the next six hours in SPY average a loss of -.11%. High volume during a strong bullish trend appears to lead to short-term underperformance; high volume during a strong bearish trend appears to lead to further short-term bearish performance.
These are very preliminary findings, with much more study to come. The goal is to see when trends tend to continue and when they tend to reverse.
Thursday, June 22, 2006
Opportunity During the Day Trading Session
In the last post, we saw that the strategy of closing positions out at the end of the day takes traders out of the most bullish portion of market action.
But how much price action can be expected during the day session, from open to close? Since March, 2003 (N = 834 trading days), we had 477 days in SPY--almost 60%--in which the market closed within a .50% band around its open. Only 135 day sessions (a little over 15%) saw a gain of over 1% from open to close or a loss of greater than 1%. Surprisingly, about 40% of all day sessions closed within a band of .30% around the open.
The average high-low range since March, 2003 has been 1.07%--and yet only a little more than 15% of all days closed with a day session price change of more than 1%. What that tells us is how few of those days were directional, trend days. While the average trading day may give us approximately 1% of range, the average open-to-close change is far smaller than that. Indeed, about 40% of the time, the day's price change has been less than four points in either direction.
But how much price action can be expected during the day session, from open to close? Since March, 2003 (N = 834 trading days), we had 477 days in SPY--almost 60%--in which the market closed within a .50% band around its open. Only 135 day sessions (a little over 15%) saw a gain of over 1% from open to close or a loss of greater than 1%. Surprisingly, about 40% of all day sessions closed within a band of .30% around the open.
The average high-low range since March, 2003 has been 1.07%--and yet only a little more than 15% of all days closed with a day session price change of more than 1%. What that tells us is how few of those days were directional, trend days. While the average trading day may give us approximately 1% of range, the average open-to-close change is far smaller than that. Indeed, about 40% of the time, the day's price change has been less than four points in either direction.
Wednesday, June 21, 2006
Playing It Safe is the Riskiest Strategy
In my post on "what you know can hurt you", I made the point that markets reward the assumption of risk, not the pursuit of the familiar.
Here's another case in point.
Since January, 1997, we've gained 50+ points in SPY, or the equivalent of over 500 S&P points.
So you'd think it was a reasonably good market for daytraders over that time.
Wrong.
Daytraders like to close positions out by the end of the day to avoid overnight risk. But markets don't reward the avoidance of risk.
From the close to the next day's open, from January, 1997 to the present (N = 2402 trading days), SPY gained a total of over 139 points. During that same period, from the day's open to the day's close (the daytrading market), SPY *lost* a total of 88 points.
So, in other words, daytraders who bought the open and sold the close every day during a period of rising market prices lost about 880 S&P points.
But maybe you're thinking this underperformance was just a function of the 2000-2003 bear market.
From 2003 to the present (the most recent bull market), SPY from the close to the next day's open gained a total of almost 36 points. And the daytrading market (open to close)? During the entire recent bull market SPY gained a total of four points. In 2006 thus far, SPY has gained about 6.6 points from the close to the next day's open. During the daytrading market, we've lost about 6.1 points.
It's awfully hard to find *any* recent time period in which the "safe" strategy of closing positions at the end of the day provided traders with opportunity.
Markets are a lot like relationships: Playing it really safe is often the riskiest strategy.
Here's another case in point.
Since January, 1997, we've gained 50+ points in SPY, or the equivalent of over 500 S&P points.
So you'd think it was a reasonably good market for daytraders over that time.
Wrong.
Daytraders like to close positions out by the end of the day to avoid overnight risk. But markets don't reward the avoidance of risk.
From the close to the next day's open, from January, 1997 to the present (N = 2402 trading days), SPY gained a total of over 139 points. During that same period, from the day's open to the day's close (the daytrading market), SPY *lost* a total of 88 points.
So, in other words, daytraders who bought the open and sold the close every day during a period of rising market prices lost about 880 S&P points.
But maybe you're thinking this underperformance was just a function of the 2000-2003 bear market.
From 2003 to the present (the most recent bull market), SPY from the close to the next day's open gained a total of almost 36 points. And the daytrading market (open to close)? During the entire recent bull market SPY gained a total of four points. In 2006 thus far, SPY has gained about 6.6 points from the close to the next day's open. During the daytrading market, we've lost about 6.1 points.
It's awfully hard to find *any* recent time period in which the "safe" strategy of closing positions at the end of the day provided traders with opportunity.
Markets are a lot like relationships: Playing it really safe is often the riskiest strategy.
Inside Day With Less Fear: What It Means
On Tuesday we saw yet another inside day, with a sizable reduction in the closing VIX. Overall, the short-term outlook following inside days is not bullish. Since March, 2003 (N = 830 trading days), we've had 112 inside days in the S&P 500 (SPY). Two days later, the market averaged a flat performance (52 up, 60 down), considerably worse than the average two-day gain of .12% (394 up, 324 down) for the remainder of the sample.
When the inside day has been accompanied by a large drop in the VIX (N = 56), the next two days in SPY have averaged a loss of -.03% (22 up, 34 down). Relative strength in the VIX (N = 56) during an inside day has been associated with an average two-day gain of .03% (30 up, 26 down).
In short, inside days seem to provide little edge for the bulls, especially when they are accompanied by a reduction in fear among options participants.
When the inside day has been accompanied by a large drop in the VIX (N = 56), the next two days in SPY have averaged a loss of -.03% (22 up, 34 down). Relative strength in the VIX (N = 56) during an inside day has been associated with an average two-day gain of .03% (30 up, 26 down).
In short, inside days seem to provide little edge for the bulls, especially when they are accompanied by a reduction in fear among options participants.
Tuesday, June 20, 2006
Intraday Volatility: What We Can Learn From Volume Patterns
We are seeing enhanced volatility at every time frame during this recent market decline. In today's entry for the Trading Psychology Weblog, I posted a chart that showed how dramatically the VIX itself has become more volatile on a day-to-day basis.
Intraday, from March through the end of April, the average 15-minute range in the ES futures was 2.2 points. From May through June 15th, the average 15-minute range was 2.9 points. The average three-hour range from March through April was .59%. Since May, it has been .81%.
Why is volatility greater? Perhaps it is a function of *who* is in the marketplace. From March through April, the average 15-minute ES volume was 30,330. Since May, it has been 40,911. We've been hearing how "fast money" hedge funds and other money managers have been liquidating volatile positions during this time. Maybe, just maybe, we're seeing 33% more volume and similar higher volatility because of *their* enhanced participation.
I look at it this way. The locals participate every day in the market. The average daily volume probably represents their normal participation in the marketplace. When volume--and hence volatility--spike above normal, that's probably because other time-frame participants have come to the market: mutual funds, hedge funds, investment banks, etc. They only come to market when they perceive relative value or overvalue in an asset class.
By looking at volume that way, you can figure out the price points at which these savvy players discern value--and overvalue. You can also figure out where those value points are shifting and where they remain in force as mean values for eventual reversion. Remember: locals provide liquidity and govern the next few ticks; institutions provide market direction over the next few days. How many traders get stopped out of good positions because they lose a few ticks to the locals and lose sight of the market's bigger picture determined by other-timeframe participants?
Intraday, from March through the end of April, the average 15-minute range in the ES futures was 2.2 points. From May through June 15th, the average 15-minute range was 2.9 points. The average three-hour range from March through April was .59%. Since May, it has been .81%.
Why is volatility greater? Perhaps it is a function of *who* is in the marketplace. From March through April, the average 15-minute ES volume was 30,330. Since May, it has been 40,911. We've been hearing how "fast money" hedge funds and other money managers have been liquidating volatile positions during this time. Maybe, just maybe, we're seeing 33% more volume and similar higher volatility because of *their* enhanced participation.
I look at it this way. The locals participate every day in the market. The average daily volume probably represents their normal participation in the marketplace. When volume--and hence volatility--spike above normal, that's probably because other time-frame participants have come to the market: mutual funds, hedge funds, investment banks, etc. They only come to market when they perceive relative value or overvalue in an asset class.
By looking at volume that way, you can figure out the price points at which these savvy players discern value--and overvalue. You can also figure out where those value points are shifting and where they remain in force as mean values for eventual reversion. Remember: locals provide liquidity and govern the next few ticks; institutions provide market direction over the next few days. How many traders get stopped out of good positions because they lose a few ticks to the locals and lose sight of the market's bigger picture determined by other-timeframe participants?
Monday, June 19, 2006
Inside Day After a Big Rise: What Happens Next
Thursday was a strong day in the stock indices, and Friday retraced some of those gains as an inside day.
I went back to December, 1996 (N = 2395 trading days) and found 18 occurrences of down inside days following strong gains of 1.5% or more in SPY. Interestingly, expectations were not favorable over the next two days. SPY averaged a loss of -.24% (8 up, 10 down) two days after the inside day--much weaker than the average two-day gain of .06% for the entire sample.
The same pattern held true for inside days following gains of 1% or more (N = 39).
Perhaps the most interesting finding is that we haven't seen such a pattern (up more than 1.5% followed by a down, inside day) since December, 2002. We've seen four rises of 1% or more followed by down, inside days since the recent bull market began in 2003; three of those four occasions were down one day later.
We're up nicely prior to the open as I'm writing this thanks to overseas strength. We'll see if this proves an exception to the pattern.
I went back to December, 1996 (N = 2395 trading days) and found 18 occurrences of down inside days following strong gains of 1.5% or more in SPY. Interestingly, expectations were not favorable over the next two days. SPY averaged a loss of -.24% (8 up, 10 down) two days after the inside day--much weaker than the average two-day gain of .06% for the entire sample.
The same pattern held true for inside days following gains of 1% or more (N = 39).
Perhaps the most interesting finding is that we haven't seen such a pattern (up more than 1.5% followed by a down, inside day) since December, 2002. We've seen four rises of 1% or more followed by down, inside days since the recent bull market began in 2003; three of those four occasions were down one day later.
We're up nicely prior to the open as I'm writing this thanks to overseas strength. We'll see if this proves an exception to the pattern.
Sunday, June 18, 2006
What You Know Can Hurt You
What you trade is every bit as important as how you trade. In spite of this, we see from volume figures that the majority of traders stick with the tried and true familiar stock indices. While these provide liquidity, do they provide performance?
In fact not. The more familiar the stocks, the worse their performance during the recent bull market.
For example: Since May, 2003, here have been the returns from various indices:
S&P growth stocks (IVW): 22%
S&P value stocks (IVE): 53%
S&P 500 Equal-Weight Index (RSP): 65%
Russell 2000 Index (IWM): 74%
German Index (EWG): 99%
Japan Index (EWJ): 101%
Emerging Markets Index (EEM): 153%
Chances are good, if it was a stock or market familiar to you, it has underperformed. Large cap growth has underperformed. The U.S. has underperformed.
Ask yourself where hedge funds have put their money to work; then ask yourself where Joe Investor has parked his mutual fund money.
Markets reward the assumption of risk, not the pursuit of the familiar.
In fact not. The more familiar the stocks, the worse their performance during the recent bull market.
For example: Since May, 2003, here have been the returns from various indices:
S&P growth stocks (IVW): 22%
S&P value stocks (IVE): 53%
S&P 500 Equal-Weight Index (RSP): 65%
Russell 2000 Index (IWM): 74%
German Index (EWG): 99%
Japan Index (EWJ): 101%
Emerging Markets Index (EEM): 153%
Chances are good, if it was a stock or market familiar to you, it has underperformed. Large cap growth has underperformed. The U.S. has underperformed.
Ask yourself where hedge funds have put their money to work; then ask yourself where Joe Investor has parked his mutual fund money.
Markets reward the assumption of risk, not the pursuit of the familiar.
Friday, June 16, 2006
Why This is Not *the* Bottom
Has the bear bottomed? That was the question I heard with surprising frequency after Thursday's rally. My answer has been, "No. It takes a lot more weakness to make for a cyclical bear market bottom."
Let's look at the historical record:
1966 cyclical bottom: 56% of all stocks make 52-week lows on August 29th.
1970 cyclical bottom: 58% of all stocks make 52-week lows on May 26th.
1974 cyclical bottom: 37% of all stocks make 52-week lows on September 13th.
1978 cyclical bottom: 30% of all stocks make 52-week lows on October 30th.
1980 cyclical bottom: 38% of all stocks make 52-week lows on March 27th.
1981 cyclical bottom: 31% of all stocks make 52-week lows on September 28th.
1987 cyclical bottom: 57% of all stocks make 52-week lows on October 20th.
1990 cyclical bottom: 35% of all stocks make 52-week lows on August 23rd.
1994 cyclical bottom: 23% of all stocks make 52-week lows on April 4th.
1998 cyclical bottom: 33% of all stocks make 52-week lows on August 31st.
2002 cyclical bottom: 27% of all stocks make 52-week lows on July 24th.
2006 cyclical bottom??: 8% of all stocks make 52-week lows on June 13th.
I don't think so.
Notice the average spacing of the cyclical bottoms. Those bottoms don't occur until bearishness is rampant, and that typically takes a large proportion of issues making fresh lows.
Notice something else very important: The point at which we hit maximum new lows is rarely the eventual price low for the cyclical decline. For instance, we had 27% of stocks making new lows in July, 2002, but we saw further price lows in October of that year and March of 2003. Similarly, we saw 31% of stocks making new lows in September, 1981, but didn't see actual price lows until August of 1982.
So what we're seeing in the current market is either a normal correction in a bull market (like we had in October, 2005 and May, 2004), or it is just the *start* of a full-fledged cyclical bear market that has much further to go. The quality of the next intermediate-term rally should go a long way toward identifying which scenario we're in.
Let's look at the historical record:
1966 cyclical bottom: 56% of all stocks make 52-week lows on August 29th.
1970 cyclical bottom: 58% of all stocks make 52-week lows on May 26th.
1974 cyclical bottom: 37% of all stocks make 52-week lows on September 13th.
1978 cyclical bottom: 30% of all stocks make 52-week lows on October 30th.
1980 cyclical bottom: 38% of all stocks make 52-week lows on March 27th.
1981 cyclical bottom: 31% of all stocks make 52-week lows on September 28th.
1987 cyclical bottom: 57% of all stocks make 52-week lows on October 20th.
1990 cyclical bottom: 35% of all stocks make 52-week lows on August 23rd.
1994 cyclical bottom: 23% of all stocks make 52-week lows on April 4th.
1998 cyclical bottom: 33% of all stocks make 52-week lows on August 31st.
2002 cyclical bottom: 27% of all stocks make 52-week lows on July 24th.
2006 cyclical bottom??: 8% of all stocks make 52-week lows on June 13th.
I don't think so.
Notice the average spacing of the cyclical bottoms. Those bottoms don't occur until bearishness is rampant, and that typically takes a large proportion of issues making fresh lows.
Notice something else very important: The point at which we hit maximum new lows is rarely the eventual price low for the cyclical decline. For instance, we had 27% of stocks making new lows in July, 2002, but we saw further price lows in October of that year and March of 2003. Similarly, we saw 31% of stocks making new lows in September, 1981, but didn't see actual price lows until August of 1982.
So what we're seeing in the current market is either a normal correction in a bull market (like we had in October, 2005 and May, 2004), or it is just the *start* of a full-fledged cyclical bear market that has much further to go. The quality of the next intermediate-term rally should go a long way toward identifying which scenario we're in.
Big Up Day In Oversold Market: What Next?
NOTE: There will be an update of the Trading Psychology Weblog tonight.
Thursday was a very broad rally in a market that had been sharply lower for the month. Specifically, the S&P 500 Index gained over 2% on the day after having been down about 4.8% during the previous 20 sessions.
I went back to 1996 (N = 2629 trading days) to see what happens after we get a 2%+ rally after a 20-day period in which the market has been down over 4%. This occurred 40 times. Five days later, the S&P 500 Index was up by an average of .55% (24 up, 16 down), stronger than the average five-day gain of .16% (1434 up, 1195 down) for the entire sample. Twenty-three of the occasions took place during the 2000-2002 bear market, and, overall, the strong up days after 20 days of weakness tended to be followed by considerable volatility.
The ratio of up volume to down volume on Thursday was huge: over 22:1. That is the strongest concentration of volume we've seen since 1996. Interestingly, when the market rallied strongly after 20 days of weakness *and* volume was highly concentrated in the advancing stocks (N = 14), the next day in the S&P averaged a loss of -.41% (6 up, 8 down), considerably weaker than normal. Similarly, when we've had a strong rally in a down market and the day's Arms Index (TRIN) has been less than .40 (N = 16), the next two days in the S&P have averaged a loss of -.32% (6 up, 10 down).
In summary, strong up days in a down market, in which volume is highly concentrated in the advancing issues, actually yield subnormal returns in the short run. Moreover, many of these big up days during falling markets occurred during bear markets and did not signal an end to the bear. While strong up days *in general* tend to produce favorable near-term results, panic buying/short-covering after a period of bearishness has not produced favorable returns over the next couple of days.
Thursday was a very broad rally in a market that had been sharply lower for the month. Specifically, the S&P 500 Index gained over 2% on the day after having been down about 4.8% during the previous 20 sessions.
I went back to 1996 (N = 2629 trading days) to see what happens after we get a 2%+ rally after a 20-day period in which the market has been down over 4%. This occurred 40 times. Five days later, the S&P 500 Index was up by an average of .55% (24 up, 16 down), stronger than the average five-day gain of .16% (1434 up, 1195 down) for the entire sample. Twenty-three of the occasions took place during the 2000-2002 bear market, and, overall, the strong up days after 20 days of weakness tended to be followed by considerable volatility.
The ratio of up volume to down volume on Thursday was huge: over 22:1. That is the strongest concentration of volume we've seen since 1996. Interestingly, when the market rallied strongly after 20 days of weakness *and* volume was highly concentrated in the advancing stocks (N = 14), the next day in the S&P averaged a loss of -.41% (6 up, 8 down), considerably weaker than normal. Similarly, when we've had a strong rally in a down market and the day's Arms Index (TRIN) has been less than .40 (N = 16), the next two days in the S&P have averaged a loss of -.32% (6 up, 10 down).
In summary, strong up days in a down market, in which volume is highly concentrated in the advancing issues, actually yield subnormal returns in the short run. Moreover, many of these big up days during falling markets occurred during bear markets and did not signal an end to the bear. While strong up days *in general* tend to produce favorable near-term results, panic buying/short-covering after a period of bearishness has not produced favorable returns over the next couple of days.
Thursday, June 15, 2006
Blueprint for an Uncompromised Life - Part Five: Multiplier Effects
Note: This is the final installment in the five-part series that examines the factors that contribute to extraordinary creative achievement. My regular postings to TraderFeed and the Trading Psychology Weblog will commence on Friday.
We have seen that expert performers in their fields undergo a very specific developmental process, beginning with crystallizing experiences, mentorship, and the achievement of competence through structured practice. Equally important, expert performers follow a different developmental trajectory from their less accomplished peers.
This developmental trajectory takes advantage of what researchers call multiplier effects. A simple example from Sandra Scarr's research on intellectual development will illustrate the power of these effects. Young children with high and low IQs follow very different life paths on average, though they start from similar upbringings. This is because the high IQ children tend to seek out higher IQ peers and thus receive more intellectual stimulation from their environment. They also are more likely to be targeted for enriched academic experiences. Over time, these differences compound, creating multiplier effects and widely diverging developmental paths.
Consider two intern traders at a trading firm: one shows initial talent for reading short-term market patterns, the other picks up the patterns more slowly. Initially, their P/L differs only modestly. The quicker student, however, is selected by the firm's top trader as a member of that trading team and is given extensive mentoring. The slower student is not provided this enriched experience. As a result, by the end of the year, the two students are following very different career paths, with a wide performance gap.
We see a similar phenomenon when children born earlier in the year have physically matured to a greater degree than children born later in the year and hence tend to be selected for enriched Little League and other athletic experiences. The initial gap in performance widens as the mature children are provided superior experiences relative to their peers.
Multiplier effects mean that what is inborn to the individual--talents--help to shape environmental experiences that in turn maximize these talents. Highly successful individuals place themselves in environments that take maximum advantage of their interests, talents, and skills.
Nothing is more important for traders--and people in general--than to find their niches: those settings that will help them make the most of who they are. Many traders think they are not reaching their potential because of emotional blocks. Often, however, their performance blocks are of a very different nature: they are not trading the markets or styles that capitalize on their talents and supercharge their learning and P/L through multiplier effects.
We have seen that expert performers in their fields undergo a very specific developmental process, beginning with crystallizing experiences, mentorship, and the achievement of competence through structured practice. Equally important, expert performers follow a different developmental trajectory from their less accomplished peers.
This developmental trajectory takes advantage of what researchers call multiplier effects. A simple example from Sandra Scarr's research on intellectual development will illustrate the power of these effects. Young children with high and low IQs follow very different life paths on average, though they start from similar upbringings. This is because the high IQ children tend to seek out higher IQ peers and thus receive more intellectual stimulation from their environment. They also are more likely to be targeted for enriched academic experiences. Over time, these differences compound, creating multiplier effects and widely diverging developmental paths.
Consider two intern traders at a trading firm: one shows initial talent for reading short-term market patterns, the other picks up the patterns more slowly. Initially, their P/L differs only modestly. The quicker student, however, is selected by the firm's top trader as a member of that trading team and is given extensive mentoring. The slower student is not provided this enriched experience. As a result, by the end of the year, the two students are following very different career paths, with a wide performance gap.
We see a similar phenomenon when children born earlier in the year have physically matured to a greater degree than children born later in the year and hence tend to be selected for enriched Little League and other athletic experiences. The initial gap in performance widens as the mature children are provided superior experiences relative to their peers.
Multiplier effects mean that what is inborn to the individual--talents--help to shape environmental experiences that in turn maximize these talents. Highly successful individuals place themselves in environments that take maximum advantage of their interests, talents, and skills.
Nothing is more important for traders--and people in general--than to find their niches: those settings that will help them make the most of who they are. Many traders think they are not reaching their potential because of emotional blocks. Often, however, their performance blocks are of a very different nature: they are not trading the markets or styles that capitalize on their talents and supercharge their learning and P/L through multiplier effects.
Market Update
A late bounce pushed the major averages higher, but we continue to see broad weakness. For example, across the entire market of operating company stocks, we see 150 stocks making fresh 20-day highs and 2301 making new lows.
It is instructive to see which sectors have been strongest and weakest this past month. The weakest sectors have included gold stocks, mining issues, industrial equipment, farm machinery, basic materials, cement, and oil/gas drilling and services. Those include prior bull market leaders.
Interestingly, the strongest sectors over the past month have included banks, REITS, and utilities. Not exactly the sectors you'd expect to be strong if the market thought interest rates would continue to rise.
It is instructive to see which sectors have been strongest and weakest this past month. The weakest sectors have included gold stocks, mining issues, industrial equipment, farm machinery, basic materials, cement, and oil/gas drilling and services. Those include prior bull market leaders.
Interestingly, the strongest sectors over the past month have included banks, REITS, and utilities. Not exactly the sectors you'd expect to be strong if the market thought interest rates would continue to rise.
Wednesday, June 14, 2006
Blueprint for an Uncompromised Life - Part Four: Enhancement of Perception
NOTE: I will return from vacation on Friday and will begin regular posts here and to the Trading Psychology Weblog that same day.
As I researched a variety of fields for my new book and examined the ingredients of expert performance, one set of findings jumped out at me. Because highly accomplished performers undergo a lengthy training (formal or informal) through their immersive developmental process, they acquire unique perceptual skills. Years of painting, experimenting with different materials, and closely observing their subject matter enables artists to *see* the world in fresh ways. Similarly, the iterative trial and error process of experimentation allows scientists to perceive unique relationships in nature. Much of this enhancement of perception is a function of cognitive organization: expert performers learn to identify meaningful relationships and use these to organize and interpret what they see. This is how an expert physician, for example, can rapidly diagnose and triage patients in a busy emergency room. It is also how a hockey player learns to skate where the puck will be, not just where it currently is.
It is difficult to appreciate that expert performers do not see the world as do others. Chess grandmasters see a different chessboard than novices; a baseball hitter sees the release of a 95 mph fastball differently than a fan. Experts see the world in terms of meaningful relationships--and because they have acquired a huge library of such relationships after years of observation and practice--they develop elaborate mental maps for guiding their actions.
This has immense relevance for trading, where expert traders see markets differently from beginners. An expert trader might look at a depth of market (DOM) display and notice that, at a prior support level, large traders are pulling bids when they're being hit, but that they are not doing the same with their offers. That allows the expert to sell the market while the rookie is staring at a chart, counting on support.
Similarly, an expert trader observes what is happening in gold, other metals, emerging equity markets, currencies, and interest rates and sees a transition from an expansionary, inflationary market to one that is counting on contraction and a tightening of monetary conditions. The rookie simply sees falling markets and oversold levels on a short-term oscillator.
The expert, in general, develops a richer, more complex, more meaning-laden map of the world than the novice.
Because of that, the expert also lives in a subjective world that is more filled with meaning. A gourmet meal means much more to a connoisseur than to the average person; an accomplished artist sees more in a sunset than the average Joe.
In enhancing ourselves, we enhance our enjoyment of life and make the most of our experience while we're here. The development of expertise is not simply about becoming a great trader, athlete, leader, or artist. It is about cultivating the richest experience of life possible to each of us.
As I researched a variety of fields for my new book and examined the ingredients of expert performance, one set of findings jumped out at me. Because highly accomplished performers undergo a lengthy training (formal or informal) through their immersive developmental process, they acquire unique perceptual skills. Years of painting, experimenting with different materials, and closely observing their subject matter enables artists to *see* the world in fresh ways. Similarly, the iterative trial and error process of experimentation allows scientists to perceive unique relationships in nature. Much of this enhancement of perception is a function of cognitive organization: expert performers learn to identify meaningful relationships and use these to organize and interpret what they see. This is how an expert physician, for example, can rapidly diagnose and triage patients in a busy emergency room. It is also how a hockey player learns to skate where the puck will be, not just where it currently is.
It is difficult to appreciate that expert performers do not see the world as do others. Chess grandmasters see a different chessboard than novices; a baseball hitter sees the release of a 95 mph fastball differently than a fan. Experts see the world in terms of meaningful relationships--and because they have acquired a huge library of such relationships after years of observation and practice--they develop elaborate mental maps for guiding their actions.
This has immense relevance for trading, where expert traders see markets differently from beginners. An expert trader might look at a depth of market (DOM) display and notice that, at a prior support level, large traders are pulling bids when they're being hit, but that they are not doing the same with their offers. That allows the expert to sell the market while the rookie is staring at a chart, counting on support.
Similarly, an expert trader observes what is happening in gold, other metals, emerging equity markets, currencies, and interest rates and sees a transition from an expansionary, inflationary market to one that is counting on contraction and a tightening of monetary conditions. The rookie simply sees falling markets and oversold levels on a short-term oscillator.
The expert, in general, develops a richer, more complex, more meaning-laden map of the world than the novice.
Because of that, the expert also lives in a subjective world that is more filled with meaning. A gourmet meal means much more to a connoisseur than to the average person; an accomplished artist sees more in a sunset than the average Joe.
In enhancing ourselves, we enhance our enjoyment of life and make the most of our experience while we're here. The development of expertise is not simply about becoming a great trader, athlete, leader, or artist. It is about cultivating the richest experience of life possible to each of us.
Market Update
Per the previous update, it's clear why it's important to monitor the strength/weakness of the market during declines such as the one we've been having. If you research price declines alone, you'll come to the conclusion that the market's outlook is bullish following a sharp decline. If, however, you examine the momentum of the decline and the degree to which the broad list of stocks is participating in the decline, another set of conclusions comes to the fore. Short-term market outcomes are not bullish during declines in which an expanding proportion of stocks participates to the downside.
And that is what we've been seeing. On Tuesday, we saw an expanding number of stocks making fresh lows: 222 new 20-day highs against 3146 new lows. Although we did not see an expanding set of new 52-week lows in the SPX stocks, such an expansion was clear in the broad market--and especially among small caps.
We *are* nearing a juncture from which rallies have tended to occur. After Tuesday, only about 18% of SPX stocks are trading above their 52-week moving averages.
Still, this market is all about unwinding the speculative trade that came from easy money. As long as we see the weakness in gold and in emerging markets, this theme holds sway and will influence the broad list of stocks. In spite of violent short-covering rallies, it will take price declines with *fewer* stocks participating to the downside to get me to entertain the bullish side.
And that is what we've been seeing. On Tuesday, we saw an expanding number of stocks making fresh lows: 222 new 20-day highs against 3146 new lows. Although we did not see an expanding set of new 52-week lows in the SPX stocks, such an expansion was clear in the broad market--and especially among small caps.
We *are* nearing a juncture from which rallies have tended to occur. After Tuesday, only about 18% of SPX stocks are trading above their 52-week moving averages.
Still, this market is all about unwinding the speculative trade that came from easy money. As long as we see the weakness in gold and in emerging markets, this theme holds sway and will influence the broad list of stocks. In spite of violent short-covering rallies, it will take price declines with *fewer* stocks participating to the downside to get me to entertain the bullish side.
Tuesday, June 13, 2006
Blueprint for an Uncompromised Life - Part Three: Resilience
One of the most notable findings in the research on extraordinary creative achievement is that even the greatest performers in their fields produce the same ratio of undistinguished works to notable ones through their careers. Great scientists conduct many unsuccessful experiments; outstanding artists produce many paintings and works of music that never win recognition. Many of the greatest home run hitters have are also leaders in strike outs; the most successful companies, like the best actors and directors, also produce many flops in the marketplace.
What makes the expert performer distinctive, researcher Dean Keith Simonton has found, is that he or she is so productive that it becomes more likely that enough successful experiences will accumulate to leave behind a legacy of achievement. We can think of this in evolutionary terms: the great individual produces many more mutations than the average person. Most of these mutations die off, but those who have produced the most variations will, in the end, have the best chance of being represented among the survivors.
This has huge relevance to trading, as it is not necessarily the case that the most successful traders are the ones with the highest ratio of wins to losses. Very successful traders have typically undergone very significant losses. Because, however, they stay in the game longer--through sufficient capital and superior risk management--they are more likely to eventually enjoy and compound the large winning trades than the average trader.
What this means is that a prerequisite of a high level of success is a high level of resilience with respect to loss and defeat. If the greatest individuals are the ones who are most productive, they will also be the ones with the most failed efforts. Research on psychological resilience suggests that people can survive and even thrive in conditions that others find traumatic. Their coping methods enable them to find meaning and purpose even in the greatest adversity, and they are most likely to maintain social and emotional ties during the hardest times.
In my own studies of traders, I have found a correlation between the success of the trader and the degree to which the trader utilizes problem-focused coping and a coping mechanism called "positive reappraisal". The successful individuals deal with problems as they occur, rather than become wrapped up in blaming of self or others. After they have dealt with the problems, they look back on their experience and try to take away something positive from the experience. For them, adversity becomes a tool of learning--not a defeat.
There are traders who are defeated by losses and there are traders who cope with losses. The highly successful individual, however, is the one who turns losses into gains by generating learning experiences and continuous self-improvement.
What makes the expert performer distinctive, researcher Dean Keith Simonton has found, is that he or she is so productive that it becomes more likely that enough successful experiences will accumulate to leave behind a legacy of achievement. We can think of this in evolutionary terms: the great individual produces many more mutations than the average person. Most of these mutations die off, but those who have produced the most variations will, in the end, have the best chance of being represented among the survivors.
This has huge relevance to trading, as it is not necessarily the case that the most successful traders are the ones with the highest ratio of wins to losses. Very successful traders have typically undergone very significant losses. Because, however, they stay in the game longer--through sufficient capital and superior risk management--they are more likely to eventually enjoy and compound the large winning trades than the average trader.
What this means is that a prerequisite of a high level of success is a high level of resilience with respect to loss and defeat. If the greatest individuals are the ones who are most productive, they will also be the ones with the most failed efforts. Research on psychological resilience suggests that people can survive and even thrive in conditions that others find traumatic. Their coping methods enable them to find meaning and purpose even in the greatest adversity, and they are most likely to maintain social and emotional ties during the hardest times.
In my own studies of traders, I have found a correlation between the success of the trader and the degree to which the trader utilizes problem-focused coping and a coping mechanism called "positive reappraisal". The successful individuals deal with problems as they occur, rather than become wrapped up in blaming of self or others. After they have dealt with the problems, they look back on their experience and try to take away something positive from the experience. For them, adversity becomes a tool of learning--not a defeat.
There are traders who are defeated by losses and there are traders who cope with losses. The highly successful individual, however, is the one who turns losses into gains by generating learning experiences and continuous self-improvement.
Monday, June 12, 2006
Market Update
Just a few notes from Monday's trading that might be of relevance. We continue to see broad market weakness. For instance, there were 5 issues in the S&P 600 small caps making new 52-week highs on Monday and 33 making new lows. That is the highest number of new lows since the recent weakness began. In the broad market, 315 issues made 20-day new highs; 1732 made new lows, indicating that last week's late bounce has not kept many issues off their lows. I notice that about 23% of S&P 500 stocks are above their 50-day moving averages. Typically, in the past several years, we've had to get below 20% to reach an intermediate-term market bottom. In all, plenty of reason to stay defensive.
Blueprint for an Uncompromised Life - Part Two: Devotion to Development
Perhaps the key take-away idea from my forthcoming book is that greatness is the outcome of a prolonged developmental process. It is not merely something people are born with, nor is it solely the result of hard work. Greatness lies at the intersection between talents (inborn capacities), skills (acquired competencies), and interests (personality). When these three variables come together early in a person's career (or life), it is as if an emotional spontaneous combustion results. Psychologist Howard Gardner refers to this as a "crystallizing experience": an encounter with a field that is so profound and meaningful that it organizes and sparks all future efforts.
The developmental process of extraordinary achievement begins with immersing oneself in a field for the sheer joy of the immersion. Because the work fits so well with talents, skills, and interests, it no longer seems like work. It is a kind of purposeful play, but it is driven by what Maslow called the "peak experience"; by the sense of "flow" described by Csikszentmihalyi. Only later is this purposeful play channeled into directed efforts at mastery, through interactions with mentors. Developmentally, greatness begins in play.
It is ironic that most individuals fail to achieve their potential stature, not because they don't work, but because they have never found that purposeful play that results from crystallizing experiences. We fall into career fields without sampling what we'd truly love; we fall into trading styles based upon what we hear and what we're taught--not from purposeful play across markets and trading styles.
In Part One, I highlighted "constancy of purpose" as a crucial element of extraordinary achievement. This constancy doesn't come from guilt or even from normal motivation. It comes from a deep, emotional desire to sustain the flow experience by extending one's mastery. Every creator experiences a kind of runner's high and, like any runner, has to run every longer and faster to reach the experience. In that sense, greatness is a kind of positive addiction: it provides its own reward.
The longstanding truism in the research on greatness is that it takes at least a decade of dedicated effort to reach expert levels of performance in any field. That decade is typically guided by the mentorship of others who are accomplished, particularly as the developmental process proceeds from the achievement of competence to true expertise. In every performance field I have encountered, expert performers spend more time in learning, preparation, and practice than in actual performance. Indeed, their intrinsic levels of motivation drive them to do nothing but that. It is in the course of mastering a domain, that these performers master themselves and undergo deep psychological change. Mastery of any field inevitably also brings self-mastery.
The developmental process of extraordinary achievement begins with immersing oneself in a field for the sheer joy of the immersion. Because the work fits so well with talents, skills, and interests, it no longer seems like work. It is a kind of purposeful play, but it is driven by what Maslow called the "peak experience"; by the sense of "flow" described by Csikszentmihalyi. Only later is this purposeful play channeled into directed efforts at mastery, through interactions with mentors. Developmentally, greatness begins in play.
It is ironic that most individuals fail to achieve their potential stature, not because they don't work, but because they have never found that purposeful play that results from crystallizing experiences. We fall into career fields without sampling what we'd truly love; we fall into trading styles based upon what we hear and what we're taught--not from purposeful play across markets and trading styles.
In Part One, I highlighted "constancy of purpose" as a crucial element of extraordinary achievement. This constancy doesn't come from guilt or even from normal motivation. It comes from a deep, emotional desire to sustain the flow experience by extending one's mastery. Every creator experiences a kind of runner's high and, like any runner, has to run every longer and faster to reach the experience. In that sense, greatness is a kind of positive addiction: it provides its own reward.
The longstanding truism in the research on greatness is that it takes at least a decade of dedicated effort to reach expert levels of performance in any field. That decade is typically guided by the mentorship of others who are accomplished, particularly as the developmental process proceeds from the achievement of competence to true expertise. In every performance field I have encountered, expert performers spend more time in learning, preparation, and practice than in actual performance. Indeed, their intrinsic levels of motivation drive them to do nothing but that. It is in the course of mastering a domain, that these performers master themselves and undergo deep psychological change. Mastery of any field inevitably also brings self-mastery.
Sunday, June 11, 2006
Blueprint for an Uncompromised Life - Part One: Constancy of Purpose
The phrase "constancy of purpose" captured, for Deming, what quality is all about in organizations. Plenty of companies have mission statements, but few seem infused with a sense of mission. Jeffrey Liker's book "The Toyota Way" makes clear that what makes that firm unique among its competitors is not a set of superior production tools. Rather, at all levels of the organization, there is an abiding belief in a production system that relentlessly seeks incremental improvements. The "lean" organization eliminates all that does not contribute to quality for the customer--whether the customer is internal (the next group of people in the production process) or external (the purchaser of the end product).
My review of individuals who are widely considered to be great within their fields--athletics, science, arts, leadership--finds that they are lean in the same way. They find a field that captures their imagination and interest, and they tinker at it and work with it until they reach a high level of mastery. This constancy of purpose is driven by a love for the effort itself: a chess grandmaster or Olympic athlete seeks out opportunities to meet challenges and become the best they can be. Taxing the production system and occasionally shutting down the production line is essential to Toyota's success. Until you test the limits of your system, you can't know where the weaknesses are. The highly successful individual is one who craves such tests. This is what Nietzsche meant when he said, "Under peaceful conditions, the warlike man turns on himself."
The psychologist Abraham Maslow made a crucial distinction between individuals who are driven by needs and those who pursue values. One is engaged in the elimination of deficit states; the other seeks to accomplish positive ends in their own right. He believed that, once basic needs were met, individuals would be free to actualize their greatest potentials. Yet it is not that simple. Many people have their basic needs more than met and yet display little constancy of purpose in their own lives.
Ed Seykota noted that good traders have talent, but--with great traders--the talent has them. So it is in any field. Constancy of purpose comes from the capacity to become absorbed in one's pursuits, to find them inherently challenging and meaningful, and to allow oneself to become a vehicle through which talents and skills are expressed.
That requires finding one's productive niche. Not a job, not a career, but a calling. How many traders fail to succeed at their work--how many people fail to succeed in life--because they have not found that niche that fits their talents, skills, and interests? Constancy of purpose is a natural outgrowth of finding a niche: When you're doing what you are meant to be doing, it is difficult to veer from the path of quality.
My review of individuals who are widely considered to be great within their fields--athletics, science, arts, leadership--finds that they are lean in the same way. They find a field that captures their imagination and interest, and they tinker at it and work with it until they reach a high level of mastery. This constancy of purpose is driven by a love for the effort itself: a chess grandmaster or Olympic athlete seeks out opportunities to meet challenges and become the best they can be. Taxing the production system and occasionally shutting down the production line is essential to Toyota's success. Until you test the limits of your system, you can't know where the weaknesses are. The highly successful individual is one who craves such tests. This is what Nietzsche meant when he said, "Under peaceful conditions, the warlike man turns on himself."
The psychologist Abraham Maslow made a crucial distinction between individuals who are driven by needs and those who pursue values. One is engaged in the elimination of deficit states; the other seeks to accomplish positive ends in their own right. He believed that, once basic needs were met, individuals would be free to actualize their greatest potentials. Yet it is not that simple. Many people have their basic needs more than met and yet display little constancy of purpose in their own lives.
Ed Seykota noted that good traders have talent, but--with great traders--the talent has them. So it is in any field. Constancy of purpose comes from the capacity to become absorbed in one's pursuits, to find them inherently challenging and meaningful, and to allow oneself to become a vehicle through which talents and skills are expressed.
That requires finding one's productive niche. Not a job, not a career, but a calling. How many traders fail to succeed at their work--how many people fail to succeed in life--because they have not found that niche that fits their talents, skills, and interests? Constancy of purpose is a natural outgrowth of finding a niche: When you're doing what you are meant to be doing, it is difficult to veer from the path of quality.
Saturday, June 10, 2006
Pathways to the Heroic
Every year I make it a point to take a vacation and find inspiration in new settings. This week I'm in Wailea, Maui. Something about water vistas is conducive, I find, to reflection and invigoration. It was a beach vacation during the winter break of my sophomore year at Duke that I sat overlooking the ocean, reading a book that would influence me greatly: The Fountainhead by Ayn Rand. As I looked over the water, the thought came to me: this is what I should do with psychology. I should be helping normal people reach their heroic stature, not just assisting troubled individuals with their problems.
It is 30 years after that eventful vacation, and now I face the ocean in a similar fashion as I type these words (ah, the joys of technology that bring wireless communication to nature's settings!) I have not lost the conviction that psychology is not merely a set of tools for coping and solving problems. Properly employed, it provides pathways toward the heroic: toward our living life meaningfully, purposefully, and constructively.
Anthropologist Joseph Campbell identified the essence of heroism across cultures when he described the descent into the depths to battle forces greater than ourselves. The hero is one who accepts this quest, meets the challenges, and brings back from the depths a boon that betters the world. Heroes, however, are not simply motivated to improve the world. Rather, they are driven by the heroic quest itself: the desire to transcend obstacles, test themselves, and be more than they are at present.
Few, few people understand that trading can be one forum for tackling inner forces and outer challenges and continually testing and honing oneself. The successful trader captures the boon of profits, but this is not the crucial motivation. Ask most successful traders if they would put aside what they do in exchange for a guaranteed mechanical system that made money each year, and the majority would decline--just as Michael Jordan or Tiger Woods would have declined if someone offered them millions at the start of their careers in exchange for giving up their sports.
Every meaningful activity--art, science, sport, trading--is a potential pathway to the heroic. This week on this blog, I will outline several keys to the pursuit of the heroic. Perhaps this vacation on the blog can help readers, as it helps me, stay grounded in what is most important.
It is 30 years after that eventful vacation, and now I face the ocean in a similar fashion as I type these words (ah, the joys of technology that bring wireless communication to nature's settings!) I have not lost the conviction that psychology is not merely a set of tools for coping and solving problems. Properly employed, it provides pathways toward the heroic: toward our living life meaningfully, purposefully, and constructively.
Anthropologist Joseph Campbell identified the essence of heroism across cultures when he described the descent into the depths to battle forces greater than ourselves. The hero is one who accepts this quest, meets the challenges, and brings back from the depths a boon that betters the world. Heroes, however, are not simply motivated to improve the world. Rather, they are driven by the heroic quest itself: the desire to transcend obstacles, test themselves, and be more than they are at present.
Few, few people understand that trading can be one forum for tackling inner forces and outer challenges and continually testing and honing oneself. The successful trader captures the boon of profits, but this is not the crucial motivation. Ask most successful traders if they would put aside what they do in exchange for a guaranteed mechanical system that made money each year, and the majority would decline--just as Michael Jordan or Tiger Woods would have declined if someone offered them millions at the start of their careers in exchange for giving up their sports.
Every meaningful activity--art, science, sport, trading--is a potential pathway to the heroic. This week on this blog, I will outline several keys to the pursuit of the heroic. Perhaps this vacation on the blog can help readers, as it helps me, stay grounded in what is most important.
Friday, June 09, 2006
NASDAQ Is Up In Arms!
Note: I'll be on the road this coming week, but will be updating this site during that time. Next Weblog update scheduled for Friday, June 16th. Here is the Trading Markets article on combining historical analyses with intraday market patterns.I notice that the NASDAQ 100 Index (QQQQ) is down over 3% over the last five trading sessions, with all five days showing an Arms Index (TRIN) over 1.0. This means we've had concentrated selling among NASDAQ 100 issues over that period.
Since 2004 (N = 608 trading sessions), we've had 18 occasions in which five consecutive days have had elevated Arms Index readings. QQQQ has been higher two days later by an average of .37% (11 up, 7 down). That is stronger than the average two-day gain of .03% (308 up, 300 down) for the entire sample.
When the five-day average of the Arms Index has been above 1.5 (N = 26), the next two days in QQQQ have averaged a gain of .42% (16 up, 10 down), again stronger than average for the sample.
Interestingly, when the five-day price change in QQQQ has been down 3% or more (N = 46), the results going forward have been subnormal. This is particularly the case when the five-day Arms Index has been elevated during a five-day drop of 3% or more. When the market has dropped 3% or more and the average Arms Index has been elevated (N = 23), the next three days in QQQQ average a loss of -.32% (8 up, 15 down). When the market has had a 3% or greater drop and the Arms Index has not been elevated (N = 23), the next three days in QQQQ have averaged a gain of .13% (11 up, 12 down).
The bottom line is that concentrated selling, as measured by the Arms Index (TRIN) over five days, is normally bullish in QQQQ. When it has been accompanied by a steep price drop over the past five days (as we've seen recently), however, the returns over the near term have not been favorable.
Thursday, June 08, 2006
Why Thursday's Market Might Have Felt Unfamiliar
Thursday's trading was a true roller coaster, with sharp moves down, up, down, and then up. We closed well off the lows on very heavy volume, raising the possibility of this being a selling climax day. I went back to 1996 (N = 2576) and did a little nearest neighbor analysis to identify trading days most similar to today in SPY. These similar occasions (called nearest neighbors) had the following characteristics: 1) lows that were more than 1% below the day's open; 2) closes that were more than 1% above their days' lows; 3) relative volume (volume as % of 20-day average volume) greater than 1.5; 4) closing price within 1% of the previous day's close; and 5) the previous three days' price change down more than 1%.
I found 31 occasions matching these criteria. Five days later in SPY, the market was down by an average of -.79% (11 up, 20 down), considerably weaker than average.
Perhaps most interesting, of the 69 occasions in which we had a day that moved more than 1% below the open, but closed more than 1% above the lows on heavy volume, none of those occasions took place during 2005 or 2006 and only one occasion took place in 2004 and none in 2003. Nine instances occurred in 2002, eight in 2001, eleven in 2000, twelve in 1999, ten in 1998, and fourteen in 1997. The vast majority of occurrences took place during bear swings in the market: the three days prior to the roller coaster day averaged down by more than 2%.
In other words, this kind of high volume roller coaster day is much more typical of volatile market periods than the period we've had since 2003. If the market felt unfamiliar to you, there's good reason for it. This was action more common to bear markets than bull ones.
I found 31 occasions matching these criteria. Five days later in SPY, the market was down by an average of -.79% (11 up, 20 down), considerably weaker than average.
Perhaps most interesting, of the 69 occasions in which we had a day that moved more than 1% below the open, but closed more than 1% above the lows on heavy volume, none of those occasions took place during 2005 or 2006 and only one occasion took place in 2004 and none in 2003. Nine instances occurred in 2002, eight in 2001, eleven in 2000, twelve in 1999, ten in 1998, and fourteen in 1997. The vast majority of occurrences took place during bear swings in the market: the three days prior to the roller coaster day averaged down by more than 2%.
In other words, this kind of high volume roller coaster day is much more typical of volatile market periods than the period we've had since 2003. If the market felt unfamiliar to you, there's good reason for it. This was action more common to bear markets than bull ones.
What Happens After Three Straight Down Days?
We've had three consecutive down days, losing about 2.4% in SPY over that time. Going back to October, 1998 (N = 1923 trading days), there have been 174 occasions in which we've had three down days. The next day, SPY has been up by an average of .31% (113 up, 61 down), much stronger than the average one-day gain of .02% (1003 up, 920 down) for the entire sample.This positive bias has been present during the recent bull market. Since March, 2003, we've had 54 occasions of three consecutive down days. The next day SPY has been up by an average of .25% (39 up, 15 down). What this means is that, after three straight down days, we've been about twice as likely to have an up day as a down day. Indeed, we've had an up day follow three straight down days 8 of the last 10 occurrences, going back to October, 2005.
Wednesday, June 07, 2006
What Happens After 20 Days of Market Weakness?
Going back to 2001 (N = 1304 trading days), we've had 127 occasions in which the market (SPY) was down more than 5% in a 20-day period with a 20-day average Arms Index (TRIN) of greater than 1.2. (As of Wednesday, SPY was down about 5.1% over the last 20 days, with an average Arms Index of 1.27). What happens after such an intermediate period of weakness?
Interestingly, the outlook over the next five days is not favorable for the bulls. SPY five days later averages a loss of -.23% (56 up, 71 down). That is much weaker than the average five day gain of .05% (679 up, 625 down) for the entire sample.
By 20 days out, however, we have a different story. When SPY has been weak over a 20-day period with a high Arms Index, the next 20 days in SPY have averaged a gain of 1.52% (73 up, 54 down). That is considerably stronger than the average 20-day gain of .21% for the entire sample (747 up, 557 down).
In general, when the 20-day Arms Index has been above 1.2 (N = 410), the next five days in SPY have averaged a loss of -.17% (194 up, 216 down). That is quite a bit weaker than the average five-day gain of .14% for the rest of the sample.
It thus appears that 20 days of weakness, with volume concentrated among declining issues, has subnormal outcomes in the near-term, but favorable ones on an intermediate-term basis. This pattern in the past has been most helpful in anticipating trend changes. I'll be tracking potential changes on a daily basis here and in the Weblog.
Interestingly, the outlook over the next five days is not favorable for the bulls. SPY five days later averages a loss of -.23% (56 up, 71 down). That is much weaker than the average five day gain of .05% (679 up, 625 down) for the entire sample.
By 20 days out, however, we have a different story. When SPY has been weak over a 20-day period with a high Arms Index, the next 20 days in SPY have averaged a gain of 1.52% (73 up, 54 down). That is considerably stronger than the average 20-day gain of .21% for the entire sample (747 up, 557 down).
In general, when the 20-day Arms Index has been above 1.2 (N = 410), the next five days in SPY have averaged a loss of -.17% (194 up, 216 down). That is quite a bit weaker than the average five-day gain of .14% for the rest of the sample.
It thus appears that 20 days of weakness, with volume concentrated among declining issues, has subnormal outcomes in the near-term, but favorable ones on an intermediate-term basis. This pattern in the past has been most helpful in anticipating trend changes. I'll be tracking potential changes on a daily basis here and in the Weblog.
When Buyers and Sellers Duke It Out
Many times, worthwhile trade ideas come from observations of unusual market events. On Tuesday, for example, we had squalls of selling and bouts of heavy buying. Recall from my recent posts that the Institutional Composite measure consists of two components: Institutional Buying and Institutional Selling. As noted in the Weblog, we had unusually high levels of both on Tuesday. That led to ask, "What has happened in the past when buyers and sellers duke it out?"
Since July, 2003 (N = 734), we have had 22 occasions in which Buying has been above +400 and Selling has been below -400. The next day in SPY has averaged a gain of .32% (15 up, 7 down), much stronger than the average single-day gain of .04% over the entire period.
Conversely, when Buying is under -400 and Selling has been above +400 (very little buying and very light selling; N = 21), the next day in SPY averages a loss of -.15% (7 up, 14 down)--much weaker than average.
In short, active market participation by buyers and sellers appears to have more favorable short-term outcomes than occasions in which both buyers and sellers sit on the sidelines. There weren't many sideline-sitters on Tuesday.
Since July, 2003 (N = 734), we have had 22 occasions in which Buying has been above +400 and Selling has been below -400. The next day in SPY has averaged a gain of .32% (15 up, 7 down), much stronger than the average single-day gain of .04% over the entire period.
Conversely, when Buying is under -400 and Selling has been above +400 (very little buying and very light selling; N = 21), the next day in SPY averages a loss of -.15% (7 up, 14 down)--much weaker than average.
In short, active market participation by buyers and sellers appears to have more favorable short-term outcomes than occasions in which both buyers and sellers sit on the sidelines. There weren't many sideline-sitters on Tuesday.
Tuesday, June 06, 2006
S&P Momentum Effects Are Not Dead
 Let's say you have a very large basket of operating company stocks. You calculate a short-term moving average for each issue in the basket and a 2 standard deviation envelope around that moving average. We will call the number of stocks closing above their upper band Demand. The number closing below their lower band will be called Supply. When Demand is high, it means that many stocks are displaying very strong short-term price momentum. When Supply is high, it signifies the reverse. Observe that this is not your usual momentum measure: Demand and Supply are measuring breadth as well as extent of momentum and are setting relative momentum criteria for each stock based upon its volatility.
(Note: A version of Demand/Supply is posted daily to the Trading Psychology Weblog.)
Since March, 2003 (N = 816 trading days), when the Demand reading is above 600 (N = 58), the next three days in SPY average a gain of .61% (45 up, 13 down). That is much stronger than the average three-day SPY gain of .16% (473 up, 343 down) for the entire sample. Broad, strong upside momentum thus tends to follow through with strength over the near term.
During that same time, when the Supply reading has been above 700 (N = 37), the next two days in SPY have averaged a loss of -.01% (18 up, 19 down). That is weaker than the average two-day gain of .11% (442 up, 374 down) for the entire sample. As we saw in the previous post, broad downside momentum tends to follow through with weakness over the near term.
When the difference between Demand and Supply is greater than 500 on a single day (N = 40), the next three days in SPY average a gain of .33% (30 up, 10 down), much stronger than average.
When the difference between Demand and Supply is less than -500 (N = 53), the next two days in SPY average a loss of -.04% (23 up, 30 down)--much weaker than average.
The bottom line is that momentum effects in the market are not dead. They are simply mediated by the breadth--not just the extent--of the momentum.
P.S. - Here's the link if you want your own digital church sign.
The Market is UP in ARMS! (Updated)
Yesterday's selloff came with an Arms Index reading of 2.85. We've only had seven higher daily readings since March, 2003. The Arms Index (named after inventor Richard Arms and also known as TRIN) measures the average volume per declining stock vs. the average volume per advancing stock. When the Index is greater than 1, more volume is flowing into declining issues and vice versa. At 2.85 on Monday, volume was certainly skewed to the sell side.
We've had 40 occasions of daily Arms Index readings above 2.0 since March, 2003. Three days later, SPY has been up by an average of .75% (26 up, 14 down). That is much stronger than the average three day change in SPY of .17% for the entire sample. We have had three readings above 2.0 in 2006 thus far; all three led to higher prices the following trading session.
Interestingly, we've had two days in the last five trading sessions in which the Arms Index has been above 2.0. Similar clustering of extreme readings occurred in 3/2003; 3/2004; and 8/2004--all favorable buying opportunities. During the prior bear market, such clusterings were much more frequent.
UPDATE: As most of you know, I do not base my day's trading strategy on any single analysis. I need to see multiple historical patterns pointing in the same direction. Readers of the Weblog are familiar with the Demand/Supply measures, which are indices of the number of stocks that are showing unusually strong positive vs. negative price momentum. I will be posting more on this measure in the near future. On Monday, we hit a very high Supply figure above 200, which has only occurred five times previous since March, 2003. All five occasions were down three days later in SPY; four of five were down the next day. Very strong downside momentum does tend to spill over into further weakness in the near term.
We've had 40 occasions of daily Arms Index readings above 2.0 since March, 2003. Three days later, SPY has been up by an average of .75% (26 up, 14 down). That is much stronger than the average three day change in SPY of .17% for the entire sample. We have had three readings above 2.0 in 2006 thus far; all three led to higher prices the following trading session.
Interestingly, we've had two days in the last five trading sessions in which the Arms Index has been above 2.0. Similar clustering of extreme readings occurred in 3/2003; 3/2004; and 8/2004--all favorable buying opportunities. During the prior bear market, such clusterings were much more frequent.
UPDATE: As most of you know, I do not base my day's trading strategy on any single analysis. I need to see multiple historical patterns pointing in the same direction. Readers of the Weblog are familiar with the Demand/Supply measures, which are indices of the number of stocks that are showing unusually strong positive vs. negative price momentum. I will be posting more on this measure in the near future. On Monday, we hit a very high Supply figure above 200, which has only occurred five times previous since March, 2003. All five occasions were down three days later in SPY; four of five were down the next day. Very strong downside momentum does tend to spill over into further weakness in the near term.
Monday, June 05, 2006
Composite Institutional Buying and Selling: What It Means
We've had quite a selloff today; I will post the indicators in tonight's Weblog and will also post relevant historical patterns right here tomorrow AM before the open.
In the last two posts, I have looked at Institutional Buying (defined as the tendency of buyers to lift offers among actively traded institutional favorite stocks) vs. Institutional Selling (defined as the tendency of sellers to hit bids among those same stocks). The Institutional Composite is a weighted index of these two.
Since July, 2003 (N = 732 trading days), we have seen 36 occasions in which the Composite has hit a level of +500 or greater. The next day, SPY has been down by an average of -.15% (15 up, 21 down)--much weaker than normal.
Conversely, when the Composite has been -500 or lower (N = 46), SPY has been up the next day by an average of .20% (28 up, 18 down)--and by a whopping .56% three days out (34 up, 12 down).
When we take price out of the equation, however, we can see that strength in the Composite on strong up days in SPY leads to more favorable returns three days out than if strength in SPY is accompanied by weak Composite readings. When SPY is up by .60% or more (N = 142) and the Composite is strong (N = 71), the market is up by an average of .17% three days later (48 up, 23 down). When SPY is up by .60% or more and the Composite is weak (N = 71), the market is down by an average of -.04% (36 up, 35 down).
What this means is that when there is net buying pressure (a strong Composite) but price is not strong, the short-term outlook is subnormal. When strong price action is accompanied by strong buying pressure, there is greater likelihood that the rise will continue. The Composite thus must be evaluated relative to the price movement it is associated with, not analyzed in isolation.
When SPY is down sharply on the day *and* we have a Composite reading of -500 or less (N = 27), the market is up three days later by an eye-popping .58% (21 up, 6 down). That is much stronger than the average three day gain in SPY of .17% for the remainder of the sample of weak SPY days.
If we summarize the last three posts, it looks like Institutional Buying and Institutional Selling are worth tracking as separate market variables. Dividing volume into action at the offer vs. bid appears to give very worthwhile information for short-term traders. The balance between the two, as captured by the Composite, appears to be most important at the extremes: when traders are dominantly hitting bids or lifting offers. I will be tracking these extremes going forward in the Weblog.
In the last two posts, I have looked at Institutional Buying (defined as the tendency of buyers to lift offers among actively traded institutional favorite stocks) vs. Institutional Selling (defined as the tendency of sellers to hit bids among those same stocks). The Institutional Composite is a weighted index of these two.
Since July, 2003 (N = 732 trading days), we have seen 36 occasions in which the Composite has hit a level of +500 or greater. The next day, SPY has been down by an average of -.15% (15 up, 21 down)--much weaker than normal.
Conversely, when the Composite has been -500 or lower (N = 46), SPY has been up the next day by an average of .20% (28 up, 18 down)--and by a whopping .56% three days out (34 up, 12 down).
When we take price out of the equation, however, we can see that strength in the Composite on strong up days in SPY leads to more favorable returns three days out than if strength in SPY is accompanied by weak Composite readings. When SPY is up by .60% or more (N = 142) and the Composite is strong (N = 71), the market is up by an average of .17% three days later (48 up, 23 down). When SPY is up by .60% or more and the Composite is weak (N = 71), the market is down by an average of -.04% (36 up, 35 down).
What this means is that when there is net buying pressure (a strong Composite) but price is not strong, the short-term outlook is subnormal. When strong price action is accompanied by strong buying pressure, there is greater likelihood that the rise will continue. The Composite thus must be evaluated relative to the price movement it is associated with, not analyzed in isolation.
When SPY is down sharply on the day *and* we have a Composite reading of -500 or less (N = 27), the market is up three days later by an eye-popping .58% (21 up, 6 down). That is much stronger than the average three day gain in SPY of .17% for the remainder of the sample of weak SPY days.
If we summarize the last three posts, it looks like Institutional Buying and Institutional Selling are worth tracking as separate market variables. Dividing volume into action at the offer vs. bid appears to give very worthwhile information for short-term traders. The balance between the two, as captured by the Composite, appears to be most important at the extremes: when traders are dominantly hitting bids or lifting offers. I will be tracking these extremes going forward in the Weblog.
Institutional Buying and Selling During Weak Market Days
Following up on the previous post, we're now looking at occasions in which SPY is down .50% or more on the day since July, 2003 (N = 154). Recall that we're looking at a basket of large cap stocks favored by institutions and the tendency to transact business at the offer price (Institutional Buying) vs. the bid (Institutional Selling).
When we have a down day in SPY but Institutional Buying is relatively strong (N = 77), the next day in SPY averages a gain of .22% (50 up, 27 down). When we have a down day in SPY, but Institutional Buying is relatively weak, the next day in SPY averages a gain of only .10% (45 up, 32 down). When Institutional Buying is positive on a weak SPY day (N = 55), the next day in SPY averages a gain of .27% (37 up, 18 down).
Thus, as we saw with the strong days in SPY, heavier Institutional Buying is associated with more bullish short-term outcomes.
How about Institutional Selling? On a next day basis, it doesn't seem to make a difference. Three days out, however, we begin to see a pattern. When SPY is weak and there is light Institutional Selling (N = 77), the next three days in SPY average a gain of .33% (50 up, 27 down). When SPY is weak and there is strong Institutional Selling (N = 77), the next three days in SPY average a gain of .18% (45 up, 32 down).
Once again, we see that Selling is less robustly related to short-term outcomes than buying. Once again, also, combining Buying and Selling into a Composite loses information in the short run. When SPY is weak, the Composite of Buying and Selling does not have a meaningful impact 1-3 days out.
The moral of the story is, as Ayn Rand admonished, to check your premises. My premise that a Composite measure would outperform the individual components seems to be in at least partly in error. Oddly, when we consider the Composite independent of price change, patterns do emerge. I'll summarize those in the next post, with comments in tonight's Trading Psychology Weblog.
When we have a down day in SPY but Institutional Buying is relatively strong (N = 77), the next day in SPY averages a gain of .22% (50 up, 27 down). When we have a down day in SPY, but Institutional Buying is relatively weak, the next day in SPY averages a gain of only .10% (45 up, 32 down). When Institutional Buying is positive on a weak SPY day (N = 55), the next day in SPY averages a gain of .27% (37 up, 18 down).
Thus, as we saw with the strong days in SPY, heavier Institutional Buying is associated with more bullish short-term outcomes.
How about Institutional Selling? On a next day basis, it doesn't seem to make a difference. Three days out, however, we begin to see a pattern. When SPY is weak and there is light Institutional Selling (N = 77), the next three days in SPY average a gain of .33% (50 up, 27 down). When SPY is weak and there is strong Institutional Selling (N = 77), the next three days in SPY average a gain of .18% (45 up, 32 down).
Once again, we see that Selling is less robustly related to short-term outcomes than buying. Once again, also, combining Buying and Selling into a Composite loses information in the short run. When SPY is weak, the Composite of Buying and Selling does not have a meaningful impact 1-3 days out.
The moral of the story is, as Ayn Rand admonished, to check your premises. My premise that a Composite measure would outperform the individual components seems to be in at least partly in error. Oddly, when we consider the Composite independent of price change, patterns do emerge. I'll summarize those in the next post, with comments in tonight's Trading Psychology Weblog.
Subscribe to:
Posts (Atom)


 Posts


