Showing posts sorted by date for query sentiment. Sort by relevance Show all posts

Monday, June 08, 2026

Best Practices In Trading: Getting To The Next Level

 
6/14/2026 - With the recent release of the latest Market Wizards book, my latest project is a review of all the Market Wizards books alongside a review of books written by accomplished traders.  This is known in academic circles as a "literature review" and the goal is to capture the state of knowledge in a field and also identify questions/issues that remain unanswered.

It's clear that the Wizards trade very different markets and trade in very different ways over very different time frames.  To use an analogy, great singers don't sing the same songs and they don't sing the same way.  Something else makes them great.  There's a talent element, and there's also a process they've gone through to cultivate that talent and build the necessary skills and experience.

What we see among the Wizards--and what I believe gets them to that next level of performance--is immersion in markets.  They don't just work hard; they live and breathe markets.  And it's not that they live and breathe trading; rather, they absorb themselves in the pursuit of opportunity.  This is apparent in the interview with Mark Minervini in the Stock Market Wizards book.  He is fully immersed in the hunt and, yes, he has his trading methods and his ways of managing risk and reward.  What makes the Wizards truly special, I believe, is the degree to which they internalize what they do.  It is not unlike an Olympic athlete or world-class concert pianist who are immersed in practice every day.

Constant working out produces unusual strength.  The market greats have such a passion for what they do that they are always working out.  Average traders are forever looking for the next video, the next secret trade setup, the next secret sauce.  Their very search for easy answers tells you that they lack what it takes to be a Market Wizard.

====================

6/12/2026 - Getting to the next level of trading performance doesn't necessarily mean getting bigger and bigger.  Very successful traders get broader and broader and find opportunities in different markets and different regions of the world.  There's a way of getting broader, however, that I especially notice among teams and traders that have excellent risk-adjusted returns.  They not only make money, but do so consistently.  They are able to make money in different market environments.

Many traders define opportunity as directional movement.  When markets are not trading in trends, they assume that those markets are "noisy", "choppy", and untradeable.  Nothing could be further from the case.  Two sets of opportunities appear in slow and choppy markets:

1)  Movements in relative value - Traders will be long one instrument and short another closely connected one to take advantage of occasions where one moves too far relative to the other.  For instance, the entire stock market may be trading in a range, but value stocks (SPYV) will be strong relative to growth stocks (SPYG).  This can occur when weak buyers are getting out of the growth names.  Buying growth stocks and selling value stocks, adjusting the pair for volatility, profits from occasions where the two groups get more in line.  The overall market can go up or down, but as long as your pair moves the right way, you profit.  This is a common strategy in interest rate markets when central banks are not in play.  Flows will take one bond higher relative to a nearby instrument and the RV trader can play for the two to come back in line.

2)  Cyclical movement - Many markets that aren't trading in trends display dominant cycles.  These can be intraday, short-term, and longer-term.  Often there are cycles within cycles, which greatly aid in entry and exit execution.  John Ehlers' work is particularly helpful; an amazing set of resources can be found here.  My experience is that even trending, directional markets display cyclical elements.  Understanding those is very helpful in timing.  Conversely, truly choppy/noisy markets are often dominated by short-term cycles, which can provide opportunities for active traders.

A true sign of mastery is the ability to sit back, see how a market is trading, and then utilize the tools to take advantage of the environment.  Frustrated traders frequently lack those tools.

==================    

6/11/2026 - A marriage lasts for decades and flourishes, not because there aren't problems and challenges, but because there is such a deep sense of love that the setbacks simply become opportunities to collaborate and approach things in new and different ways.  We can see in the Market Wizards books that the great traders fall in love with markets and cultivate unique approaches to finding and managing risk and reward.  They truly *love* what they do, which is why they pursue it passionately.  It is out of that love that they dig and dig and discover what others miss.  

It's tempting for new traders to look for answers from others and simply try to copy their techniques.  No Market Wizard has reached their status by copying other Wizards...greatness cannot be found in following the same "setups" and indicators that others look at.  Copying others cannot bring the passion and meaning of finding one's own edges that express the deep fit between who you are and what you do.

Your true edge is an expression of who you are:  how you see and act upon things.  When we fall in love with what we do, setbacks are not threatening.  We succeed because of commitment, not because of "motivation".

=====================  

6/10/2026 - Often, it's the less sexy parts of trading that lead to the greatest performance improvements.  It's great coming up with new trade ideas and opportunities and that is essential to success.  What gets many traders to the next level, however, is work on the execution of their ideas.

Once you figure out that the market is likely to move in a particular way, how do you enter that trade so that your reward is maximized relative to your risk?  Good execution is the beginning point of sound risk management.  Also, when we have sound execution criteria, we achieve clarity in the trade, which is essential to a positive trading psychology.

I have found it to be helpful to get into a long trade *after* I believe the market has found a bottom and to go short *after* I believe we've seen a top.  That means that sound execution is based upon how the market is behaving.  It's not based on our predictions.

For instance, the market will be strong, get to an overbought point, and then sell off.  The sell off occurs on weak breadth, which means that the majority of stocks retreat from their highs.  I then look at the very short-term indicators of buying/selling to see if the subsequent buying fails to bring us to new highs and fails to bring the majority of stocks meaningfully higher.  For example, we will get a bounce in the NYSE TICK and we will get to an overbought point on an intraday measure such as RSI with prices failing to make new highs and that is where I want to sell.  The prior high is a natural stop level and the market is telling me that the buyers are no longer in control.  

The advantage of such execution is that we know clearly where we are wrong and can get out quickly, easily, and without too much of a loss.  We can also use medium-term oversold levels to identify areas for taking at least partial profits and we can use subsequent weak bounces to add to our position, using prior highs as trailing stops.  

Our work on execution gives us a sense of control and understanding, both essential to a winning mindset.  As noted below, the right strategy is necessary but will not win without the right tactics.

======================

6/9/2026 - The most successful people I've worked with in markets combine strategic thinking--a vision of the big picture--with tactical thinking, a sense for here-and-now opportunity.  This is not so different from success on the battlefield, where a sound strategy is necessary, but must be implemented tactically:  in the right way at the right time.  Similarly, a basketball team will pursue a strategy to take advantage of an opponent's weaknesses, and will look for tactical situations to press this strategy.  

Pursuing short-term opportunity without a grounding in strategy leads to small gains punctuated with periods of getting run over.  Pursuing a good strategy without the patience to wait for the right tactical implementation leads to getting shaken out of good ideas.  

The successful market participants are investors--they are invested in ideas--and they are traders:  they know how and when to press those ideas.  

Success is one part vision, one part patience.  When the strategy doesn't line up with opportunity, the great trader can wait.  When the strategy and opportunity align, the great trader can go for it.

=====================

6/8/2026 - In this series of posts, we'll take a look at best trading practices that contribute to long term success.  The first best practice is utilizing time effectively when you are *not* trading.  There are always slow periods in markets, and there are always periods when you just need to let your trades play out.  During those periods when you're not trading, how productive is your time?  Do your activities during slow portions of the day and before and after market hours contribute to your trading success?

The best traders I've worked with are actively engaged in markets when they are not trading.  They are looking for--and testing--new trading edges.  They are talking with other traders and picking up on market sentiment and news they might have missed.  They are reading research reports; they are conducting their own studies; they are reviewing fresh market opportunities.  In short, the best traders are just as immersed in idea generation as they are in placing and managing risk.

Many, many traders crave stimulation and can't tolerate any feeling of inactivity and boredom during the day.  That leads them to trade when they have no documented edge.  Such overtrading is not a function of fear and greed.  It results from the need to fill a void: the need for excitement.  The best traders have well-developed lives outside of market hours and don't need markets to provide them with stimulation.  They are free to use their time searching for fresh ideas and researching new edges because they find the discovery process itself to be stimulating.  They also get stimulation from their personal activities and relationships and don't need to get it from taking risk in markets.

A great way to identify excellent traders is to see what they do when they are not trading.  Productive non-trading time builds the mindset...and ultimately builds the trading.  

Thursday, January 15, 2026

Finding Hidden Edges In The Market

 
1/21/2026 - One last edge that is hidden because few people are looking there:  Let's take the percentage of stocks in the SPX each day that are trading above their longer-term moving averages.  In this case, we'll look at the percentage above their 50-day averages (once again, data can be found on the Market Charts site).  We then look at see what the index (SPY) does five days later.  Sure enough, when the percentage of stocks above their 50-day averages is in its highest quartile, the next five day returns in SPY are subnormal:  .11% vs almost four times that amount when they're in their lowest quartile.  This makes sense...overbought markets tend to pull back and oversold markets are more likely to bounce.

But, wait!  What do we see when we look at the next 50-day returns?  Sure enough, returns are significantly more favorable following the strongest 50-day periods and after the weakest 50-day periods.  In other words, at longer time horizons, we see both momentum and reversal.

What this means is that, following a strong 50-day period of breadth, on average pullbacks are meant to be bought.  This goes hidden, however, because traders are unwilling/unable to take losses and bail out long before the bounce tends to occur.  To take advantage of the edge, it's necessary to think like an investor as well as like a trader.  And that dual mindset is rare indeed!

=======================    

1/20/2026 - Do we find hidden edges among small cap stocks as well as the large cap issues in the SPX?  For this analysis, we go back to 2015 and examine the percentage of stocks in the S&P 600 universe ($SML) that are trading above their 3, 5, 10, 20, 50, 100, and 200-day moving averages.  These data are readily available on the excellent MarketCharts site.  I specifically examined the variability of the breadth readings: the standard deviation of each day's data.  The variability captures two market scenarios:  when short term breadth turns much higher following a longer-term period of weakness and when it turns much lower following a longer-term period of strength.  Note that this is a different way of identifying breadth thrusts.

When variability has been in its highest quartile (thrust conditions), the next 20 day return in $SML has been +1.70%.  That compares to a 20-day return of -.05% when breadth readings have been least variable.

There are many other patterns that can be found in the small cap data.  

Once again, the idea is not that you should trade small caps or trade them based on these particular historical patterns.  Rather, the idea is that a large number of traders focus on the information that is most readily available and that takes the least analysis (chart patterns, news reports), leaving significant opportunities to those willing and able to collect and analyze data.  Meaningful edges are to be found over time frames longer than most traders look, and that's why they're hiding in plain sight.

=====================

1/19/2026 - Many traders view technical indicators as something to chart; then they look for chart patterns.  In fact, many technical indicators produce data that, when backtested, yield important hidden edges.  The stockcharts.com site gives daily readings on a number of technical measures that can be downloaded and tested.  For example, when a large number of stocks in the NYSE display an improving Chaikin Money Flow (top quartile of distribution since 2021), the next 30 days in SPY average a gain of only +.55% compared with almost three times that much for the rest of the sample.  When a large number of stocks display a weakening Money Flow (weakest half of the distribution), returns average twice as much over the next 30 days than the rest of the sample.

Consider Bollinger Bands.  When very few stocks in the NYSE close above their upper Bollinger Bands since 2021 (lowest quartile of distribution), the next 30 days in SPY have shown a dramatic upside edge:  three times the average returns of the remainder of the sample.  

Most powerful is when relatively uncorrelated indicators display historical edges that line up with one another.  Conviction is not just a state of mind.  It follows from rigorous analysis and understanding of market behavior.

=====================

1/18/2026 - Now let's take a look at a different hidden edge in the market:  not strength, but the absence of weakness.  For this analysis, we'll go back to August, 2010 when I began collecting these data (available via Barchart.com) and take a look at the number of stocks in the NYSE universe that are making fresh monthly highs and fresh monthly lows.  What we find is that next 20-day returns in SPY average +1.44% when monthly lows are in their lowest quartile.  That is about double the return of the next two quartiles.  When few stocks are weak, overall market declines are rarer.  It takes weakness in some areas of the market to lead the broad averages lower.

Interestingly, next 20-day returns are also superior (+1.27%) when new monthly lows are in their highest quartile.  In other words, when we have lots of stocks making new lows and the market is flushing out, that has often been a good time to find value.  A similar pattern shows quite superior returns 50 days out when three-month new lows are either very low or very high.  

So why are these edges hidden to most traders?  They haven't taken the time to download and analyze the data, and they are looking for things to trade in the next few minutes and days--not what has dramatic edge over a period of weeks to months.  The need to trade actively hides the edges that play out over time.

=====================     

1/16/2026 - Some of the best hidden edges in the market occur, not when institutions are piling into stocks or fleeing them, but when they are rotating existing assets from one sector of the market/economy to others.  This sector rotation can easily be tracked by following the breadth within each sector.  In this post, we'll use the percentage of stocks trading above their 20-day moving averages as a breadth proxy for each sector.  (Data available from Barchart.com).

So let's take the breadth within the energy sector (XLE) minus the breadth of the overall market (SPY).  When energy breadth is in the top half of its distribution since 2020, returns in SPY over the next 10, 20, and 30 days are distinctly subnormal.  Indeed, when energy sector breadth is highest relative to overall market breadth, the returns over the next 3-5 days have been negative--quite a feat in a bull market period!

Energy stocks do well when energy prices are rising.  But that is not an environment that is necessarily good for the overall economy.  Seeing where money is flowing alerts us to potential headwinds and tailwinds in the broad market.

======================  

1/15/2026 - Some of the most promising edges in the stock market are found in places traders generally don't look.  Actually, this dynamic occurs across markets.  For example, the majority of traders in the fixed income (interest rates) markets look for events (central bank policy changes; shifts in patterns of growth) to buy or sell rates.  A more subtle approach looks at how rates vary from one another within and across bond markets and trades those relative relationships.  So, for instance, if nothing has changed in central bank policies and in macroeconomic news, one part of the rate curve may be priced cheaply relative to another point, or rates in one region of the world will be expensive relative to another region.  This offers the opportunity to buy what's cheap, sell what's expensive, and profit from the "mean reversion" when rates return to a more normal relationship.  

This is a great example of how we can improve our trading psychology by expanding our understanding and perception of opportunity.

So let's start looking at relative relationships within the stock market.  I went back to 2020 and calculated the difference between the percentage of stocks above their 5-day moving averages within the consumer staples sector minus the percentage of stocks above their 5-day moving averages within the consumer discretionary sector.  These data are readily available on the Barchart.com site.  When investors are expecting growth and a strong economy, they are drawn to the consumer discretionary shares which benefit from consumer spending on things like travel, entertainment, etc.  When investors are expecting economic weakness, they expect that spending on essential staples will continue, while discretionary spending will decline.  By tracking the percentage of stocks in the consumer staples sector above given moving averages minus the percentage of stocks in the consumer discretionary sector, we have a handy economic sentiment measure.

Interestingly, in the quartile of occasions in which the difference between the percentage of stocks above their 5-day moving averages for XLP (staples) minus those for XLY (discretionary) is greatest, the next 20 days of performance in SPY averages only +.42%.  All other occasions average +1.36%.  When investors flee growth relative to stability, that theme tends to continue in the short run.  When we look at the difference between the percentage of stocks above their 20-day moving averages for XLP minus those for XLY, we find a similar pattern 20-50 days ahead.  Forward returns in SPY are subnormal when investors are fleeing to the safety of staples.

The point isn't that you should run to trade this pattern.  The point is that patterns exist where most traders aren't looking.  While the noobs are looking at directional charts, a world of opportunity is being found by the pros in relative space.  When you have more ways to identify opportunity, you build an opportunity mindset.  Better trading leads to better psychology. 

Sunday, June 08, 2025

Understanding Your Best Trading


6/12/2025 - In the research I've conducted re: the personality and life history predictors of trading success, several factors consistently stand out.  One of those is the capacity for pattern recognition.  Successful traders are more curious than others and look at more things in a greater variety of ways.  This enables them to see patterns that, over time, they discover to be meaningful.

Many traders equate pattern recognition with the patterns they track on charts.  This is certainly one form of recognition, but not the type I most commonly see among hedge fund portfolio managers.  They collect a great deal of data on inflation, monetary policies around the world, behaviors of various markets, sentiment, economic growth, etc. and piece the information together to form coherent views of stocks, bonds, currencies, etc.

The identification of market cycles across different periods, as described below, is yet another form of pattern recognition.  I view this as a look from the "bottom up", since it assembles price and volume data across shorter to longer intervals.  In my own trading, I combine this with a "top down" view which looks for historical, statistical patterns in the market.  For example, in the chart above, we can see a cycle bottoming out across the various indicators described below.  At the same time, we had displayed very few stocks making fresh one- and three-month lows in the lead up to this period.  When we look historically, the absence of weakness is quite bullish, especially over a 10-20 trading day horizon.  Markets usually don't plunge until one or more sectors display deterioration.

The combination of the statistical pattern and the real time cyclical pattern produces a trading view with considerable supportive evidence.  That pattern recognition underlies our psychological confidence in our ideas--and our ability to size up positions.  I did not develop confidence in my trading by working on my psychology; I improved my psychology through better and better pattern recognition.

6/11/2025 - Above is a screenshot from yesterday's market in the micro-ES futures contract.  The previous posts in this series will explain much of what I'm tracking in real time.  The bars on the top portion of the chart represent the SPX futures, where the candles capture the high/low/close for each 15,000 contracts traded.  As a result, we're drawing relatively few bars in the overnight sessions and many more during the busier morning hours.  This helps identify market cycles.

The green and red lines going through the candlestick bars are the short-term (red) and longer-term (green) moving averages defined by the MESA Adaptive Moving Average system.  When the red line crosses above the green, it's confirming an uptrending move and vice versa.  Note that I track the identical cycle movements for shorter-term charts (2000 contracts per bar) and longer-term charts (50,000 contracts per bar).  I use the shorter-term crossovers to help trade the longer-term shifts in trend/cycle.

The vertical blue and red lines at the bottom of the chart represent the Woodies CCI trend measures, where blue is uptrending and red is downtrending.  The green and red dots above these lines represent significant buying and selling.  Together, with the adaptive moving average crossovers and across the shorter- and longer-term charts, these help visualize occasions when trends are dying out and reversing and when trending behavior is present.  It is the lining up of these patterns across shorter- and longer periods that identifies opportunities to ride the cycles and exit them.

This way of looking at markets may or may not be helpful for you.  It is my way of distilling a great deal of directional and cyclical behavior across multiple time frames.  What many traders see as "choppy" markets are often markets dominated by shorter-term cycles that are tradeable.  Similarly, what looks like trending markets are often markets dominated by longer-term cycles.  What is important from the perspective of trading psychology is that you find *your* way of representing and visualizing market behavior that aids your decision-making.  Many, many times traders become frustrated with markets and make poor decisions because they are locked into one time period and one type of market behavior and fail to perceive the contexts of market movements.

6/10/2025 - The foundation for cycle identification with the charts denominated in volume rather than time (see below) is the MESA Adaptive Moving Average (MAMA) system developed by John Ehlers.  This creates shorter and longer-term moving averages based upon the cyclicality of the market and then identifies crossovers between the shorter and longer-term averages.  I construct the MAMA on multiple volume-based charts, from very short-term to medium and longer-term.  When there are upside and downside crossovers at multiple intervals, that's when the cycles are lining up and it becomes possible to take a solid reward-to-risk trade.  All of this is easily constructed in the Sierra Chart platform.  I rely on the NYSE TICK measure during NYSE hours to get a more finely grained indication of buying/selling pressure to identify when short-term cycles are turning.  I outline all of this--and will present an illustration--to emphasize an important point in trading psychology:  We are most likely to work on our trading and refine our trading if we develop our own ideas based upon what makes sense to us.  Too often, traders attempt to copy others and then lack conviction to stick with their ideas.  The goal of this post is certainly not for traders to copy what I do, but to encourage traders to figure out what they need to do.         

6/9/2025 - A particular challenge for active, intraday traders is that market activity (volume/volatility) changes significantly as a function of time of day.  On average, there is much more volume and movement in US stock index futures, for example, during the New York Stock Exchange hours than overnight; there is much more volume and movement early and late in the day than at midday.  When we measure cycles in time units, we end up comparing apples and oranges.  If the underlying time series is not relatively stationary/uniform, we cannot identify cycles that are relatively uniform in frequency or magnitude.  When the X-axis of our charts represents volume, not time, each bar is a standard amount of volume traded and we draw more bars during busy periods and fewer during slow periods.  Cycles appear quicker or slower but are more uniform in composition.  When we create charts where the bars represent different volume sizes, we now can see when and how shorter-term cycles line up with longer-term ones.  The shorter-term cycles can guide execution to trade the longer-term cyclical movements.  It becomes easier to trade trends when we see these as the directional portions of longer-term cycles.  Illustrations soon to follow...       

6/8/2025 - What I've come to understand is that no amount of focusing on bad trading and trading mistakes is sufficient to create good trading.  Good trading comes from zeroing in on what you do well and what makes sense to you and then refining and refining your ways of capitalizing on those strengths.  My worst trading comes from focusing on (and chasing) trends.  My best trading comes from identifying cycles in markets and identifying when short, medium, and longer-term cycles are lining up.  Ironically, many of those trades might look like catching trends early, but those trends are simply the early phases of longer-term cycles.  It's the lining up of multiple cycles that creates the favorable reward-to-risk edge.  

Understanding those cycles not only allows for sound entries, but guides the process of holding trades.  If you're oversold across multiple periods and go long, there's little incentive to take profits when the shortest cycle turns to overbought.  Indeed, waiting for the shortest cycle to turn down while the others are still rising and far from their peaks can create opportunities to add to positions.  

The challenge of this approach to trading, which I'll be illustrating in the near future, is that until cycles align, the best trading is no trading.  The goal is to find a few meaningful "setups" and exploit them fully.  One of the most difficult forms of trading discipline can be the discipline to not trade.  That means that the disciplined trader needs the discipline of doing things other than trading during the majority of periods when cycles are not fully aligning.  When you know what to look for, your best trades come to you--and there is no need to chase random moves.   

Sunday, March 03, 2024

Mastering the Positive Psychology of Trading

 
Working on mastering the psychology of trading is different for beginning/developing traders and for experienced traders.  I have worked with rookies at proprietary trading firms, and I have worked with experienced money managers who guide large teams.  The psychological challenges faced by the two groups are entirely different.  What you need to do to master your trading psychology very much depends upon where you are at in your learning curve.

Here is an analogy that might clarify things.  Freud's revolutionary contribution to psychology can be found in his dictum, "Where id was, there ego shall be".  The id represents our basic, primal instincts: our flight and fight tendencies.  When we are triggered by past, unresolved conflicts, we tend to regress to our instinctual mode.  The purpose of psychotherapy is to help a person process their issues and feelings in the medium of a helping relationship.  This enables them to gain perspective on what is truly a threat in the present versus a leftover response from our past.  The heart of Freud's therapy is that we first confront and resolve our conflicts in the here and now context of the helping relationship.  Once we can begin to constructively handle our issues within therapy, we're ready to tackle them in our day to day lives.  Therapy thus replaces the id with the ego:  we replace our flight/fight triggers with rational thought and planning.

The field that has come to be known as positive psychology takes Freud's work to a new direction.  Instead of working on resolving past conflicts and painful repressed experiences, positive psychology has us identifying and building our unique, distinctive strengths.  For example, I might experience a loss of motivation at work and my performance might suffer.  A traditional therapist might have me explore conflicts about my work and with my colleagues.  Resolving hidden problems in the workplace could help me regain my motivation.  The therapist addressing my situation from the perspective of positive psychology might help me understand the positives that I need in my life and that might be missing on the job.  For example, if one of my basic strengths is intellectual curiosity, I might need to address my situation by changing how I interact with my team at work--or perhaps I need to find different work.

So now we can appreciate the difference in psychology between beginning and advanced traders.  Beginning traders, unaccustomed to ever-changing, volatile markets, find themselves coping with their flight/fight stress responses and the ways in which those color trading decisions.  Experienced traders, on the other hand, find that their greatest challenges occur when they do not adequately cultivate and utilize their strengths.  For example, where the rookie might respond to volatile action in a stock with decisions based on FOMO, the experienced trader might be challenged by finding the best risk/reward expressions of their trade ideas.  

For the experienced trader, a key to trading success is knowing what speaks to you and what you're truly good at.  You cannot play to your strengths if you aren't intimately familiar with what those strengths are.  Working on correcting weaknesses only gets you so far.  Eventually, if you're going to progress from competency to expertise, you need to master your own positive psychology.  

An obstacle I've faced in my own trading is that I simply become bored with following markets and I stop trading.  Creativity and learning are my two greatest strengths, and I lose motivation when I'm not discovering and doing new things.  The common wisdom of trading psychologists is to turn everything you do into reliable, repeatable processes.  That is precisely what bores me.  If trading begins to feel like an assembly line, I start to feel trapped in a rote, routine job.  To keep trading fresh and exciting, I need to do the same thing that I do in my marriage and in my personal life:  find new challenges and new opportunities and always, always devote some portion of my time to innovation.  

I recently wrote on the topic of finding different sources of trading edge.  I also wrote on the topic of developing resilience as a trader.  The two topics are intimately connected--for me, and for many people I work with.  What keeps us going during the inevitable drawdowns is that we're continually learning, continually discovering, continually moving forward.  Doing new things keeps us psychologically fresh.

Earlier today, I began analyzing a new dataset.  I looked at market breadth broken down sector by sector.  Interestingly, over the last few years, when breadth strength in the consumer staples (XLP) sector has greatly exceeded breadth strength among the consumer discretionary stocks (XLY), the next 10 to 20-day returns in the overall market (SPY) have been significantly above average.  This finding has set off a flurry of queries into various sector rotations and how those might act as meaningful measures of market sentiment.  New data, new patterns, new trading opportunities, new motivation and drive, new games to play and win.

We master the positive psychology of trading by drawing consistently upon our own positives and expanding those.  I believe this is the single greatest frontier in the field of trading psychology.  More to come!

Further Reading:

Should High Achieving Traders Seek a Balanced Life?

Therapies for the Mentally Well:  Proven Techniques for Building Your Positive Psychology

Radical Renewal:  Tools for Leading a Meaningful Life

.    

Sunday, March 26, 2023

Understanding Market Themes From Sector Breadth


For years, I have kept breadth data on the overall stock market, tracking shares making fresh highs and lows over various periods and the percentages of stocks trading above their short, medium, and longer-term moving averages.  What I've found is that shifts in breadth often precede shifts in overall market direction.  This is because certain parts of the market will break down or rebound ahead of the market averages.  Conversely, during trending moves, we will see the great majority of shares participate in market rises or declines.  The breadth extremes are an excellent alert for overall market momentum.

This is a good example of how trading psychology is about the market's psychology, not just about our personal emotions and behaviors.  Breadth data are helpful in tracking changes in the sentiment of market participants.  

Recently, I have built out spreadsheets that track breadth on a sector by sector basis, as well as breadth for various factors such as small cap vs. large cap and growth vs. value.  The idea is that the patterning of breadth changes among the sectors helps us track market themes.  

So let's take an example from the recent market (data from the excellent Barchart site):

In the last two trading sessions of the past week, the overall SPX moved higher by almost 1%.  Overall short-term breadth (stocks trading above their five-day moving averages), rose from about 26% to about 45%.  Interestingly, over that same time, the same breadth for consumer discretionary stocks went from about 20% to 25%.  The breadth for consumer staples shares went from 27% to 85%.  The breadth of energy stocks went from 61% to 22%; the breadth of financial shares went from 25% to 17% and the breadth of utility stocks rose from 0% to 73%.  

This tells us several important things:

1)  The move higher has not been a broad trending move.  It is quite mixed.

2)  The move higher has benefited more defensive sectors (consumer staples, utilities) and not sectors that reflect economic growth (consumer discretionary, energy).

3)  The recent reassurances regarding the banking sector of the economy have not yet pushed financial shares meaningfully higher.

When we couple the pattern of market breadth with the movement of interest rates (lower), we again see defensive buying (bonds).  Interestingly, large cap tech stocks have similarly acted as a relative safe haven, with breadth over the past two sessions moving from 26% to 54%.

The bottom line is that the patterning of breadth reflects a defensive market with lower rates, suggesting concerns regarding recession.  In tracking breadth going forward, I will want to see if the recessionary hypothesis/theme gains traction or reverses.  The shifts in the patterning of breadth among equities, as well as the shifts among asset classes and geographic regions, allow us to update our forecasts for markets and economies.  This enables us to be open-minded and flexible, even as we assertively pursue themes in play.

Further Reading:

.

Monday, September 06, 2021

How We Can Improve Our Access To Intuition


The heart of discretionary trading is pattern recognition.  Some traders track patterns in fundamental data; some follow price and volume behavior; some attempt to quantify patterns in sentiment and breadth data; some focus on patterns that follow events, such as earnings releases.  When we have experienced many examples of patterns, we internalize them and develop a "feel" for their occurrence.  It is that feel that we call intuition.

In the Radical Renewal blog book, I raise the issue of how our egos impact our trading.  What is ego?  It is our self-talk.  Whenever we focus on hopes, fears, frustrations, and needs, we end up talking to our selves about ourselves.  Such self-talk can be useful in planning and thinking through issues.  We need our egos to navigate the world and accomplish things.

The problem occurs when our self-talk becomes so loud that it drowns out our intuition, our feel for patterns.  There is no way we can be sensitive to patterns in what a market is doing if we're raging to ourselves about the need to make money, the fear of losing, or the fear of missing out.  If intuition is the whisper of the soul, self-talk is the shout of the ego.  Often, we lose our feel for what we're doing as we become most self-focused.  This happens in all areas of life, not just trading.  

Many self-help and coaching techniques simply substitute one kind of self-talk for another.  Filling our minds with positive talk might feel better than burying ourselves in worries, but both lead to clutter that drowns out the whisper of intuition.  What we need is a quiet and open mind so that we can amplify the whisper into a clear and consistent voice.  This is why many traders find meditation helpful:  in controlling and quieting the body, we can focus the mind and let patterns speak to us. 

One exercise that I have found remarkably effective in quieting the mind and improving access to intuitive knowing is simply to take a brisk walk very early in the morning.  The streets where I live are completely quiet and the air is often cool and refreshing.  During the walk, I focus my attention on all that I see and look for the beauty in my surroundings:  an attractive house, colorful flowers, a cute squirrel, the morning sky.  My mindset is one of appreciation and gratitude, focusing on all that I am privileged to be surrounded by.  I don't think about my work and the day ahead; I don't think about what happened the day before.  The mindset is entirely focused on the present.

Think about how many trading problems occur because we are not simply present in the present.  We are caught up in what just happened and we become focused on what might happen.  We talk, talk, talk to ourselves and never reach the quiet state where we can simply listen.  We become masters of intuition when we can operate continuously with a focused, open mind.  This is a strength that can be exercised and developed:  the simplest walk can help us turn the soul's whisper into a reliable voice. 

Further Reading:


.

Wednesday, May 19, 2021

Short-Term Trading With The NYSE TICK - Part Two

 
In the first post in this series, we took a look at the NYSE TICK and how it measures the moment to moment sentiment in the overall market.  We also took a look at a pattern with edge, where buying pressure in the market cannot take prices higher.  Eventually, those buyers are forced out of their positions when sellers come in and that takes the market lower.  That pattern played out nicely in yesterday afternoon's market, which we see depicted above.  My cycle work was looking toppy and I tried to enter short positions in the market three times in the morning only to get stopped out with small losses.  Then I saw the TICK pattern play out in the afternoon and left the short position to run, more than making up for the losses, particularly given the overnight action.  One takeaway is that our best trades occur when the longer time frame picture and the shorter term market behavior line up.  It pays to be patient and wait for that alignment.

In the chart above, the yellow horizontal line represents the zero TICK level and the blue arrows show where net buying (where the moving average line of TICK is above zero) cannot produce price highs.  The longer that pattern plays out, on average, the more longs are trapped and end up needing to cover, creating a meaningful move to the downside, which we see play out with the very negative TICK readings late in the afternoon.  A good idea doesn't become a good trade unless we see traders trapped going the wrong way and needing to exit positions.

In the third post in this series, we'll look at the TICK in a different configuration and how it can provide upside edge.

Further Reading:


.

Friday, May 14, 2021

Short-Term Trading With The NYSE TICK - Part One

 
So much of intraday trading boils down to pattern recognition.  When you view market activity day after day, year after year, you internalize patterns that recur.  Those can provide a meaningful edge in trading.

As long-term TraderFeed readers know, one of my favorite market indicators is the NYSE TICK (shown above; $TICK on most platforms).  The TICK is updated many times per minute and captures the number of stocks in the NYSE universe trading on upticks minus the number trading on downticks at every moment.  So we can think of the TICK as a moment to moment measure of trader sentiment across the market.  It tells us what traders are actually doing in the market, which is an important clue as to the psychology of the marketplace.  Trading psychology is not just about our own psychology; it's about understanding the psychology of those we're competing with.  We can pick up tells in the market just as we can at a poker table.  

If you click on the chart above (taken from my Sierra Chart screen), a one-minute chart of the NYSE TICK (above) and SPY (below), you'll see patterns noted by the arrows.  The yellow arrows show us occasions where there is increased buying pressure that is unable to move the market to new highs.  Those buyers will be trapped and will have to exit, fueling the next downleg.  The blue arrows show the market basing and selling pressure drying up, with higher TICK lows.  This led to a nice upleg.

Knowing if buyers or sellers are dominant (do we see net positive or negative TICK) and how well the buyers and sellers can move the market is very helpful information.  We want to see who is in control of price action and who is trapped.  In upcoming posts, I'll expand upon this edge.  The key is seeing enough patterns over time that you can recognize them in real time and act upon them.  It's amazing how you don't have to worry about your own psychology when you understand the psychology of the marketplace.

Further Reading:


.

Sunday, April 04, 2021

What Is Market Breadth Telling Us?

 
A few weeks back, I posted re: market sentiment and noted that sellers were notably unable to push the market lower.  That situation led to a nice rise to new highs in SPY/ES.  Now we see a very different situation.  On Thursday, we broke the 4000 level in SPX, but interestingly, we had 334 stocks registering fresh monthly highs and 75 making new monthly lows.  Compare that with over 1000 stocks making new monthly highs in mid-March.  In early February, we had over 1100 stocks hitting new 3-month highs.  That fell to 939 in mid-March and hit a level of 171 on Thursday.  (Data from Barchart.com).  In other words, the recent market uptrend has become much more selective.  If we look at small cap stocks recently and technology shares, for example, both have failed to take out prior highs.  Indeed, overall, it's been larger cap issues rather than growth names that have performed best of late.

There is a structure to market cycles, in which the market begins with strong upside momentum and a tide that lifts most boats.  As the cycle matures, the strength becomes more selective and we can even observe pockets of the market register new short-term lows.  With the inability to rise and many traders/investors trapped on the long side, we get a move for the exits and a momentum period of decline, with many stocks making new short-term lows.  A dramatic example of this occurred early in 2020, when the market registered 751 new 3-month highs on January 17th and then hit a new index high on February 19th with 503 fresh 3-month highs.  What followed was the big decline from the COVID outbreak.

The current breadth weakness in no way predicts a similar decline for the near future.  Rather, it is a yellow caution light for the bulls.  The market is behaving as it often behaves relatively late in bull market cycles.  I am watching breadth closely to see if the bullish sentiment of hitting 4000 might be masking increasing weakness, particularly among the "reopening" and growth stocks that one would expect to be leading the way higher.

Further Reading:


.

Friday, March 12, 2021

Tracking Sentiment And Market Impact


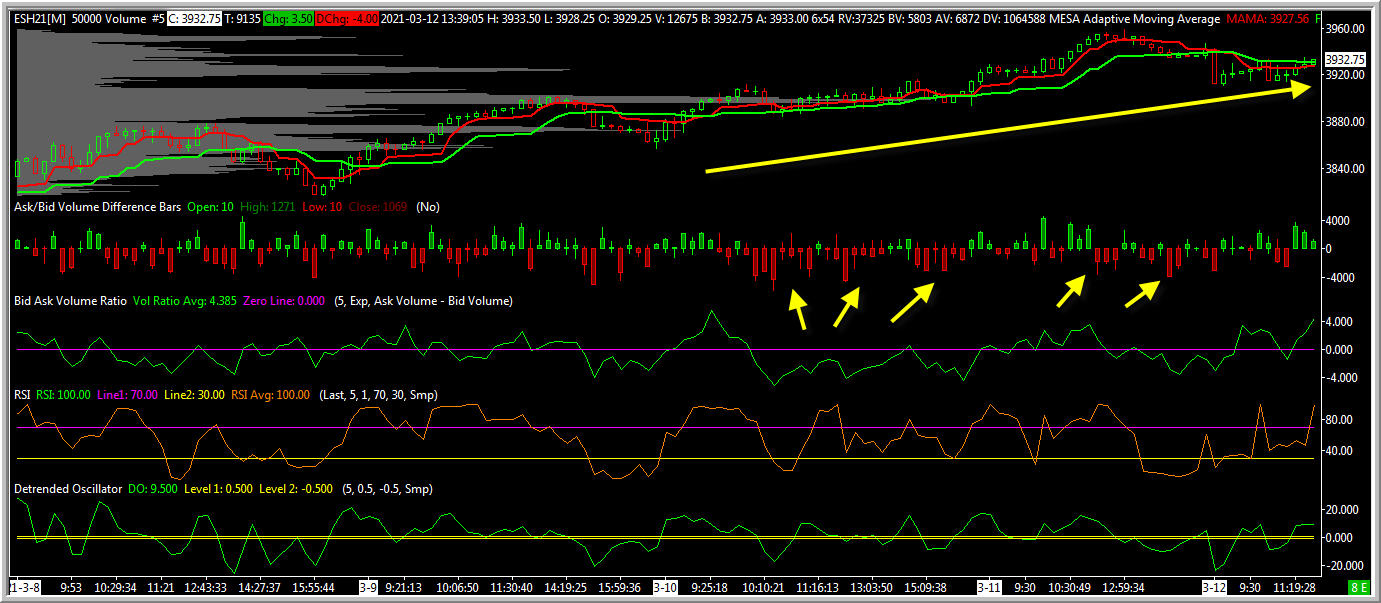
If you click on the chart above, you can see one thing I was tracking in the afternoon of Friday, March 12th.  (Data and chart from Sierra Chart).  In the top panel, we see the futures market for the S&) 500 Index (ES), where each bar represents 50,000 contracts traded.  The second panel shows the proportion of volume during each 50,000 contract period that was transacted at the offer price (green color) vs. the bid price (red color).  What we see with the yellow arrows is that the trend of ES continues higher, but there has been recent hitting of bids during the recent period.  In other words, sellers have been more aggressive lately, but they have been unable to push price meaningfully lower.  That has kept me long the market, with a tilt toward large cap value, which has been outperforming the NASDAQ tech names.  

Knowing the sentiment of the market through tracking which side is more aggressive and then seeing how this is impacting price action provide a helpful perspective on the market.  In this case, it has kept me in my position despite some price pullback and opens the door to my adding to the position should I see fresh lifting of offers taking price higher.

The most recent Three Minute Trading Coach video describes two ways of improving our trading that also improves our trading psychology.  The overarching point is that trading well--and grounding ourselves in market data that we have studied and reviewed so often that we have confidence in their value--is one of the best ways of improving our mindset.  If we are patient enough to wait for those occasions when we truly understand what is going on, that understanding provides us with the security to take proper risk in the idea.  Working on your trading ultimately *is* working on your head.  Understanding the psychology of other market participants is excellent grounding for your own psychology.

Further Resources:


.

Sunday, December 27, 2020

What Distinguishes Professionals From Amateurs

 
I see some traders tackle markets for years and never achieve even basic competence.  Then I work with others that achieve unusual success in their first years.  What makes the difference?  Yes, work ethic and skill/talent sets matter quite a bit, but what increasingly hits me between the eyes is the difference in the learning process between amateurs and developing pros.  Here are two of those differences that make a difference:

1)  Professionals keep score - Can you imagine a weightlifter who doesn't track how much they're lifting, how many reps they're doing, which muscle groups they're working, how much body mass they're adding?  Conversely, consider the golfer who uses sensors and apps to track their golf swings, identifying details of what they're doing right and wrong on various courses and holes.  Pro basketball teams review game film in agonizing detail; amateurs leave the game behind once they leave the court.  In trading, we can easily keep score, with performance stats ranging from how much heat we take on a trade to how much we make and lose for various types of trades.  What amazes me is that, when traders keep score, they learn about strengths and weaknesses in ways that they do not when they just review their weekly or monthly P/L.  As I recently shared in my article on building your personal process, I have been using the Fitbit Sense and MuseS units to track my sleep, exercise, stress levels, focus, and much more.  To my surprise, I might think that I'm calm and focused, but all the data sometimes tell me otherwise!  By constructing daily exercises and keeping score, I'm getting better and better at my own trading psychology.  If a psychologist needs to keep score to improve mindset, the odds are pretty good that most of us could benefit.  :)

A couple of tools for tracking performance and keeping score are TraderVue and Edgewonk.  What I find with the successful developing SMB traders is that how they use such tools makes all the difference.  When the score keeping leads to small, steady, consistent improvements in trading, the result is an amazing improvement in trading consistency.  Once that consistency is achieved, sizing can be increased without undue downside exposure.  The traders that simply track P/L and state global goals ("I need to eliminate my overtrading") simply do not make the detailed improvements that lead to consistency.

2)  Professionals emphasize logistics - An amateur plans a surprise attack on the enemy; a pro works out the details of how troop movements will be hidden, how to deliver timely air support, where to achieve quickest exit from the battle area, etc.  Similarly, amateurs talk about "setups".  Professionals identify precise ways to gauge real time price movement shiftsorder flow and sentiment to achieve superior reward relative to risk.  Professionals have different ways to trade different kinds of markets; amateurs approach the market with a one-size-fits-all mentality.  Tools such as Market Profile (volume traded at each price level and the distribution over time); Delta (volume traded at market offer and bid prices through the day); and anchored Volume-Weighted Average Price enable traders to take good ideas and turn them into great trades.  Brian Shannon's work on tracking opportunity across multiple time frames is an excellent example of how logistics make the difference between a successful tactic and an unsuccessful one.  Mike Bellafiore's work on "playbooks" also illustrates how work on trading logistics can become part of a robust trading process.

There will always be "gurus" who want to tell you that there are easy ways to make money in markets or that success can be found in chart patterns or mindsets.  The simple truth is that if the majority of traders pursued *any* performance field without keeping score and building logistics, they would fail.  Every professional starts as an amateur.  It's how they work on their craft that makes all the difference.

As we count down the wild year of 2020, I would like to wish all readers a happy, healthy, and successful 2021.  With fewer but more in-depth blog posts and Forbes articles and trading coach videos to support the ideas, my hope is to provide traders with the largest repository of free trading psychology materials in the world.  The great traders don't have a passion for trading; they have a deep and sustained passion for self-improvement.  Markets are simply the canvas upon which they paint their masterpiece.

Further Resources:


.      

Thursday, April 23, 2020

Your Trading Edge Is *Inside* The Bars On Your Chart

In the last post, I explained where true short-term trading edges in the market can be found.  I used as an example the Delta indicator that tracks the proportion of transactions that occur at the market offer price versus the amount of volume that is hitting bids.  I also included a link in that post that directs you to software platforms where you can get the Delta data.

In this post, we'll look at a somewhat similar indicator, the NYSE TICK.  It is found on many charting platforms as $TICK.  It tracks the number of stocks at any time trading on upticks versus trading on downticks.  The chart above is from Sierra Chart, and I've used $TICK on e-Signal and other platforms that carry a full feed from NYSE.  I like Sierra, because of the availability of TICK calculations specific to Standard and Poor's 500 stocks, Russell 2000 stocks, etc.  

The important point is that both Delta and TICK are calculated transaction by transaction.  As Trevor Harnett has observed, they are telling you what is happening inside the market bars.  That is where important edges can be found.

There are many sources of edge to be found in the TICK numbers.  As noted above, what they tell us is, at every moment, how many stocks are trading on upticks minus the number trading on downticks.  That tells us, in real time, where we have buying pressure and selling pressure, and it tells us if that buying or selling pressure is increasing or decreasing.  We can also use a moving average of TICK values to serve as a short-term overbought/oversold measure, and we can use a cumulative total of TICK values to track the trend of buying or selling and identify bigger picture trading opportunities.

Above is a snapshot from yesterday's market.  The top panel is the NYSE TICK on a one-minute basis.  I drew a yellow horizontal line at the zero level.  The green line going through the NYSE TICK bars is a 15 period exponential moving average of TICK values.  Where I've drawn yellow arrows are spots where price of SPY (bottom panel) has made a fresh high or low, but TICK values have dried up.  That has led to short-term price reversals.  Those TICK divergences can mark useful trading opportunities.  Extremes of TICK can also alert us to the possibility of trend days in the market.  Important changes in market direction are often accompanied by shifts in the distribution of NYSE TICK values.

It's the transaction-by-transaction data that reveal the psychology/sentiment of other traders in the market.  If we look at those data in real time, we can see sentiment shifting and quickly jump on board those moves.  Studying Delta and TICK patterns day by day gives you a sense of pattern recognition to trade the market's psychology with deeper insight and greater confidence.

Further Reading:

.

Wednesday, April 08, 2020

Real Time Market Sentiment And Why It Matters

Just thought I'd share this screen shot with you of the market this morning.  Once again we see the pattern that I had shared earlier in the blog:  selling pressure (amount of volume transacted at the market bid price for ES; middle panel, red bars) versus buying pressure (amount of volume transacted at the market offer price; green bars) and how that selling pressure has been unable to move price to new lows (arrows).  (Data from Sierra Chart).  This has set up on multiple scales (shorter and longer term) and has been a reliable pattern during the recent market volatility.  I'll be discussing this in greater detail during my Traders4ACause presentation with Mike Bellafiore this coming Saturday at 9 AM Eastern.  

The location of where volume is transacted tells us something about real time market sentiment (urgency of buying and selling).  The specific prices where we see strong sentiment tells us something about price levels that traders find important.  In my quant work, I find the correlation between volume at offer vs. bid to be correlated with price change by approximately .41.  That tells us that these are not different versions of the same variable, though they are clearly related.  I've found that, once we take price change out of the sentiment equation, the volume at bid/offer adds predictive value to trading models.  In short, real time sentiment matters because it captures the intentions of larger market participants.

It's yet another example of how looking at market information in new ways can help us achieve fresh insights.  If we only look at the things others look at, we'll see what they see.  That's not a formula for unique and exceptional returns.

Further Reading:

.