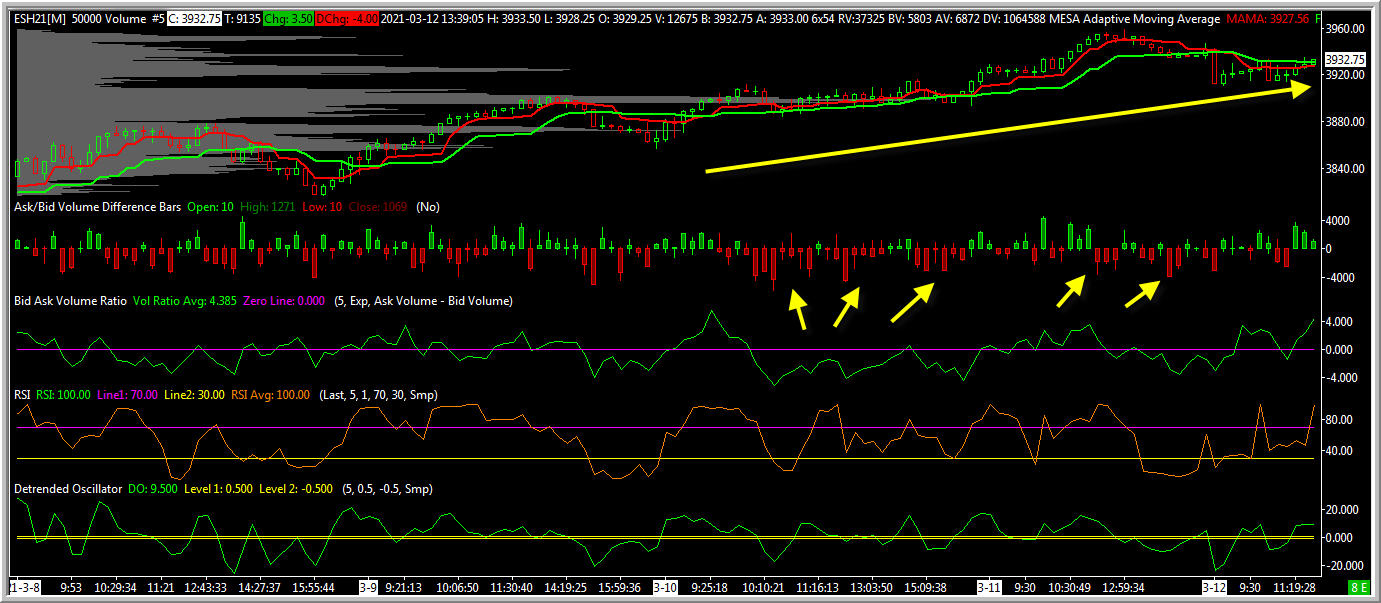
If you click on the chart above, you can see one thing I was tracking in the afternoon of Friday, March 12th. (Data and chart from Sierra Chart). In the top panel, we see the futures market for the S&) 500 Index (ES), where each bar represents 50,000 contracts traded. The second panel shows the proportion of volume during each 50,000 contract period that was transacted at the offer price (green color) vs. the bid price (red color). What we see with the yellow arrows is that the trend of ES continues higher, but there has been recent hitting of bids during the recent period. In other words, sellers have been more aggressive lately, but they have been unable to push price meaningfully lower. That has kept me long the market, with a tilt toward large cap value, which has been outperforming the NASDAQ tech names.
Knowing the sentiment of the market through tracking which side is more aggressive and then seeing how this is impacting price action provide a helpful perspective on the market. In this case, it has kept me in my position despite some price pullback and opens the door to my adding to the position should I see fresh lifting of offers taking price higher.
The most recent Three Minute Trading Coach video describes two ways of improving our trading that also improves our trading psychology. The overarching point is that trading well--and grounding ourselves in market data that we have studied and reviewed so often that we have confidence in their value--is one of the best ways of improving our mindset. If we are patient enough to wait for those occasions when we truly understand what is going on, that understanding provides us with the security to take proper risk in the idea. Working on your trading ultimately *is* working on your head. Understanding the psychology of other market participants is excellent grounding for your own psychology.
Further Resources:
.


