
Yesterday we saw that slow, narrow days lead to unfavorable expectations over the near term. Sure enough, today we saw a late drop today that could turn into a broad momentum decline tomorrow. A broad momentum decline, as I'm defining it, is one in which 500 or more stocks are displaying strong downward momentum as compared with upward momentum. Momentum is measured by a price close above or below a volatility band surrounding the stock's short-term moving average. All stocks in the NYSE and NASDAQ are included. When 500 or more stocks are closing below their envelopes than above, you have a large number of issues that are very weak in the near term.
Since March, 2003 (N = 724), we have had 42 broad momentum decline days. Two days later in SPY, the market was down by an average of -.11% (16 up, 26 down). After declining market days that did not show broad market declines (N = 271), the market was up two days later by an average of .18% (158 up, 113 down). What this suggests is that markets that fall without broad momentum tend to reverse in the short run, but markets with broad momentum declines tend to continue their weakness near term. This strikes me as a pattern worth exploring over a variety of time frames. If tomorrow turns out to be a broad momentum decline, we'd expect greater near-term weakness thereafter than if selling tomorrow is more modest.
Tuesday, January 31, 2006
Monday, January 30, 2006
Slow, Narrow Days: What Next?
Monday was a very narrow range, slow day in SPY. Volume was approximately 60% of the 60-day average volume and the entire range for the day was only .36%. What tends to happen after such narrow, slow days?
First off, it's interesting to note that SPY volume as a % of 60-day volume correlates .51 with the daily trading range. Monitoring SPY volume in real time is an excellent way of handicapping the likely volume for the day. Seeing that volumes were running well below the normal volume for the relevant period alerted one to take profits quickly and to expect a range bound trade.
Since March, 2003 (N = 728), we've had 30 days in which the SPY range has been less than or equal to .50% and the volume has been 70% or less of the 60-day average. The average change three days later is -.43% (8 up, 22 down), much worse than the three-day average change of .19% (430 up, 298 down) for the sample overall. It appears that low volume and low volatility do not bode well for the bulls in the near term. The ratio of down to up occasions following the slow, narrow days is quite striking.
First off, it's interesting to note that SPY volume as a % of 60-day volume correlates .51 with the daily trading range. Monitoring SPY volume in real time is an excellent way of handicapping the likely volume for the day. Seeing that volumes were running well below the normal volume for the relevant period alerted one to take profits quickly and to expect a range bound trade.
Since March, 2003 (N = 728), we've had 30 days in which the SPY range has been less than or equal to .50% and the volume has been 70% or less of the 60-day average. The average change three days later is -.43% (8 up, 22 down), much worse than the three-day average change of .19% (430 up, 298 down) for the sample overall. It appears that low volume and low volatility do not bode well for the bulls in the near term. The ratio of down to up occasions following the slow, narrow days is quite striking.


Sunday, January 29, 2006
Falling Markets and Stocks Making New Lows
 This poster graces my office, thanks to Despair.com.
Yesterday's entry found that there was greater follow through to the upside when rises in SPY were accompanied by an expansion in the number of stocks making fresh 20-day highs. Today we look at days in which SPY declines to see if the number of new lows makes a difference.
Since January, 2003, we have had 334 declining days in SPY. When those declines have been accompanied by an increase in the number of stocks registering fresh 20-day lows (N = 249), the average gain in SPY over the next two days has been .08% (133 up, 116 down). When declines in SPY have not been accompanied by an expansion in new lows (N = 85), the next two days in SPY have averaged a gain of .25% (48 up, 37 down).
When there is broad participation to the upside during market rises, there is usually room for further upside. When there is not broad participation to the downside during market declines, there tends to be reversal of the weakness. These are relationships that may well hold over other time frames as well.
Saturday, January 28, 2006
Rising Markets and Stocks Making New Highs
If you've followed the Trading Psychology Weblog, you know I place great emphasis upon whether or not rising markets expand the number of stocks making fresh short-term highs (and vice versa). Rises in ES that do not expand new highs and declines that do not expand new lows are, in my testing, more likely to reverse than rises and falls that are accompanied by broad participation across market sectors.
Going back to January, 2003, I found 419 days in which the S&P 500 Index (SPY) was up on the day. Of these, 229 displayed an expansion in the number of NYSE, NASDAQ, and AMEX stocks making new 20 day highs. Three days later, SPY was up by an average of .20% (136 up, 93 down). When the rises in SPY were not accompanied by an expansion of 20 day highs, SPY over the next three days averaged a gain of only .02% (103 up, 87 down).
It will be interesting to study this relationship over different time frames, intraday as well as longer term. In general, it appears that upside moves are more likely to continue higher if they carry a majority of issues to fresh new highs. When this doesn't happen, it suggests that many stock sectors are not participating in the rise, setting up subnormal near term returns.
Going back to January, 2003, I found 419 days in which the S&P 500 Index (SPY) was up on the day. Of these, 229 displayed an expansion in the number of NYSE, NASDAQ, and AMEX stocks making new 20 day highs. Three days later, SPY was up by an average of .20% (136 up, 93 down). When the rises in SPY were not accompanied by an expansion of 20 day highs, SPY over the next three days averaged a gain of only .02% (103 up, 87 down).
It will be interesting to study this relationship over different time frames, intraday as well as longer term. In general, it appears that upside moves are more likely to continue higher if they carry a majority of issues to fresh new highs. When this doesn't happen, it suggests that many stock sectors are not participating in the rise, setting up subnormal near term returns.
Friday, January 27, 2006
When Big Caps Outpace Small Caps
Yesterday's entry looked at occasions when small caps outperform large caps on the upside and found that such a scenario leads to short-term strength in the S&P, which indeed proved to be the case on Friday. Friday's rise, however, was notable in that the gain in the S&P (SPY) was almost twice the size of the gain in the Russell 2000 Index (IWM): .93% vs. .50%.
I examined occasions in which SPY was up more than .50% on a one-day basis, and then broke down those occasions based upon the performance of IWM. In general, since January, 2003 (N = 771), there have been 202 days in which SPY has been up more than .50%. Two days later, SPY has averaged a loss of -.04% (96 up, 106 down)--weaker than the average two-day gain of .14% for the remainder of the sample (316 up, 253 down). This fits the pattern noted often in this blog: strength leads to near-term weakness and vice versa.
When SPY is up by more than .50% in a single day and outperforms IWM (N = 66), the next three days average a loss of -.08% (29 up, 37 down). When IWM outperforms the strong SPY, the next three days average a gain of .14% (85 up, 51 down). It thus appears that underperformance by IWM worsens the subnormal returns that tend to follow strong market days. When IWM outperforms SPY, strength is more likely to lead to further strength. When SPY outperforms the small caps, strength is more likely to be reversed.
I examined occasions in which SPY was up more than .50% on a one-day basis, and then broke down those occasions based upon the performance of IWM. In general, since January, 2003 (N = 771), there have been 202 days in which SPY has been up more than .50%. Two days later, SPY has averaged a loss of -.04% (96 up, 106 down)--weaker than the average two-day gain of .14% for the remainder of the sample (316 up, 253 down). This fits the pattern noted often in this blog: strength leads to near-term weakness and vice versa.
When SPY is up by more than .50% in a single day and outperforms IWM (N = 66), the next three days average a loss of -.08% (29 up, 37 down). When IWM outperforms the strong SPY, the next three days average a gain of .14% (85 up, 51 down). It thus appears that underperformance by IWM worsens the subnormal returns that tend to follow strong market days. When IWM outperforms SPY, strength is more likely to lead to further strength. When SPY outperforms the small caps, strength is more likely to be reversed.
Thursday, January 26, 2006
Do Small Cap Stocks Lead the S&P?
A couple of readers suggested that I take a look at what happens with the S&P market as a function of strength in the small cap (Russell) stocks, given the recent outperformance of those small caps. I recently sent off an article to the Trading Markets site that should appear Friday AM that will present one facet of this issue. In this analysis, I focus on markets since January, 2003 (N = 768) in which the Russell is up on a one, two, and three day basis, with the three-day gain exceeding 2% (N = 130).
Three days later, the S&P is up by an average of .45% (87 up, 43 down), much stronger than the three-day average gain of .07% for the remainder of the sample (358 up, 280 down). A strong Russell, such as we've had lately, has led to near-term large cap stock strength. In this context, it does appear that small stocks do lead large ones during strong moves. This may be because small stocks tend to be more volatile and thus will outperform during bullish trending markets.
Three days later, the S&P is up by an average of .45% (87 up, 43 down), much stronger than the three-day average gain of .07% for the remainder of the sample (358 up, 280 down). A strong Russell, such as we've had lately, has led to near-term large cap stock strength. In this context, it does appear that small stocks do lead large ones during strong moves. This may be because small stocks tend to be more volatile and thus will outperform during bullish trending markets.
Wednesday, January 25, 2006
Range Bound Volatile Day
How much territory does a market cover in a day? I decided to add up all the one minute ranges in ES from 11/1/05 - present (N = 57 days). It turns out that the average total movement of the ES per day is 217 points, with an average daily range of 9.9 points. Today, the market traveled a total of 304 points, the second highest total in the sample. The only higher day was Friday's big move down, which came in at 307 points. Friday's range, however, was 23.75 points--fully 10 more points than yesterday's range. Friday was a volatile trend day, but today was a volatile, non-trending day. Indeed, when we look at past days with an approximate 13 point range, the average number of points traveled is under 230--well below today's total. I could only find three days in the sample in which we had a somewhat similar configuration of a moderately wide range and very large movement within that range. All three led to a relatively non-volatile market the following day, with ranges below 10 points.
This will bear further study. What we're seeing is that volatility--as defined by total range during a day is not the same as volatility defined as the total movement within that day. Although the two correlate highly--about .60--it means that only 36% of the variance in a day's range is accounted for by the size of minute-to-minute movement. High volatility range bound days may not have the same expectations as high volatility trend days, both with respect to directional follow through and carry over of volatility. My initial findings suggest that institutional participation is higher during the trend days, creating greater price and volatility persistence. I hope to post further results in the near future.
This will bear further study. What we're seeing is that volatility--as defined by total range during a day is not the same as volatility defined as the total movement within that day. Although the two correlate highly--about .60--it means that only 36% of the variance in a day's range is accounted for by the size of minute-to-minute movement. High volatility range bound days may not have the same expectations as high volatility trend days, both with respect to directional follow through and carry over of volatility. My initial findings suggest that institutional participation is higher during the trend days, creating greater price and volatility persistence. I hope to post further results in the near future.
Tuesday, January 24, 2006
Is Google a Bellwether?
Note: My personal site will be adding additional information re: my volatility research and will be updating over the next few days.
Google's dramatic decline on Friday was followed by two solid gains on Monday and Tuesday, leaving GOOG up over 10% thus far this week. That led me to ask the question: How good of a bellwether is GOOG when it is up or down sharply in the short-term?
Going back to August, 2004 (N = 353), we find 30 days in which GOOG has shown a gain of over 5% in a two day period. Three days later, the S&P 500 Index (SPY) is up by an average .56% (20 up, 10 down). This is quite a bit better than the average two-day gain of .12% (206 up, 147 down) for the sample overall.
I also found 21 days in which GOOG was down by 4% or more over a two-day period. Five days later, SPY was up by an average .96%, with an amazing 19 occasions up, 2 down. This is quite a bit better than the average five-day change of .20% (208 up, 145 down) for the sample overall.
Interestingly, the near-term outlook is good for SPY when GOOG is very strong and when it's very weak. Score this one for the bulls with respect to the current market. (Note: Other factors lead me to be concerned about the present market's upside potential; I will outline those on my site tonight). When GOOG is strong, it means that the market's speculative sentiment is alive, and that carries over to near-term market trade. When GOOG sells off strongly, speculative froth is exiting the marketplace, and that puts in a short-term market bottom. Such may have been the case on Friday.
Of course, all speculative leaders end up eventually becoming laggards, so these patterns can't continue forever. In this bull market so far, however, GOOG has been a worthy bellwether.
Keep an eye on the Trading Markets site: I hope to extend the GOOG research in an article.
Google's dramatic decline on Friday was followed by two solid gains on Monday and Tuesday, leaving GOOG up over 10% thus far this week. That led me to ask the question: How good of a bellwether is GOOG when it is up or down sharply in the short-term?
Going back to August, 2004 (N = 353), we find 30 days in which GOOG has shown a gain of over 5% in a two day period. Three days later, the S&P 500 Index (SPY) is up by an average .56% (20 up, 10 down). This is quite a bit better than the average two-day gain of .12% (206 up, 147 down) for the sample overall.
I also found 21 days in which GOOG was down by 4% or more over a two-day period. Five days later, SPY was up by an average .96%, with an amazing 19 occasions up, 2 down. This is quite a bit better than the average five-day change of .20% (208 up, 145 down) for the sample overall.
Interestingly, the near-term outlook is good for SPY when GOOG is very strong and when it's very weak. Score this one for the bulls with respect to the current market. (Note: Other factors lead me to be concerned about the present market's upside potential; I will outline those on my site tonight). When GOOG is strong, it means that the market's speculative sentiment is alive, and that carries over to near-term market trade. When GOOG sells off strongly, speculative froth is exiting the marketplace, and that puts in a short-term market bottom. Such may have been the case on Friday.
Of course, all speculative leaders end up eventually becoming laggards, so these patterns can't continue forever. In this bull market so far, however, GOOG has been a worthy bellwether.
Keep an eye on the Trading Markets site: I hope to extend the GOOG research in an article.
Monday, January 23, 2006
Narrow Bounce After a Big Decline: A Rare Occurrence

I couldn't wait to add this to the blog. Check my personal site tomorrow for details. This is a measure of institutional presence in the market that updates every 20 seconds. It correlates with daily price range by .45 since the beginning of January. Now the question is whether institutional involvement during period X will predict volatility in period Y. Stay tuned...this is getting fun.
I have received a number of email inquiries regarding indicators for assessing the likely volatility of the coming day's trade. I will post something to my personal site shortly on this topic. Obviously such information is invaluable on days such as Monday, when all indications from Friday pointed to likely volatility. When we saw the narrow overnight range, however, followed by mediocre volume in the ES, it became clear that this was not going to be a breakout day. Being able to evaluate volatility in real time is critical, because it enables you to handicap the odds of moves breaking through ranges vs. reversing back into the ranges. As we can see from the comparison of Friday and Monday, greater volume and volatility makes the difference between a day of breakouts and a range bound day.
We followed Friday's large decline with a small gain amidst low volatility on Monday. As we saw from the previous posts, this is a statistically unusual event. When I went back to December, 1998 (N = 1793), I found how unusual this is. After a large decline of more than 1.5%, we have never--until Monday--had a rise on such low volatility. For what it's worth, small bounces from large declines that occurred on ranges of less than 1.5% (N = 8) were down the next day on six of those occasions for an average loss of -.94%. In general, lower volatility bounces tended to fare more poorly three days out than high volatility rises. While the numbers are too small for statistical significance, their bearish cast makes sense given that--thus far--the downside is attracting more interest than the upside and--in Market Profile terms--we are accepting value at progressively lower prices.
Sunday, January 22, 2006
One More Perspective on Steep Declines
Note: I recently submitted an article to Trading Markets regarding the recent downward volatile trade. That should appear Monday AM. Also see the last couple of entries on this site for a perspective on the week to come. Finally, Sunday evening's Trader Performance blog on my personal site will offer some psychological insight as to how to utilize the historical analyses offered herein.
For my last analysis of Friday's sizable decline, I took a different approach. Going back to January, 2000 (N = 1518), I calculated the 200 day standard deviation of price changes and investigated what happens after the market moves more than 2 standard deviations lower in a single day. The beauty of this analysis is that it adjusts the investigation for changes in volatility over time, so that what is steep in a non-volatile market and in a volatile one is different.
I found 34 such occasions and looked at what happens in SPY afterward. Two days after the steep drop, the market was up 23 times, down 11 for an average gain of .77%. This is much stronger than the average two-day gain of .00% for the sample overall (759 up, 759 down). Steep drops tend to be followed by rebounds in the near term. Buying weakness the day after the steep drop and holding for strength the following day was a profitable strategy overall.
That having been said, the strategy was much less successful for much of 2001 and 2002 than for the rest of the sample. As we saw before, weakness in a bull market provides opportunity; in a bear market it often leads to a cascade of selling and a clustering of weak days. This clustering, such as we saw in July, 2002, is the reason why such weak market occasions must be followed by careful reading of subsequent real-time action. Although the odds are bullish following weak market days overall, when weakness does follow weakness, the downside can be substantial--especially given the enhanced volatility that such big down days engender.
Since the bull market started in 2003, we have had 7 instances of weak market days that have fallen more than two standard deviations. The market has been up 5 times, down twice, for an average two-day gain of .85%. Once again, the response of the market to the latest weakness will provide a piece of information regarding whether we continue in the bull mode.
For my last analysis of Friday's sizable decline, I took a different approach. Going back to January, 2000 (N = 1518), I calculated the 200 day standard deviation of price changes and investigated what happens after the market moves more than 2 standard deviations lower in a single day. The beauty of this analysis is that it adjusts the investigation for changes in volatility over time, so that what is steep in a non-volatile market and in a volatile one is different.
I found 34 such occasions and looked at what happens in SPY afterward. Two days after the steep drop, the market was up 23 times, down 11 for an average gain of .77%. This is much stronger than the average two-day gain of .00% for the sample overall (759 up, 759 down). Steep drops tend to be followed by rebounds in the near term. Buying weakness the day after the steep drop and holding for strength the following day was a profitable strategy overall.
That having been said, the strategy was much less successful for much of 2001 and 2002 than for the rest of the sample. As we saw before, weakness in a bull market provides opportunity; in a bear market it often leads to a cascade of selling and a clustering of weak days. This clustering, such as we saw in July, 2002, is the reason why such weak market occasions must be followed by careful reading of subsequent real-time action. Although the odds are bullish following weak market days overall, when weakness does follow weakness, the downside can be substantial--especially given the enhanced volatility that such big down days engender.
Since the bull market started in 2003, we have had 7 instances of weak market days that have fallen more than two standard deviations. The market has been up 5 times, down twice, for an average two-day gain of .85%. Once again, the response of the market to the latest weakness will provide a piece of information regarding whether we continue in the bull mode.
Saturday, January 21, 2006
High Volume Steep Declines: A Closer Look
I took a more detailed look at what happens after high volume large declines, and the findings are interesting. Since January, 1998 (N = 2021), I found 36 occasions in SPY in which we had a decline of greater than 1.5% on volume that exceeds the average 60 day daily volume by more than 75%. This fits Friday's trade well, where we declined by 1.82% on 105% of the average 60 day volume.
From the close to the following day's open, the average loss was -.12% (18 up, 18 down), which is weaker than the average move to open of .04% (1104 up, 917 down). Nine of the 36 occasions moved more than 1% up or down from close to open, far more often than normally occurs. This is reflective of above average overnight volatility following the high volume decline.
This above average volatility carries over to the next trading day as well. The average high to low range for the sample overall is 1.60%. For the day after the high volume down day, however, the average trading range has been 3.2%. Indeed, only 4 of the 36 occasions saw a high to low range of under 1.5%. Clearly this leads us to expect some volatile trade on Monday.
In terms of directional edge, although the day after the weak high volume day tends to open weak, by the close this has typically turned around. Three days after the weak high volume day, the market is up by an average .54% (23 up, 13 down), much better than the average three-day gain of .06% (1091 up, 930 down). When we break this down historically, though, a pattern emerges: since 2001, the results following a weak high volume decline have been much worse than from 1998-2000. During the bull market of 1998-2000, weak high volume declines tended to be followed by gains; during the bear market, those same declines tended to cluster, creating multiple high volume declines and subnormal results. For instance, from 2001 - 2005, two days after the high volume large decline we averaged a drop of -.84% (6 up, 12 down), but from 1998 - 2000 we averaged a gain of 1.64% (15 up, 3 down)!
Where does that leave us? The clearest finding from the data is that a high volume weak day tends to produce high volatility prior to the open (overnight session) and during the next day's trade. In a bull market, such declines become short-term opportunities to pick up bargains. In bear markets, such declines feed upon themselves, generating large price drops. How the market responds to Friday will tell us much about the kind of market we're in. I will be monitoring the measures of buying/selling from the Trading Psychology Weblog intraday to gauge whether we're seeing bargain hunting or panic selling.
FWIW, since 2003, we've only had 3 days of large declines on high volume. The next day, the market has been down twice, up once. When we opened lower on those two occasions, we traded lower through the remainder of the day. When we opened higher, we traded modestly lower from open to close. I will need to see tangible evidence of buying before fishing for bargains in Monday's trade.
On a separate note, if you're looking for a light moment, check out my site and you'll see the first article I've ever written for a website to be outright turned down. I can't figure out why...
From the close to the following day's open, the average loss was -.12% (18 up, 18 down), which is weaker than the average move to open of .04% (1104 up, 917 down). Nine of the 36 occasions moved more than 1% up or down from close to open, far more often than normally occurs. This is reflective of above average overnight volatility following the high volume decline.
This above average volatility carries over to the next trading day as well. The average high to low range for the sample overall is 1.60%. For the day after the high volume down day, however, the average trading range has been 3.2%. Indeed, only 4 of the 36 occasions saw a high to low range of under 1.5%. Clearly this leads us to expect some volatile trade on Monday.
In terms of directional edge, although the day after the weak high volume day tends to open weak, by the close this has typically turned around. Three days after the weak high volume day, the market is up by an average .54% (23 up, 13 down), much better than the average three-day gain of .06% (1091 up, 930 down). When we break this down historically, though, a pattern emerges: since 2001, the results following a weak high volume decline have been much worse than from 1998-2000. During the bull market of 1998-2000, weak high volume declines tended to be followed by gains; during the bear market, those same declines tended to cluster, creating multiple high volume declines and subnormal results. For instance, from 2001 - 2005, two days after the high volume large decline we averaged a drop of -.84% (6 up, 12 down), but from 1998 - 2000 we averaged a gain of 1.64% (15 up, 3 down)!
Where does that leave us? The clearest finding from the data is that a high volume weak day tends to produce high volatility prior to the open (overnight session) and during the next day's trade. In a bull market, such declines become short-term opportunities to pick up bargains. In bear markets, such declines feed upon themselves, generating large price drops. How the market responds to Friday will tell us much about the kind of market we're in. I will be monitoring the measures of buying/selling from the Trading Psychology Weblog intraday to gauge whether we're seeing bargain hunting or panic selling.
FWIW, since 2003, we've only had 3 days of large declines on high volume. The next day, the market has been down twice, up once. When we opened lower on those two occasions, we traded lower through the remainder of the day. When we opened higher, we traded modestly lower from open to close. I will need to see tangible evidence of buying before fishing for bargains in Monday's trade.
On a separate note, if you're looking for a light moment, check out my site and you'll see the first article I've ever written for a website to be outright turned down. I can't figure out why...
Friday, January 20, 2006
High Volume Steep Decline: What Comes Next
Friday's market moved sharply lower, with SPY down 1.82% on volume that was 136% of its 20 day average volume. What typically happens after such a decline? I will provide a preliminary analysis here, but will follow up tomorrow with further analyses.
I went all the way back to January, 1998 (N = 2022 trading days) and found only 29 days in SPY that were down more than 1.5% on volume that exceeded the 20 day average by more than 75%. Large, high volume declines have thus been rare--especially recently. During this low volatility bull market, we've only had one occurrence: 3/10/04. The market followed that down day with a further decline of 1.3% the next trading day.
Over the next three trading days, when we've had a steep decline on large volume (N = 29), the market has been up 19 times, down 10 for an average gain of .83%. That is quite a bit better than the average three-day gain of .06% (1091 up, 931 down) for the sample overall. There is thus a tendency to rebound over the near term.
Interestingly, the day after a high volume steep decline tends to be a big day, whether up or down. Of the 29 occurrences, 19 were either up or down the next day by more than a full percent, and 8 of the 29 moved more than 2%. This reflects serial volatility: highly volatile trading days tend to be followed by days that are above average in volatility. In fact, the average absolute one day change in the sample was .92%, but the absolute one day change following a high volume steep decline was 1.56%.
More to follow...
I went all the way back to January, 1998 (N = 2022 trading days) and found only 29 days in SPY that were down more than 1.5% on volume that exceeded the 20 day average by more than 75%. Large, high volume declines have thus been rare--especially recently. During this low volatility bull market, we've only had one occurrence: 3/10/04. The market followed that down day with a further decline of 1.3% the next trading day.
Over the next three trading days, when we've had a steep decline on large volume (N = 29), the market has been up 19 times, down 10 for an average gain of .83%. That is quite a bit better than the average three-day gain of .06% (1091 up, 931 down) for the sample overall. There is thus a tendency to rebound over the near term.
Interestingly, the day after a high volume steep decline tends to be a big day, whether up or down. Of the 29 occurrences, 19 were either up or down the next day by more than a full percent, and 8 of the 29 moved more than 2%. This reflects serial volatility: highly volatile trading days tend to be followed by days that are above average in volatility. In fact, the average absolute one day change in the sample was .92%, but the absolute one day change following a high volume steep decline was 1.56%.
More to follow...
Thursday, January 19, 2006
Overnight Moves and Next Day Volatility
I recently submitted an article to Trading Markets that looks at the relationship between the size of the overnight moves in the major indices and the trading range the next trading session. It turns out that for such averages as the S&P 500 Index (SPY), the NASDAQ 100 Index (QQQQ), and the Dow Jones Industrial Average (DIA), the correlation between the size of their move from close to open and the subsequent high-low range is in the order of .33. When the overnight move is greater than .50%, the market has a trading range that exceeds 1% over three-quarters of the time. When the overnight move is less than .05%, the market trades in a range greater than 1% less than half of the time.
Interestingly, the Russell 2000 correlation is only about half that of the Dow. Overnight events may well impact large cap issues more than small caps. It is also interesting to look at correlations for individual stocks. Many stocks, such as MSFT (.30), AAPL (.27), and IBM (.23) have correlations similar to the indices. Others, such as XOM (.07) show little relationship between the magnitude of overnight moves and trading range the next day. This may be because XOM is impacted more by contemporaneous movement in the oil market than by overnight events.
Using overnight movement and current volume to predict near-term volatility has been extremely helpful in my trading, as volatility is a predictor of whether markets will break out of ranges vs. revert to mean trading prices. This appears to be a strategy that can work for individual equities as well as indices.
Interestingly, the Russell 2000 correlation is only about half that of the Dow. Overnight events may well impact large cap issues more than small caps. It is also interesting to look at correlations for individual stocks. Many stocks, such as MSFT (.30), AAPL (.27), and IBM (.23) have correlations similar to the indices. Others, such as XOM (.07) show little relationship between the magnitude of overnight moves and trading range the next day. This may be because XOM is impacted more by contemporaneous movement in the oil market than by overnight events.
Using overnight movement and current volume to predict near-term volatility has been extremely helpful in my trading, as volatility is a predictor of whether markets will break out of ranges vs. revert to mean trading prices. This appears to be a strategy that can work for individual equities as well as indices.
Wednesday, January 18, 2006
Strength After a Down Open: What Has Followed
Wednesday's market opened down, but was up from open to close. Since January, 2004 (N = 514), we've had 52 occasions in which the market (SPY) opened lower by .3% or more. The next day, the market was up by an average of .02% (31 up, 21 down)--no real edge relative to the average change of .03% (283 up, 231 down) for the sample overall.
When we use a median split to divide the days that opened down by whether they were strong vs. weak from open to close, a pattern emerges. When the market was strong from open to close after a down open (N = 26), the next day averaged a loss of -.20% (12 up, 14 down). When the market was weak from open to close after a down open (N = 26), the next day averaged a gain of .23% (19 up, 7 down).
Interestingly, strength during the day after a weak open has not carried over to the next day. Indeed, more often than not, such strength has been reversed.
When we use a median split to divide the days that opened down by whether they were strong vs. weak from open to close, a pattern emerges. When the market was strong from open to close after a down open (N = 26), the next day averaged a loss of -.20% (12 up, 14 down). When the market was weak from open to close after a down open (N = 26), the next day averaged a gain of .23% (19 up, 7 down).
Interestingly, strength during the day after a weak open has not carried over to the next day. Indeed, more often than not, such strength has been reversed.
Tuesday, January 17, 2006
Double Down: What Next?
Today's market gapped lower at the open and closed lower. Now it appears likely that we'll gap lower tomorrow AM on the NASDAQ 100 Index (QQQQ), given the weak Intel news. What has happened during the trading day after we've gapped lower two days in a row?
Since January, 2003 (N = 765), we've only had 1o occasions in which a day that has closed lower and gapped down at the open has been followed by a second gap down. From the open of the market that second day (which would correspond to Wednesday in current trade) to the close, the market averaged a loss of -.74% (2 up, 8 down). That's quite a bit more bearish than the average open to close change of .01% (393 up, 373 down) for the sample overall.
In short, despite the market's tendency to reverse weakness in the short run, two consecutive gaps down have not, on average, led to a rebound during the subsequent trading day. Although it might be tempting to jump into the market at the open and look for bargains, on average this has not been a winning strategy since 2003.
Since January, 2003 (N = 765), we've only had 1o occasions in which a day that has closed lower and gapped down at the open has been followed by a second gap down. From the open of the market that second day (which would correspond to Wednesday in current trade) to the close, the market averaged a loss of -.74% (2 up, 8 down). That's quite a bit more bearish than the average open to close change of .01% (393 up, 373 down) for the sample overall.
In short, despite the market's tendency to reverse weakness in the short run, two consecutive gaps down have not, on average, led to a rebound during the subsequent trading day. Although it might be tempting to jump into the market at the open and look for bargains, on average this has not been a winning strategy since 2003.
Monday, January 16, 2006
Bonds and Stocks: The Longer View
As we found earlier, bond and stock prices have been positively correlated over longer time frames in the market (40 days) since 2003, but not on a day-to-day basis. We saw with day-to-day results, strong bonds and strong stocks led to subnormal returns; weak bonds and weak stocks led to above average returns.
Now we'll look at stocks and bonds over a 40-day basis. Specifically, we want to see if strong bonds over a 40 day period are associated with strong stocks over the next 40 days. Since March, 2003 (N = 686), 40-day periods have had a distinctly positive bias. The S&P 500 Index has averaged a gain of 2.33% (483 periods up, 203 down) during that time. When we conduct a median split of the data based on 40-day bond strength, we find that strong bonds yield an average gain of 3.30% in SPX over the next 40 days (260 up, 83 down). When bonds are weak, the next 40 days in SPX average 1.35% (223 up, 120 down).
What we're seeing is a very different pattern in the short-term and longer-term data. For intermediate-term traders and for investors, bond strength is bullish for stocks. For short-term traders, bond strength has been bearish for stocks. Knowing one's time frame and price patterns typical of one's price frame is all-important.
Now we'll look at stocks and bonds over a 40-day basis. Specifically, we want to see if strong bonds over a 40 day period are associated with strong stocks over the next 40 days. Since March, 2003 (N = 686), 40-day periods have had a distinctly positive bias. The S&P 500 Index has averaged a gain of 2.33% (483 periods up, 203 down) during that time. When we conduct a median split of the data based on 40-day bond strength, we find that strong bonds yield an average gain of 3.30% in SPX over the next 40 days (260 up, 83 down). When bonds are weak, the next 40 days in SPX average 1.35% (223 up, 120 down).
What we're seeing is a very different pattern in the short-term and longer-term data. For intermediate-term traders and for investors, bond strength is bullish for stocks. For short-term traders, bond strength has been bearish for stocks. Knowing one's time frame and price patterns typical of one's price frame is all-important.
Sunday, January 15, 2006
Weak Stocks and Bonds - Continuing the Investigation
Yesterday's entry looked at strong days in the stocks since 2003 and found a tendency for near-term reversal, especially when bonds were also strong. That made me curious about weak days in stocks (SPX). Is the outlook following weakness different as a function of bond prices?
Since January, 2003 (N = 760), we've had 185 days in which SPX has been down by half a percent or more. The next day, stocks have risen on average .12% (112 up, 73 down), which is considerably stronger than the average rise of .03% for the remainder of the sample (310 up, 265 down). This is the pattern of strength following weakness that we've encountered before.
Once again I subjected the weak SPX days to a median split based upon bond price performance that day. When bonds were weak and stocks were weak (N = 93), the next day in stocks averaged a gain of .26% (62 up, 31 down). When bonds were strong and stocks were weak (N = 92), the next day in stocks averaged a loss of -.02% (50 up, 42 down). Again, this is counterintuitive. You would think that falling stocks and rising interest rates (falling bond prices) would yield weak stocks going forward. Just the opposite is the case: when stocks have been strong and bonds strong, we've had subnormal short-term returns going forward. When stocks have been weak and bonds weak, we've had above average short-term returns.
These patterns will be worth following, especially given the recent divergence between stocks (which have made new highs) and bonds (which have not).
Since January, 2003 (N = 760), we've had 185 days in which SPX has been down by half a percent or more. The next day, stocks have risen on average .12% (112 up, 73 down), which is considerably stronger than the average rise of .03% for the remainder of the sample (310 up, 265 down). This is the pattern of strength following weakness that we've encountered before.
Once again I subjected the weak SPX days to a median split based upon bond price performance that day. When bonds were weak and stocks were weak (N = 93), the next day in stocks averaged a gain of .26% (62 up, 31 down). When bonds were strong and stocks were weak (N = 92), the next day in stocks averaged a loss of -.02% (50 up, 42 down). Again, this is counterintuitive. You would think that falling stocks and rising interest rates (falling bond prices) would yield weak stocks going forward. Just the opposite is the case: when stocks have been strong and bonds strong, we've had subnormal short-term returns going forward. When stocks have been weak and bonds weak, we've had above average short-term returns.
These patterns will be worth following, especially given the recent divergence between stocks (which have made new highs) and bonds (which have not).
Saturday, January 14, 2006
Strong Stocks: Do Bonds Make a Difference?
Today's entry on the Trading Psychology Weblog mentioned an interesting relationship between bonds and stocks from 2003 to the present. Of the twenty days that were strongest in stocks (SPX), sixteen of those exhibited declining bond prices. Of the twenty weakest days in stocks, thirteen showed rising bond prices. It appears to be a kind of flight from/to quality phenomenon: When stocks drop, money goes into fixed income and vice versa.
This led me to wonder if we might see different expectations when strong and weak days in stocks are accompanied by strength or weakness among bonds. Since 2003 (N = 760), we had 195 days in which SPX was up by .50% or more. The next two days, the market averaged a loss of -.10% (96 up; 99 down), much worse than the .17% average gain (311 up, 254 down) in the rest of the sample. This is the weakness following strength pattern that we've noticed before.
Now, however, let's conduct a median split and compare strong SPX/strong bond days to strong SPX/weak bond days. After the strong SPX/strong bond days (N = 98), the market averaged a two-day loss of -.23% (46 up, 52 down). After the strong SPX/weak bond days (N = 97), the market averaged a two-day gain of .02% (50 up, 47 down). Interestingly, days in which both stocks and bonds are strong have been followed by noteworthy two-day weakness.
To the extent that fixed income might serve as an alternative to stocks, a rally in both stocks and bonds would represent general optimism regarding financial assets and a putting of money to work in those sectors. When stocks are strong but bonds weak, we might be seeing a mere transfer of assets within the universe of financial instruments. When traders are overly optimistic about the financials, stocks have tended to correct over the short term. Ironically, a market rally on lower interest rates--a seemingly positive development--has led to subnormal returns near term. Tomorrow I'll look at SPX weakness vis a vis bonds.
This led me to wonder if we might see different expectations when strong and weak days in stocks are accompanied by strength or weakness among bonds. Since 2003 (N = 760), we had 195 days in which SPX was up by .50% or more. The next two days, the market averaged a loss of -.10% (96 up; 99 down), much worse than the .17% average gain (311 up, 254 down) in the rest of the sample. This is the weakness following strength pattern that we've noticed before.
Now, however, let's conduct a median split and compare strong SPX/strong bond days to strong SPX/weak bond days. After the strong SPX/strong bond days (N = 98), the market averaged a two-day loss of -.23% (46 up, 52 down). After the strong SPX/weak bond days (N = 97), the market averaged a two-day gain of .02% (50 up, 47 down). Interestingly, days in which both stocks and bonds are strong have been followed by noteworthy two-day weakness.
To the extent that fixed income might serve as an alternative to stocks, a rally in both stocks and bonds would represent general optimism regarding financial assets and a putting of money to work in those sectors. When stocks are strong but bonds weak, we might be seeing a mere transfer of assets within the universe of financial instruments. When traders are overly optimistic about the financials, stocks have tended to correct over the short term. Ironically, a market rally on lower interest rates--a seemingly positive development--has led to subnormal returns near term. Tomorrow I'll look at SPX weakness vis a vis bonds.
Friday, January 13, 2006
Bonds and Stocks - Interesting Relationship
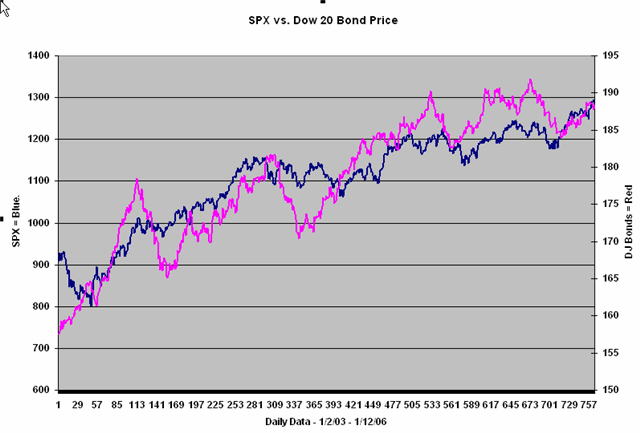
A reader suggested to me that I take a multidimensional approach to historical patterns and investigate intermarket relationships such as between bonds and stocks. This is an excellent suggestion, and it highlights the need to look at many patterns before jumping in and trading any single one. An approach I like to take is to look at non-overlapping patterns (such as between daily SP and bonds, daily SP and advance-decline, and weekly SP and volume) and see if there is a consensus among the "committee of experts". Some excellent trade ideas emerge when you see a pattern edge from multiple patterns.
The bond/stock relationship is a complicated one. As we can see from the chart above, which covers 2003 - present, the price of the DJ corporate bonds is highly correlated with the price of the S&P 500 Index. When we look on a day to day basis, however, the correlation is -.12! A strong or weak day in bonds tells us very little about whether that day was strong or weak in stocks. Over a period of 40 days, however, the correlation is .38--positive and significant.
Note that dips in bond price have been excellent points to purchase stocks. But note also that the current price highs are the first ones since 2003 to go unconfirmed by the bonds. To the extent that bonds lead stocks, there might be a message there. I will investigate this further and post tomorrow.
Thursday, January 12, 2006
Ten Days After the Runup
I just submitted an article to Trading Markets that should appear tomorrow. It takes a look at occasions since March, 2003 when we've had 1400+ new 65-day highs. Monday was our most recent occasion with over 1400 new 65-day highs, so the analysis has some current relevance. Specifically, I looked at what happens within a 10 days period following the surge in new highs: the maximum gain, maximum loss, and average price change.
Interestingly, half of the occasions (N = 26) occurred early in the bull market; half came later. The early occasions led to significant strength over the next ten days, with an average gain of 1.77% (10 up, 3 down). The later occasions were underperformers, with an average gain of .11% (7 up, 6 down). For the entire data sample (N = 703), the average ten-day price change was .63% (437 up, 265 down, 1 unchanged).
My speculation is that there is a developmental course to bull markets. Early on, strength begets strength during the swiftest portion of the market's ascent. As the rate of change slows and the market tops out later in the bull period, strength begets subnormal performance. My data suggest that the recent periods of market strength have not led to above average market declines. Rather, they've been followed by subnormal strength.
How we follow up the early strength in 2006 may say quite a bit about the relative youth vs. aging of this bull market.
BTW, the new high/low data and a very broad measure of market momentum called Demand/Supply are published daily on my personal site.
Interestingly, half of the occasions (N = 26) occurred early in the bull market; half came later. The early occasions led to significant strength over the next ten days, with an average gain of 1.77% (10 up, 3 down). The later occasions were underperformers, with an average gain of .11% (7 up, 6 down). For the entire data sample (N = 703), the average ten-day price change was .63% (437 up, 265 down, 1 unchanged).
My speculation is that there is a developmental course to bull markets. Early on, strength begets strength during the swiftest portion of the market's ascent. As the rate of change slows and the market tops out later in the bull period, strength begets subnormal performance. My data suggest that the recent periods of market strength have not led to above average market declines. Rather, they've been followed by subnormal strength.
How we follow up the early strength in 2006 may say quite a bit about the relative youth vs. aging of this bull market.
BTW, the new high/low data and a very broad measure of market momentum called Demand/Supply are published daily on my personal site.
Subscribe to:
Posts (Atom)


 Posts
Posts


