
The NYSE TICK tells us something about sector strength. Long time readers of this blog are familiar with my cumulative Adjusted TICK statistic. This takes the NYSE TICK (the number of stocks trading at offer minus those trading at their bid prices) and subtracts from each one minute value the average one-minute NYSE TICK reading from the prior 20 days. These values are cumulated to give a single end-of-day reading. If the cumulative Adjusted TICK is above zero, it means that we're seeing a tilt toward buying interest (lifting of offers) among the broad list of stocks. If the cumulative Adjusted TICK is below zero, it means that we have net selling sentiment (hitting of bids).
Since 2005 (N = 596 trading days), the cumulated Adjusted TICK has correlated very highly with concurrent daily price change in the S&P 500 Index (SPY; .76) and price change in the Russell 2000 Index (IWM; .80). This is why one of my most effective intraday strategies is to assess shifts in the distribution of the TICK for emerging directional moves in the indices. Shifts in the TICK, including breakouts from ranges, frequently precede or initiate short-term directional moves in the indexes.
But suppose we are interested in answering the question: should I be trading the large cap index (S&P 500 issues) or the small cap index (Russell 2000)? Or suppose we decide to craft a pairs trade in which we'll be long one of those indexes and short the other one. In both cases it turns out that the cumulative Adjusted TICK provides useful guidance.
I went back to 2005 (N = 596) and found that the cumulative Adjusted TICK correlates .60 with the difference in performance between IWM and SPY. Specifically, when the Adjusted TICK is strong, IWM is significantly more likely to outperform SPY than the reverse. When the Adjusted TICK is weak, we see underperformance of IWM relative to SPY.
In fact, when the cumulative Adjusted TICK was above zero (N = 301), IWM outperformed SPY on 212 of those occasions. When the cumulative Adjusted TICK reading was above +300 (N = 144), IWM outperformed SPY on 114 occasions, or about 80% of the time.
When, however, the cumulative Adjusted TICK was below zero (N = 295), SPY outperformed IWM on 196 of those occasions. When the cumulative Adjusted TICK reading was below -300 (N = 139), SPY outperformed IWM on 117 occasions--over 80% of the time.
A strong NYSE TICK not only tells us that there is buying interest in the market, but it's also telling us that the buying interest is extending to the broad list of stocks, including small caps. Similarly, very weak TICK readings tell us that investors are selling off the smallest of stocks along with the larger ones. In strong or weak TICK environments, traders can consider trading long or short positions in IWM or perhaps constructing pairs trades in which they are long IWM/short SPY (or the reverse in a weak TICK setting).
Note that this strategy also suggests that it could be fruitful to monitor custom TICK measures for specific market sectors. (The NeoTicker platform enables the construction of such TICK-specific measures). A range of ETF trading strategies (or pairs trades among ETFs) could follow such an effort--a worthy area to research.
RELATED READINGS:
Trading With the NYSE TICK
NYSE TICK and Short-Term Breakout Moves
Showing posts sorted by relevance for query nyse tick. Sort by date Show all posts
Showing posts sorted by relevance for query nyse tick. Sort by date Show all posts
Tuesday, May 22, 2007
Thursday, February 14, 2008
NYSE TICK: Using Sentiment to Trade Trend Days


I recently began posting intraday setups for daytraders. This pattern is a setup that is common to trend days, as it capitalizes on persistent sentiment extremes.
The top chart is the five-minute ES futures for today's market. The bottom chart is the five-minute NYSE TICK. Note that we see two important lines on the NYSE TICK chart. The first is the horizontal green line, which is the zero level. When the TICK is above this line, we know that more stocks are trading at their offer price than their bid. That tells us that buying sentiment is dominating: traders are sufficiently eager to enter the market that they'll pay up for the privilege.
When the TICK is below the green zero line, it tells us that selling sentiment is dominant. Traders are sufficiently eager to exit the market that they'll settle for taking the bid price.
In a strong, trending market, we'll see the NYSE TICK trade persistently above or below that green line, as buying or selling sentiment remains extreme through the session. It's when we see the TICK oscillate evenly around the green, zero line that we're most likely to trade in a range.
The blue line is a five-minute H-L-C moving average of the NYSE TICK. Notice that, from the very start of the session, the TICK (and the blue line) was predominantly below the green line. Selling sentiment was dominating right out of the gate. With one exception, we could not generate a +500 or greater reading in the TICK most of the morning.
We started the day anticipating weakness from the historical patterns. We opened below the high price from the overnight session. When the sellers began the session hitting bids in force, I waited for the first positive bounce in the NYSE TICK (to make sure it would remain below the overnight high) and then took my short position. A little after 9 AM CT, a market bounce put my position in the red, but sellers again came in before we could break the overnight high. That led me to add to the short position, with the overnight high as my stop.
From there, I stayed short for the remainder of the session, as the moving average of the TICK stayed chronically below the green line for most the day. The idea is that a trend day will close near its lows, so you don't want to get thrown from your good position unless you see a distinctive shift in sentiment. I find the advance-decline line to be helpful here: if declines are swamping advances, the odds are greater that a trend day to the downside is in force.
Many times traders miss a trend day because they didn't get in early and don't want to "chase" markets. The reality is that, as long as sentiment is staying in its trend, there will be plenty of countertrend bounces (or dips) in the TICK that offer fine short-term entries. The key is identifying the trend day early based on persistent sentiment extremes. Rennie Yang's Market Tells service sends out emails based on this very pattern (and indeed he made a good call on today's move); if you have trouble tracking the TICK on your own, that might be a useful aid.
RELEVANT POSTS:
Identifying Sentiment Trends With the NYSE TICK
Trading With the NYSE TICK - Part One
Trading With the NYSE TICK - Part Two
Trading With the NYSE TICK - Part Three
.


Saturday, August 12, 2006
Trading With the NYSE TICK - Part Three
In the first post in this series, I showed how the NYSE TICK fits into a common intraday trading setup. The second in the series illustrated how an ongoing assessment of the distribution of NYSE TICK values during the day provides a useful tracking of trader sentiment. In this final installment in the series, we'll take a multi-day look at the value of the NYSE TICK as a trading tool.
For this study, I use the Adjusted TICK statistic reported daily on the Trading Psychology Weblog. This is a daily average of the moment-to-moment TICK readings, adjusted to create a zero mean. As a result, positive numbers mean that there has been net buying sentiment on the day; negative numbers indicate the reverse. The correlation between this daily Adjusted TICK reading and daily price change in SPY has been over .70, suggesting that about half of all variance in price can be attributed to trader activity at the bid vs. offer across the universe of NYSE stocks.
Since July, 2003 (N = 774 trading days), I found 63 occasions in which the S&P 500 Index (SPY) was up by more than 1% on the day. Four days later, SPY was up on average by .07% (35 up, 28 down). That represents no bullish edge whatsoever relative to the average four-day SPY gain of .14% (432 up, 342 down) for the entire sample.
Now, however, let's factor the NYSE TICK into the mix. When SPY has been up by more than 1% *and* the NYSE TICK has been strong (N = 31), the next four days in SPY average a gain of .39% (22 up, 9 down). When SPY has been up by more than 1% and the TICK has been weak (N = 32), the next four days in SPY have averaged a loss of -.24% (13 up, 19 down). Clearly, the TICK makes a difference: a single day's TICK reading has bullish or bearish implications four days out.
How about when the S&P 500 (SPY) is weak on the day? We had 67 occasions in which SPY has been down by more than 1% in a single day since July, 2003. When the SPY was weak and the NYSE TICK was relatively strong (N = 34), the next four days in SPY average a gain of .39% (21 up, 13 down). When SPY was weak *and* the TICK was weak (N = 33), the next four days in SPY averaged a gain of only .03% (16 up, 17 down). Once again, we see that a single day's TICK reading exerts an influence several days out.
Now let's look at the TICK over multiple days. When the adjusted NYSE TICK averages more than +500 over a four-day period (N = 36), the *next* four days in SPY average a gain of .39% (23 up, 13 down). That is much stronger than the average four-day gain of .14%, as noted above. When the TICK averages less than -500 over a four-day period (N = 34), the next four days in SPY average a gain of .48% (23 up, 11 down)--again much stronger than average.
What we see is that very positive trader sentiment over a several day period tends to generate strength over the next several days, but very negative sentiment tends to lead to reversals. The bottom line is that the moment-to-moment lifting of offers and hitting of bids among traders does make a difference--even on a multi-day time frame.
Tuesday, February 20, 2007
Identifying the Trend of Market Sentiment With the NYSE TICK: A Best Practice in Trading

Here is a best practice that will help you identify the trend of the market's sentiment in a single glance. It is a simple way of calculating the Adjusted NYSE TICK, as reported daily in the Trading Psychology Weblog.
In past posts, I have described the use of the NYSE TICK as a real-time measure of market sentiment. Because it captures the number of stocks trading at their offer price minus those trading at their bid at each point in time, it illustrates whether buyers are more aggressive in the broad market (they are accepting the offer price to get into stocks) or whether sellers are more urgent (accepting the bid price to get out of stocks). The NYSE TICK, when cumulated over time, is helpful in anticipating momentum effects in the market and in determining whether or not we're likely to hit pivot-based price targets. For this reason, a number of very nice setups can be identified using TICK, price, and volume.
The chart above, taken from e-Signal, is of the NYSE TICK on a 1-minute basis. Notice that the TICK values, displayed in candlestick bars, are accompanied by three horizontal lines. The first line, in red at the center, is the regression line over the past day of trading (i.e., the past 405 bars). This line is the best fit connecting the high-low-closes for each bar over that period. The blue lines above and below the TICK bars represent values that are two standard deviations above and below the regression line. When the TICK exceeds these levels, we know that an unusually large amount of buying or selling is occurring simultaneously among the NYSE stocks. Very often this is because program trading is hitting the market.
Note that, by looking a 3-minute or 5-minute bars, we can adjust the lookback period for the regression line and the standard deviation calculations, since the lines will always be based on the past 405 bars. I generally use a lookback period that corresponds to a relatively flat market condition (e.g., if the market has been flat over the past three trading sessions I'll look at a 3-minute bar of TICK), because that tells me the net buying vs. selling sentiment needed to sustain zero price change. If new TICK values consistently exceed the value represented by the regression line, that signals a shift toward bullish sentiment, and I would be leaning toward buying pullbacks in the TICK (i.e., pullbacks toward the lower blue line). If TICK values consistently fall short of the regression line value, that would indicate a shift toward bearish sentiment, and I would lean toward selling bounces in the TICK (i.e., upthrusts toward the upper blue line). When TICK oscillates evenly around the regression line, we often will have range bound conditions.
The key visual identification is the slope of the regression line for the NYSE TICK. If the slope is positive (the line is rising), we have increasing buying sentiment over time and vice versa. The slope of the regression line--and particularly a change in the slope--informs us of the trend of market sentiment. This is very useful in identifying shifts in the market's trend. In the above example, the slope is steadily rising and that--all other things being equal--would lead me to buy dips in the TICK that do not make fresh price lows. That would be one way to buy pullbacks in an upward trend.
Viewing the NYSE TICK-based sentiment in this fashion, you can filter your own entry signals. For instance, you might identify a bullish configuration in a chart pattern or in a CCI pattern, but only take that trade if the slope of the TICK (the sentiment trend) is positive. Many, many times the TICK distribution--the direction of the line--has kept me out of a bad trade by forcing me to go with the dominant market sentiment (which is set by the large traders). This is why identifying the trend of sentiment is, for me, a best practice.
Sunday, September 24, 2006
The Cumulative NYSE TICK: A Valuable Measure of Short-Term Sentiment
Readers of my Weblog and the daily morning updates on this blog know that I utilize the NYSE TICK statistics quite extensively in my own trading and analysis.
Why? The NYSE TICK represents, at any given moment, the net number of stocks in the broad market that are trading at their offer prices minus those trading at their bids. When the NYSE TICK becomes very positive, it means that traders are lifting offers in the broad market: buyers are quite aggressive. When the TICK becomes very negative, it means that traders are hitting bids in the broad market: sellers are very aggressive.
The swings in the NYSE TICK during the day, then, represent relative swings in short-term trader sentiment. The beauty of the measure is that it is assessing what bulls and bears are actually doing in the marketplace; not what they report as their sentiment or what they try to fool others into believing.
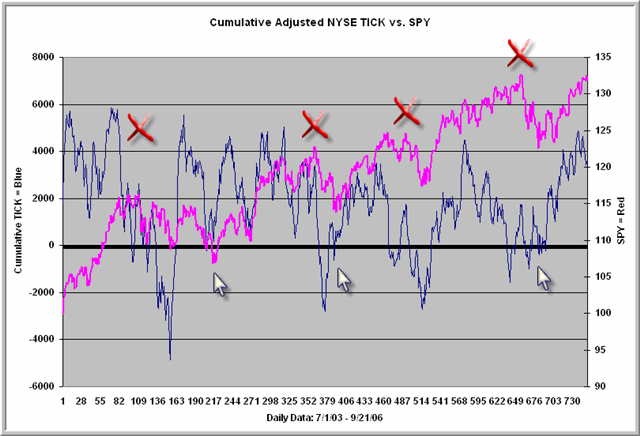
The above chart tracks the Adjusted NYSE TICK (TICK readings rescaled to produce a zero mean and to include high, low, and close readings every minute of each trading day) on a cumulative basis. That means we add the TICK readings to each other (like an advance-decline line) to track the ongoing ebb and flow of trader sentiment.
Let's see what we can learn from the chart.
First, note that--over time--we're getting somewhat lower Cumulative TICK highs and somewhat higher Cumulative TICK lows. I have found in my research a significant correlation between the volatility of the TICK numbers and intraday volatility in the S&P 500 Index. The lower highs and higher lows are telling us that the 2003 - 2006 period tracked is one of declining volatility. I do not think we can confirm that this bull market is over until we see that pattern change: with lower lows in the Cumulative TICK. That would indicate expanding volatility fueling expanded negative trader sentiment.
Second, note the arrows and Xs. It is very common, on a short-term basis, for the Cumulative TICK to top out ahead of the market and to bottom out ahead of the market. The Xs mark price highs unconfirmed by the Cumulative TICK; the arrows point to unconfirmed price lows. In other words, we frequently see shifts in trader sentiment ahead of actual price turns. That makes the Cumulative TICK a useful heads-up when it is above zero and not confirming new price highs and vice versa.
Finally, you can see that short-term market returns are superior when the Cumulative TICK is below zero than when it is above. When the Cumulative Line is above +4000, returns are negative 5-10 days out--a scenario that is unfolding at present. When the Line is below -1000, returns are superior 20+ days out. Relatively consistent high and low (sell and buy) points can be derived by additionally adjusting the line for volatility.
It has been common for the Cumulative TICK to top out well in advance of price during short-term bull swings. Quite often, the measure has regressed toward zero before the ultimate price high was made. I will be watching to see if this pattern plays out in the current market.
Tuesday, December 16, 2008
A NYSE TICK Primer: How to Assess Intraday Sentiment
Although I've posted details in the past, I decided to respond to recent questions about the construction of the Cumulative Adjusted NYSE TICK with two dedicated blog posts. This post will explain the basics of the NYSE TICK. The second will explain my use of the Cumulative Adjusted TICK. For those interested, here is a link to many past posts on the topic of the TICK, many of which explain how I use the indicator in intraday trading.
So let's start at the start. In an auction market, we have buyers who would like to acquire stock at a relatively low price and sellers who would like to part with their stock at a relatively high price. When all buyers and sellers are assembled in the marketplace, we have an established bid price for the stock (the highest price that buyers will pay) and an established offer price (the lowest price that sellers will accept). The spread between the bid and offer will be quite narrow for actively traded issues; wider for less liquid instruments. Market makers provide liquidity to the market by actively buying bids and selling offers, profiting from the spread.
A patient buyer will work an order in the book below the prevailing price, bidding for the stock or futures contract at a price that he/she considers to be a good value. A patient seller will work an order above the prevailing price, offering the stock at a price that he/she considers to be a good value. As a result, there are always resting orders above and below the market. The number and volume of these orders, arrayed by price, is what is known as depth of market. Market makers and true scalpers (those whose trades last a minute or so or less) often rely on shifts in depth of market to identify when the market is skewed toward buyers or sellers.
If a buyer is not patient and feels that the market is headed higher right now, he/she will not work a bid below the market. Rather, they will "lift the offer": they'll place a market order and accept the best price offered by a seller. When this occurs, the stock or futures contract will typically trade on an uptick, at the offer price in the bid-offer matrix. The motivated seller thinks the market is primed to move lower right now and "hits the bid", accepting the best price offered by a buyer. This transaction will occur on a downtick, at the bid price in the bid-offer matrix.
Over time, we can look at how many transactions across all stocks occur on upticks versus downticks as a way of assessing whether buyers or sellers are more motivated. This statistic is called the NYSE TICK. It is calculated by the exchange 10 times per minute (every six seconds), typically under the symbol $TICK. A TICK value of +500 means that 500 more stocks traded on upticks than downticks in the most recent six second period; -500 would mean that 500 more issues traded on downticks than upticks. We can track changes in the TICK over time to see whether buyers or sellers are becoming more aggressive on a short-term basis.
A different view of very short-term sentiment is Market Delta. Instead of looking across a range of stocks to see how many are trading on upticks versus downticks, it calculates the volume of shares or futures contracts traded at the market bid versus offer for a single instrument. This is very helpful when the instrument may be imperfectly correlated to the broad stock market. Many times, for instance, we can see a neutral Market Delta reading in the ES futures when NYSE TICK is quite positive or negative. Most often, this means that sentiment is neutral among large cap issues, but more positive or negative among the large number of small cap issues that are part of the NYSE TICK universe.
Finally, we can use the same logic as TICK to construct measures of money flow. We multiply the price of the stock or futures contract times the volume traded for each transaction. This gives us the dollar volume of the transaction. If the transaction occurred on an uptick, we add the dollar volume to a cumulative total; if it occurred on a downtick, we subtract the dollar volume from the cumulative total. This money flow measure identifies whether large market participants (those trading larger volumes) are predominantly lifting offers or hitting bids.
These are among my favorite market indicators, because they are grounded in the actual auction market behavior of participants. They do not rely upon esoteric interpretations of chart patterns, oscillator readings, or market waves. The minute-to-minute readings of TICK and Market Delta help intraday traders understand whether markets are becoming stronger or weaker. When we cumulate these readings over time, we can assess sentiment shifts over longer time frames.
In my next post in this series, we'll look at how you can cumulate the NYSE TICK and use the data for an understanding of market trends. Please note that I update the Cumulative Adjusted NYSE TICK every Monday in my weekly indicators post; I post money flow numbers for the Dow stocks each morning prior to the start of trading days via Twitter.
.
Wednesday, December 17, 2008
Constructing and Interpreting the Cumulative Adjusted NYSE TICK
My recent post explained the construction of the NYSE TICK and related measures of short-term sentiment. Most uses of TICK are intraday, as a way of gauging whether buyers or sellers are gaining the upper hand on short-term moves. I've used short-term oscillators of the NYSE TICK of 10-20 minutes as a way of smoothing out one-minute values. I find the peaks and valleys helpful in execution, as I want to buy on countertrend dips in the TICK oscillator and sell on countertrend bounces.
Some years ago, I decided to create a cumulative line of one-minute TICK values as a way of gauging longer-term buying and selling interest. Each one minute reading was the average of that minute's high, low, and close TICK values. I added the one-minute average readings to a cumulative total, as one would do for an advance-decline line.
What I found was that the NYSE TICK, as a distribution, did not have a perfect zero mean. There was a positive bias to the series. That bias has since been reduced by the elimination of the uptick rule for short-selling. Still, at any given time, the mean of TICK values will depart from zero. This gave the cumulative TICK line a bias in slope, particularly over the long-term.
Thus began my efforts to adjust the cumulative TICK to create a zero mean. The solution I arrived at was to calculate the average one-minute TICK reading for the past 20 days (a roughly 7900 period moving average of the one-minute high, low, close average values) and subtract that moving 20-day average from each subsequent one-minute H-L-C TICK value. I called this the Adjusted TICK.
What the Adjusted TICK is telling you is whether the current TICK values are stronger or weaker than the average over the past 20 days. This tells us whether markets are gaining or losing buying/selling interest relative to their recent past. In a sense, we can think of this as relative sentiment: the degree to which short-term sentiment is departing from what we've seen over the past month.
When we cumulate these Adjusted TICK values, the resulting line is quite helpful in providing a picture of changes in market sentiment. If buyers or sellers are quite dominant, we'll see a sharp rise or fall in slope of the line. If we're range bound, we'll tend to see a flattening of the line. Divergences between price and the cumulative line suggest that buying or selling pressure may be waning over time, which has me looking for possible reversal.
I use the day's Cumulative Adjusted TICK (starting each day at zero) as a trend indicator; most my intraday trades will be in the direction of the TICK line. I also use breakouts in the TICK to validate price breakouts from ranges. Many of my past posts illustrate these concepts.
I don't know of any software that charts the Cumulative Adjusted TICK for you. Market Tells follows the indicator closely and utilizes it in its helpful newsletter and intraday trend-following service. For more intrepid sorts, the NeoTicker program enables you to create TICK indicators for any basket of stocks, sector, or index.
My own calculation of the indicator utilizes data from e-Signal, archived and charted within Excel. If the adjustment feature isn't crucial for you, you can simply observe how much time a moving average of TICK spends above and below the zero level during the day as a rough way of eyeballing the trend of sentiment. Together with the indicators I track weekly on the blog and that I post each morning before trading days via Twitter, I find the Cumulative TICK invaluable in keeping me on the right side of the market.
.
Friday, August 11, 2006
Trading With the NYSE TICK - Part Two
In my last post, I suggested that the NYSE TICK was an effective short-term measure of sentiment and illustrated a common trading setup utilizing the TICK. In this post, I'll show you an application of the TICK that you're unlikely to have encountered anywhere else.
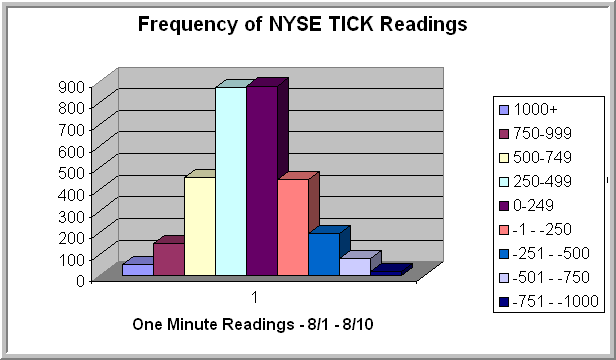
The chart above displays the frequency of closing one-minute NYSE TICK readings for the past eight sessions. I used eight sessions as my lookback period, because the S&P 500 Index has been relatively flat during that period. What that tells me is that this distribution of TICK values (i.e., this distribution of trader short-term sentiment) has been associated with a relatively trendless S&P market.
Note that the median TICK value in the sample is not zero; it is +237. We also tend to have fatter tails on the positive side of the TICK than the negative. (Not shown on the chart are two data points below -1000).
Now how can we use this information to determine the psychology of the market?
My research suggests that, if the relatively flat trading action of the past eight sessions is going to transition to a trending market, we will need to see a shift in the distribution of NYSE TICK values. Such a shift indicates that either buyers are more aggressive in taking offers or in hitting bids. By comparing the distribution of today's TICK readings to the recent distribution, we conduct a running assessment of trader sentiment and whether it is bullish (more positively weighted than the past eight days), bearish (more negatively weighted than the past eight days), or neutral (similar to the past eight days).
It is the distribution of TICK values--and not any single reading in itself--that is significant, indicating shifts in trader sentiment. The beauty of the indicator is that it measures sentiment via trader actions, not their stated beliefs. By viewing TICK distributions in relative terms--comparing today's market to recent markets--we can learn more about those shifts in trader sentiment than we can by focusing on the absolute value of the TICK readings.
A quick and dirty way of accomplishing this is to subtract the median value of the TICK for the lookback period (+237) from each closing one-minute value. If this Adjusted TICK, when cumulated, creates a positive sloping line, you know you have net relative positive sentiment. If the summed values of the Adjusted TICK create a negatively sloping line, you know you have relatively bearish sentiment.
Composite NYSE TICK readings (adjusted for recent lookback periods) are summarized daily on the Trading Psychology Weblog. (Note: the Weblog measure uses 10 second readings of the TICK, not one-minute values). In the third post in this series, I will show how these composite readings make the TICK relevant and useful for longer timeframe traders. The best indicators, I find, are ones that tap into the psychology of the marketplace itself.
Saturday, May 10, 2008
What the Cumulative NYSE TICK is Telling Us About Market Psychology

Recall that the NYSE TICK is a measure of very short term sentiment across the broad universe of NYSE issues. When a stock trades at its offer price, that contributes +1 to the NYSE TICK. When a stock trades at its bid price, -1 is added to the TICK. These readings are summed for all NYSE stocks every five seconds. As a result, a TICK reading of +500 means that, at that moment, 500 more stocks are trading at their offer price than at their bid. This means that traders are sufficiently bullish on stocks that they're more willing, on balance, to be paying the offer price than the bid. When sellers are more aggressive, we'll see negative TICK readings, suggesting that traders are sufficiently motivated to get out of stocks that they'll settle for the bid price.
The adjusted TICK takes the raw one-minute TICK values and subtracts from each of them the average TICK one-minute TICK reading over the past 20 trading sessions. As a result, the adjusted TICK tells us whether we're seeing more or less buying sentiment *on a relative basis*: relative to the past four weeks of trading.
If we cumulate these adjusted TICK readings over time, the resulting line (see chart above) provides an excellent picture of how sentiment is unfolding from day to day. Note that sentiment turned sharply positive from mid-March through early April, with the cumulative adjusted TICK trending steadily higher.
Since that time, the S&P 500 Index has moved to new highs, but the cumulative adjusted TICK line has not. Interestingly, we are also seeing weaker money flow readings and fewer stocks making fresh 52-week highs over this same period. Not surprisingly, the index has had difficulty sustaining its move above the 1400 resistance region.
We've had a nice move from the March lows. It will take an influx of buying sentiment to keep that move going, however.
RELATED POSTS:
The Cumulative NYSE TICK
Capturing Trends With NYSE TICK
.
Tuesday, April 24, 2007
Making a Friend of the Sentiment Trend
 A number of my posts have drawn upon the NYSE TICK as a measure of sentiment among large market participants. Recall that the TICK represents the number of NYSE stocks trading at their offer price minus those trading at their bid prices. When we see sharp rises or drops in TICK, it means that a large number of stocks are simultaneously trading at offer or bid. This most often happens because institutions are buying or selling baskets of stocks.
My most recent trading has greatly benefited from looking at the trend in the NYSE TICK and trading in that direction. For example, I showed how an emerging average of the TICK--assessing how current TICK values compare to the average level up to that point in the day--can help keep us on the right side of large trader sentiment. We can also gauge the TICK vs. its own regression line to track the trend of sentiment.
In the chart above, I've taken a relatively simple strategy. I'm charting a 10-minute moving average of the TICK (pink line) vs. the ES futures (blue line). The red horizontal line represents the average NYSE TICK level over the past 20 trading days.
One thing I look at as the day unfolds is how much time we're spending above or below that horizontal line. That tells me if we have above average or below average buying sentiment during the day.
The second thing I look for is whether, over time, the area above the horizontal line is expanding or contracting. That tells me something about the trend of sentiment. We can see above, for example, that the trend of the TICK was down through much of the morning. That had me leaning to the sell side.
Third, I look at the bounces and dips in the 10 minute average of the TICK. If we get lower high and lower lows, I view that as a trend in sentiment, and I'll use those TICK bounces to sell the market. Conversely, if I see a drying up of the 10 minute average TICK following a meaningful decline--such as happened in mid-afternoon above--I'll use that as a possible occasion to buy.
Finally, the moving average of the TICK also nicely alerts us to those inefficiency patterns I've mentioned in past posts. Those occur when we get readings in the TICK that are above the horizontal red line, but that cannot push price to higher levels. Such inefficiency dominated the morning trade and was a nice tell for a selling strategy.
The last couple of weeks I've focused on refining my morning trading around trends in the NYSE TICK. So far it's been quite promising. Ken Wood of Woodie's CCI Club jokes that, "We don't need no stinkin' prices". He simply trades off patterns in the indicator itself. While I'm not quite to that point vis a vis TICK, I'm pretty close. If we get a bounce that can't push price higher, I'll sell and cover and the next TICK thrust downward and vice versa. Such a strategy does not lead to huge gains per trade--holding times are short--but my win percentage has risen as a result and losses are quite contained. The key is being patient enough to establish an unfolding trend in the TICK and then trading within that larger trend.
Friday, March 16, 2007
Learning How To React To Changing Markets

Back in the late 1990s, I decided to take trading very seriously. I began to archive market data in Excel, starting a collection of one-minute price and indicator data that I have maintained faithfully since 1998. I also printed out charts such as the one above, in which I viewed each major indicator vs. stock index price and identified patterns that occurred at important turning points. To this day, I have a stack of printed charts that fills quite a few filing cabinets.
When you notice a pattern and then notice it again, and again, and again in different variations, eventually you become sensitive to what is pattern and what is noise. The process is very similar to the training of a radiologist, who learns to read X-rays or scans by seeing very many normal and abnormal ones, or a pathologist, who--after seeing many normal and abnormal tissue samples--becomes very sensitive to what is disease and what is expectable variation in health.
Most important, seeing patterns again and again enables a trader to recognize those in real time as they are forming. As I stress in my book, I have found simulated trading--particularly simulators that enable you to play and replay market days--to be especially powerful as learning devices. Seeing patterns unfold again and again significantly reduces one's learning curve. Once you've seen a trading pattern unfold dozens and dozens of times, you develop a feel for its future unfolding. That's the process of implicit learning I've described in past posts.
And that is how you learn to react to changing markets: By experiencing many, many market changes.
Wednesday was a particularly valuable day for observing patterns, because so many of them occurred within the span of a single trading session. I have labeled the above chart with four letters to indicate some of the more noteworthy patterns:
Point A) Notice how, in the opening minutes of trade, the market is much more reactive to the drops in the NYSE TICK than to the bounces at the very start of the session. When we jumped to positive TICK readings, these were followed by immediate selling that took us back into negative TICK territory. By the time we saw buying at point A, even the strong TICK of +1000 couldn't vault us above the opening highs in the S&P index futures. I refer to this pattern as inefficiency: Quite simply, if we measure the amount of upward price movement we are getting per unit of NYSE TICK, it is quite low. It's like a runner who is huffing and puffing, but getting nowhere. Such inefficiency is common at market turning points: sentiment is no longer able to sustain a short-term trend. Before we see a surplus of selling, we'll see buying sentiment (positive TICK) that no longer can move price higher. I generally sell those inefficient TICK bounces, particularly when they're occurring near tops of ranges.
Point B) Commencing at point B, we see that we get a pattern of lower highs and lower lows in the NYSE TICK. That is the classic pattern of a short-term market decline. As long as that pattern holds, you keep selling the TICK bounces. The thrusts to negative TICK, especially on elevated volume, are opportunities for the active trader to take some short-term profits off the table, even as he or she might ride a core position toward a designated target (such as the pivots mentioned in the Weblog). Recall that the NYSE TICK is telling us the relative balance of stocks trading at their offer price (upticks) vs. bid price (downticks). When we see a distribution of TICK values that is tilting downward (lower highs, lower lows), it means that bearish sentiment is trending. Those are markets we can ride lower.
Market Low) The market low for the day occurred on a very negative thrust in the TICK. A pattern that doesn't show up on the above chart, but that I had mentioned in my blog post that day was that, while the ES contract was making new lows for the correction, other stock indices (such as NQ and ER2) were not. If a majority of issues are not participating in a move, there's an enhanced likelihood that the move will not be sustained. Notice, however, that someone *only* looking at intraday data (such as the above chart) would have missed this vital longer-timeframe pattern. The important point here is that patterns are generally nested within larger patterns, and it's those larger patterns that create trends. Even very active traders need to train themselves to see patterns present in daily and even weekly data. Someone with their nose in the one-minute data on Wednesday would have been completely run over at the market low if they were short, oblivious to why the market had suddenly turned.
Point C) Notice the shift that occurs following the market low. We quickly go from a downthrust toward -1000 TICK to an upthrust above +1000 TICK. This creates a breakout in TICK, revealing a sudden surge in bullish sentiment. Even more important, we're no longer seeing the inefficiency associated with Point A. Rather, price is quite responsive to the broad upticking among stocks. By the time you get another thrust down below -500 TICK, price is well off its lows. What that tells us is that, unlike early in the day, high TICK readings are being followed by further high TICK readings: the bullish sentiment is sustained from minute to minute. This tells us that longer time frame participants have identified the market lows as value and are jumping into the market, lifting offer, to take advantage of bargain prices. This transitional pattern--from TICK extreme to opposite TICK extreme, with price responsive--does not occur very often, but can be seen at major market turns and at times when the market is roiled by unexpected news and economic reports.
Point D) At Point D we have the pattern from Point B, but in reverse. Now we're seeing higher TICK highs and higher TICK lows. Bullish sentiment is now uptrending. That is a great indication that we can afford to ride long positions and even add to them on TICK pullbacks. In an uptrend, successive TICK lows will occur at higher price lows; in a downtrend, successive TICK highs will occur at lower price highs. By the time we hit Point D, bouts of selling can no longer move the market lower. They merely serve as further encouragement for the bargain hunters.
Seeing patterns on a chart is only the first step in learning how to react to changing markets. The chart review tells you what to look for. The hard part, then, is to make the transition from chart review after the fact to recognition of patterns in real time. That's a frustrating time in the learning process, as you'll first make progress by recognizing patterns a bit too late to truly profit from them. But it is better late than never. Eventually the patterns become such second nature that you can see them well in advance, just as I noted the emerging divergences minutes before the market low.
No amount of positive thinking or empty-headed glorification of "you are what you believe" can substitute for knowing what patterns to look for and then immersing yourself in those patterns so thoroughly that they become part of your perceptual apparatus. That is true whether you're a scalper noting patterns in a depth-of-market screen; an active trader trading off the one-minute NYSE TICK; or a swing trader playing off Woodie's CCI patterns: learning to react to changing markets means that you shift your perception before the market makes its shift.
Monday, October 27, 2008
What the Cumulative Adjusted NYSE TICK Line Is Telling Us

In the chart above, we have a plot of the Cumulative Adjusted NYSE TICK Line (blue line) plotted against the ES futures (pink line). Recall that this line simply adds together the one-minute readings of the adjusted NYSE TICK, much like an advance/decline line (see this post for calculation of the adjusted TICK). As we plunged to intraday lows on October 10th, we made a low in the cumulative TICK line; as we've now moved back to those lows, the line has held at much higher levels in a dramatic divergence. What gives?
The TICK is a measure of stocks trading on upticks versus downticks. It begins its calculations with the start of trading in NY and ends when the NYSE closes. As a result, the TICK does not account for action that occurs overnight, between the U.S. market close and the next day's open.
If we take a look at the S&P 500 Index (SPY) from the start of September, we find that the market lost almost 42 SPY points (approximately 420 ES points). From the start of September up to that October 10th inflection point at which the number of stocks making new lows hit its highest level (see chart), SPY lost 3.29 points between the NY close and the next day's open and lost 34.8 points between the NY open and close. From October 10th forward, SPY has lost 8.46 points during overnight trade and, during the day session, has actually gained 4.8 points.
The cumulative TICK is capturing the fact that buying pressure has been exceeding selling pressure during the day trading sessions from October 10th to the present. Indeed, during that time, the S&P 500 Index--if we look at day session only-- has risen in value. This is a clear shift in regime and suggests that weakness in equity markets from October 10th forward has shifted to the European and Asian markets. That weakness prompts the U.S. market to open lower, but has not led to further net selling initiated in the U.S.
This morning, as of my writing, we're seeing a potential repeat of this same pattern. Markets were very weak in Asia, opened quite weak in Europe, and are trading lower in preopening trading in the U.S. stock index futures. We made new bear market lows overnight in the ES futures but, as I write, are trading about 1.5% above those lows. Should we build value during the regular trading day above these lows, I will be leaning to the long side in my short-term trading, entertaining the hypothesis that, in this change of regime, the day markets in the U.S. have already seen their price lows, even as markets overall (due to overseas/overnight influence) have been weak.
What prompted this little investigation was a simple observation that a growing share of my intraday trading profits was coming from the long side, despite the overall weak market. That makes sense, given that many of my trades attempt to capture swings in the NYSE TICK (i.e., try to follow short-term buying/selling sentiment). I will continue to follow these swings in early action today, with a particular eye toward whether we sustain a positively or negatively sloped cumulative TICK line on the day. That will tell us whether U.S. traders during the day session are using overseas/overnight selling for bargain hunting, or whether they are succumbing to the global market weakness.
P.S. - On a related note, a very recent article just happens to look at overnight stock index futures action as a questionable gauge of day session strength and weakness. The posts below will provide some background on short-term trading and NYSE TICK. I'll send out a Twitter "tweet" during the AM to update how the day's cumulative TICK is behaving. For new visitors to TraderFeed, the Twitter feature provides a blog within a blog containing links to important market themes, news, and indicators. The last five Twitter posts appear on the blog under "Twitter Trader"; the entire list of posts (and automatic, free subscription to the Twitter feed) can be found here.
RELATED POSTS:
Cumulative TICK and Short-Term Sentiment
Trading With the TICK
Trading Breakouts With TICK
.
Friday, January 23, 2009
When Is There Significant Buying and Selling in the Stock Market?

You just sold the S&P emini futures, the market starts to go your way, and then it spikes upward and returns to your entry level. Is this fresh, significant buying that should lead you to scratch your position, or is it mere short covering that has little import for the general market trend?
One way of addressing this important question is with the NYSE TICK. Recall that the TICK is the number of NYSE issues trading on upticks minus the number trading on downticks. Another way of viewing this is that the TICK assesses the number of stocks trading at their offer price minus the number trading at their bid. When buyers are more aggressive, they will "pay up" to get into the market and the trade will transact when the instrument is trading at its offer price. Conversely, when sellers are desperate to bail out of stocks, they'll "hit the bid" and the instrument will transact at the lower, bid price.
NYSE TICK is helpful, because it is a real time gauge of very short-term sentiment across the broad list of stocks. When we create a cumulative line for the one-minute TICK values during the day, we find that uptrending markets tend to occur during uptrending cumulative TICK lines and vice versa. Gauging the direction of the cumulative TICK as the day unfolds is very helpful in identifying market trends.
Now suppose we have a TICK value that exceeds +1000 or plunges below -1000. That not only means that 1000 more stocks are trading at offer or bid; it means that they are doing so at the same time. This can only occur when institutions execute basket trades to buy or sell large segments of the stock market. An individual trader--or even a large trader at a prop house--cannot make 1000 stocks trade simultaneously at their bid or offer prices. It takes real buying or selling power to do that.
One way of defining significant levels of buying or selling is to look at the distribution of one minute high and low values for TICK and examine the standard deviation of these. Going back to the beginning of October, we find that the average one-minute high value for TICK is around +250 and the average one-minute low value is around -250. The standard deviation is approximately 450. That tells us that, roughly, two-thirds of all TICK values will fall between +700 and -700. About 95% of all TICK values will fall between +1040 and -1040, making values greater than +1000 or less than -1000 rare indeed.
If I've sold the market and, after going my way a bit, it bounces higher on +500 TICK, that by itself will not take me out of the trade. In a purely statistical sense, that is not significant buying. The same is true if I am long the market and we retrace on -500 TICK. It's when we get above +700 or below -700 that I look much more closely at the trade. It's when you start to get a cluster of such readings that you realize that the Cumulative TICK is shifting and that you need to think about an exit. And, of course, if the TICK moves toward or above +1000 or toward or below -1000 when you're short or long, that is very significant sentiment against your position and warrants genuine caution.
Less important than individual TICK readings is the distribution of TICK values over time. In the chart above, we see the first hour of trade for Thursday's market. The center blue horizontal line is placed at zero, and we have horizontal lines at the one- and two standard deviation points to the upside and downside. Click on the chart for a good view and take a look at whether the bars, over time, are distributed more above the zero line or below. Further look at whether more bars exceed the +1 and +2 standard deviation levels or the -1 and -2 levels. Clearly, the net distribution of TICK is skewed negatively, and we're seeing more bouts of significant selling than buying. That keeps me on the seller's side until I see clear evidence of a shift in the distribution of TICK values.
Knowing what is significant and what is not can be the difference between staying in a good trade and getting whipped out of it. Reference lines such as the ones plotted above can help you keep your eye on the true sentiment of the market. For more background on trading with NYSE TICK, the links below should get you up to speed.
.
Monday, November 05, 2007
NYSE TICK and Intraday Market Movement
Recently we looked at stock market volume and its relationship to intraday market movement, including the likelihood of hitting particular price targets. In this post, we'll examine the NYSE TICK and its relationship to intraday price behavior.
Recall that the TICK is a moment-to-moment measure of buying and selling sentiment. It measures the number of NYSE stocks that are trading at their offer price minus those trading at their bid. When buyers are eager to own stocks, they're willing to "lift the offer" and the stocks will transact at that offer price. When sellers are eager to bail out on stocks, they're willing to "hit the bid" and the stocks will transact at the bid price. A very positive or negative NYSE TICK number reflects broad buying or selling interest in stocks overall.
My Adjusted TICK measure updates the 20-day average NYSE TICK reading each minute of each trading day and subtracts that average from each new minute's reading. The Adjusted TICK thus tells us if the current TICK readings are above or below their 20-day average. When we add all the Adjusted TICK readings during a market day, we get a single number--the Cumulative Adjusted TICK--that tells us how much buying or selling interest (relative to the 20-day average) we've sustained.
Going back to July, 2003 (which is when I began collecting my Adjusted TICK data; N = 1094 trading days), we've had 299 days in which the Cumulative Adjusted TICK has been above +300; 255 days in which it's been between zero and +299; 251 days in which it's been between -300 and -1; and 289 days in which it's been less than -300. For labeling purposes, I will call these Groups I, II, III, and IV.
Here are the odds of hitting the R1 pivot-derived resistance level for SPY as a function of Group. The second group of numbers (in bold) show the odds of *closing* above R1:
Group I: 238/299 - about 70%; 186/299
Group II: 150/255 - about 60%; 66/255
Group III: 90/251 - about 35%; 20/251
Group IV: 73/289 - about 25%; 4/289
Here are the odds of hitting the S1 pivot-derived support level as a function of Group. The second group of numbers (in bold) show the odds of *closing* below S1:
Group I: 40/299 - about 13%; 4/299
Group II: 80/255 - about 30%; 10/255
Group III: 132/251 - about 55%; 57/251
Group IV: 225/289 - about 80%; 166/289
I also have data on the frequency with which we hit and close above/below the previous day's high and low prices as a function of Group. The data for those look very similar to the above data.
Clearly, the tendency of market participants to hit bids or lift offers during the day is well correlated with directional price movement. We are most likely to close above or below the target R1/S1 levels on very strong or weak Cumulative Adjusted TICK days.
Once again, these are correlational data only; we're looking at how Adjusted TICK is associated with price movement; how today's Cumulative Adjusted TICK correlates with today's price behavior. What we're finding is that volume tells us about how much movement we're likely to have; TICK tells us how much price directionality there's likely to be. The two together, as they unfold during the day, help us understand the type of day we're likely to get. More on that in my next and last post in this series.
RELEVANT POSTS:
Cumulative TICK as a Measure of Sentiment
Identifying Sentiment Trends With TICK
.
Thursday, April 23, 2020
Your Trading Edge Is *Inside* The Bars On Your Chart

In this post, we'll look at a somewhat similar indicator, the NYSE TICK. It is found on many charting platforms as $TICK. It tracks the number of stocks at any time trading on upticks versus trading on downticks. The chart above is from Sierra Chart, and I've used $TICK on e-Signal and other platforms that carry a full feed from NYSE. I like Sierra, because of the availability of TICK calculations specific to Standard and Poor's 500 stocks, Russell 2000 stocks, etc.
The important point is that both Delta and TICK are calculated transaction by transaction. As Trevor Harnett has observed, they are telling you what is happening inside the market bars. That is where important edges can be found.
There are many sources of edge to be found in the TICK numbers. As noted above, what they tell us is, at every moment, how many stocks are trading on upticks minus the number trading on downticks. That tells us, in real time, where we have buying pressure and selling pressure, and it tells us if that buying or selling pressure is increasing or decreasing. We can also use a moving average of TICK values to serve as a short-term overbought/oversold measure, and we can use a cumulative total of TICK values to track the trend of buying or selling and identify bigger picture trading opportunities.
Above is a snapshot from yesterday's market. The top panel is the NYSE TICK on a one-minute basis. I drew a yellow horizontal line at the zero level. The green line going through the NYSE TICK bars is a 15 period exponential moving average of TICK values. Where I've drawn yellow arrows are spots where price of SPY (bottom panel) has made a fresh high or low, but TICK values have dried up. That has led to short-term price reversals. Those TICK divergences can mark useful trading opportunities. Extremes of TICK can also alert us to the possibility of trend days in the market. Important changes in market direction are often accompanied by shifts in the distribution of NYSE TICK values.
It's the transaction-by-transaction data that reveal the psychology/sentiment of other traders in the market. If we look at those data in real time, we can see sentiment shifting and quickly jump on board those moves. Studying Delta and TICK patterns day by day gives you a sense of pattern recognition to trade the market's psychology with deeper insight and greater confidence.
Further Reading:
Tuesday, March 13, 2007
NYSE TICK Volume: Tracking The Sentiment Of Large Traders

My past posts have dealt with the NYSE TICK as a measure of sentiment and the tracking of large traders as a way of assessing market direction. In response to a reader question as to dollar volume flow in the market overall, let's see if we can integrate these ideas.
The integration is with an indicator we can call TICK Volume. Here is how it is derived: Each minute of the trading day, I take the reading of the NYSE TICK by averaging the high, low, and close for that minute. I then subtract from that reading the average one minute NYSE TICK reading from the past 20 trading sessions. That gives me the Adjusted TICK, which is cumulated on a daily basis and summarized as an index in the Trading Psychology Weblog.
Notice that the Adjusted TICK tells us whether we have above or below average tendencies of traders to transact at the market offer (positive readings) or at the market bid (negative readings). This makes the TICK a valuable sentiment measure, as it captures how eager buyers are to enter the market (lift offers) and how eager sellers are to exit (hit bids).
The TICK Volume measure, depicted above from the period December, 2006 to the present, takes the Adjusted TICK one step further by multiplying each one-minute reading by the ES volume for that minute. I cumulate the 1 minute readings into a single end-of-day measure that is positive if there is net tendency to lift offers and negative if there is net tendency to hit bids. We know from research linked above that ES volume is dominated by the largest market participants. By multiplying Adjusted TICK by volume, we weight the sentiment data to reflect what the institutions and large locals are doing.
We can see that, from December through February, the S&P 500 Index (SPY) ratcheted higher, but we saw lower highs in TICK Volume. These divergences were also evident in the data regarding stocks making new highs and in my Adjusted Dollar Volume Flow data. There is a concept in statistics called convergent validity: A measure should overlap other, known measures of that particular construct. The converging findings from TICK Volume, new high/low data, and Dollar Volume Flow suggest that they are capturing a similar construct, which I believe is related to the behavioral tendencies of institutional traders.
Clearly TICK Volume highlights the very negative sentiment during the recent market drop. Note, however, that the bounce in sentiment since that time has been relatively tepid. We have not seen large traders pile into the market, seeking bargains, and lifting offers to anywhere near the degree to which they were exiting the market during the downdraft. That has led me to question the sustainability of the bounce.
Over the past three sessions, we've been in a trading range, oscillating around an average price of about 1416-1417 in the June ES futures. Traders will be watching carefully for breakout moves from this range to determine whether we will see a fresh upleg off the recent lows or a test of those lows. One of the strengths of TICK Volume as a measure is that it captures short-term breakouts in sentiment quite nicely, as it updates each minute. I will be watching TICK Volume carefully to handicap the odds of an eventual breakout move.
Tuesday, February 18, 2014
Useful Trading Tools - Part One: NYSE TICK

Suppose you could follow every single stock listed on the NYSE and track every few seconds how many of the stocks were trading on upticks versus how many were trading on downticks. What would that information tell you?
A buyer who wants to own shares aggressively will execute with a degree of urgency and will pay up for those shares. Such lifting of offers will cause stocks to trade on upticks.
Conversely, a seller who wants out of shares aggressively will also execute with urgency and will accept the bid price. This hitting of bids causes stocks to trade on downticks.
By calculating the number of stocks trading on upticks minus those trading on downticks every few seconds, the NYSE TICK ($TICK on eSignal feed) is an immediate, real time sentiment survey. It is based on the actual transactions in a broad stock universe and thus represents what traders are actually doing, not just what they say they'll do in a survey.
One application of NYSE TICK is to take the intraday readings and create a cumulative line, similar to an advance-decline line. As you can see above, that cumulative line has been making fresh bull market highs. That tells me that market participants remain net buyers. Note how selling pressure was restrained during the most recent market tumble. That was a great tell that the down move was a correction in a rising market, not the start of a bear market.
There are many other applications of TICK as well. For instance, since 2012, individual readings that exceed about +900 or fall below -900 represent two full standard deviations from average. That tells us that there is significant buying or selling pressure across the broad stock universe. Note that such buying or selling has to be broad based, as you can only get those extreme readings if stocks beyond the S&P 500 list are lifting or selling off.
To get those extreme TICK readings where so many stocks are upticking or downticking simultaneously, we need to see institutional participants aggressively buying or selling baskets of shares. That is an excellent sentiment clue.
For instance, after early selling that took TICK to the -740 area during Friday's session, buyers entered in force and drove TICK above +1000. From that point forward, more stocks traded on upticks than downticks. That was a nice tell for the coming upward trend day.
And what if NYSE TICK readings stay pretty much between +500 and -500 for the day? That is often a good indication that institutions are not participating aggressively and that there is little directional demand or supply for shares. That can be a good clue alerting us to slower, rangebound trade.
So much of successful short-term trading boils down to rapid pattern recognition, derived from plenty of observation. I have archived one- and five-minute TICK readings for years and studied their nuances. For me, it's been a great tool for identifying who is in the market and which way they're leaning.
Further Reading: Interpreting Markets With NYSE TICK
Tuesday, January 22, 2008
NYSE TICK and Intraday Trending

 Note the distribution of the NYSE TICK through the morning per the above. We see higher highs and lower lows, suggesting more stocks being accumulated at the market offer; fewer transacted at the market bid. That tells us that sentiment has been steadily improving over that period. Note the blue moving average line (30 min) for the TICK; it shows an uptrend and is a nice, quick visual way of seeing how the TICK distribution is changing over time.
Because the NYSE TICK assesses transactions at offer and bid for all NYSE issues, it tracks buying and selling pressure in the broad market quite well. Above we can see that the Russell futures were particularly responsive to the positive sentiment (TICK lows occur at higher price lows). The fact that the Russell stocks have been outperforming the large caps this morning is also a sentiment indication per my recent post.
Shortly after writing this the market and TICK distribution turned downward, breaking the pattern of higher TICK highs and higher lows. Shifts in the TICK distribution don't catch exact market tops or bottoms, but are useful indications that intraday trends are coming to an end.
RELEVANT POSTS:
Assessing Trend With NYSE TICK
NYSE TICK: Small Caps and Large Caps
.
Sunday, April 01, 2007
Trading Techniques: A Collection of Articles
The response to my recent call for articles regarding the "how-to" aspects of trading has been quite positive. Bloggers have submitted their own work, but I've also had readers suggest sites and posts to me. As a result, I'll begin the first round of a "How To Trade" linkfest on Monday.
As an opening course for that meal, I went through the TraderFeed archives and pulled out the posts that I felt were most helpful in illustrating trading patterns and fundamentals. There's a lot to read here, so you'll want to pull out the topics of greatest interest to you.
* The NYSE TICK and why it matters;
* Tracking participation in falling markets and also in rising markets;
* Small cap stocks and the S&P 500 Index;
* Using Market Delta in trading;
* TRIN and market efficiency;
* NYSE TICK extremes over swing periods;
* Volatility in the VIX and what it means;
* VIX and put/call ratios: when both are elevated;
* Stock index performance from open to close;
* End of month trading bias;
* Smooth vs. choppy moves and what comes next;
* The role of large traders in the market;
* Tracking intraday new highs and lows in the market;
* NYSE TICK and momentum effects;
* Identifying market breakouts;
* Using NYSE TICK to think dynamically about markets;
* Identifying short-term demand and supply;
* Trading with the NYSE TICK: Part One, Part Two, Part Three;
* NYSE TICK and short-term sentiment;
* What we can learn from new highs and lows;
* The pattern of market reversals;
* The challenge of stop-loss exits;
* Blending system and discretionary trading;
* Analyzing market volume for short-term trading;
* Participation as a key market variable;
* Intraday new highs/lows and putting the indicators together;
* New highs/lows at swing time frames;
* What low volatility tells us;
* New lows and market momentum; here's a look at new highs and market change;
* The importance of the trajectory of market moves;
* Tracking the behavior of large traders;
* When to exit a trade;
* The importance of where we close;
* Tracking divergences when markets are at highs;
* A different way of looking at options data;
* Using data from the opening minutes of trade for trading ideas;
* What to look for during flat markets;
* Gauging whether the market is likely to trend;
* Momentum and reversal at swing time frames;
* Setting price targets for short-term trades and using pivot targets in trading;
* Oil prices and stock performance;
* Trading gaps to the upside;
* The importance of dollar volume flows;
* Principles of short-term trading;
* Using the trend of sentiment to frame trading ideas;
* What happens to stocks when option volatility is low;
* Testing trading ideas;
* Identifying and trading breakout moves;
* Tracing the participation of large traders in the market, especially through the use of volume;
* What to look for in good trade execution;
* Understanding market efficiency;
* Reversal effects at swing time frames;
* Understanding shifts in the distribution of sentiment;
* More on new highs and lows on a swing trading basis;
* Intraday new highs/lows and market turns;
* Opening range breakouts: identifying and trading them.
* Using NYSE TICK to trade short-term breakouts.
* Catching market changes with TICK.
* Using participation to qualify market moves.
* A useful trading principle.
As an opening course for that meal, I went through the TraderFeed archives and pulled out the posts that I felt were most helpful in illustrating trading patterns and fundamentals. There's a lot to read here, so you'll want to pull out the topics of greatest interest to you.
Want even more? You'll find that the articles page of my personal site also has a dedicated section to trading techniques. Here are the TraderFeed posts. For the most part, earlier posts come first in the order:
* The NYSE TICK and why it matters;
* Tracking participation in falling markets and also in rising markets;
* Small cap stocks and the S&P 500 Index;
* Using Market Delta in trading;
* TRIN and market efficiency;
* NYSE TICK extremes over swing periods;
* Volatility in the VIX and what it means;
* VIX and put/call ratios: when both are elevated;
* Stock index performance from open to close;
* End of month trading bias;
* Smooth vs. choppy moves and what comes next;
* The role of large traders in the market;
* Tracking intraday new highs and lows in the market;
* NYSE TICK and momentum effects;
* Identifying market breakouts;
* Using NYSE TICK to think dynamically about markets;
* Identifying short-term demand and supply;
* Trading with the NYSE TICK: Part One, Part Two, Part Three;
* NYSE TICK and short-term sentiment;
* What we can learn from new highs and lows;
* The pattern of market reversals;
* The challenge of stop-loss exits;
* Blending system and discretionary trading;
* Analyzing market volume for short-term trading;
* Participation as a key market variable;
* Intraday new highs/lows and putting the indicators together;
* New highs/lows at swing time frames;
* What low volatility tells us;
* New lows and market momentum; here's a look at new highs and market change;
* The importance of the trajectory of market moves;
* Tracking the behavior of large traders;
* When to exit a trade;
* The importance of where we close;
* Tracking divergences when markets are at highs;
* A different way of looking at options data;
* Using data from the opening minutes of trade for trading ideas;
* What to look for during flat markets;
* Gauging whether the market is likely to trend;
* Momentum and reversal at swing time frames;
* Setting price targets for short-term trades and using pivot targets in trading;
* Oil prices and stock performance;
* Trading gaps to the upside;
* The importance of dollar volume flows;
* Principles of short-term trading;
* Using the trend of sentiment to frame trading ideas;
* What happens to stocks when option volatility is low;
* Testing trading ideas;
* Identifying and trading breakout moves;
* Tracing the participation of large traders in the market, especially through the use of volume;
* What to look for in good trade execution;
* Understanding market efficiency;
* Reversal effects at swing time frames;
* Understanding shifts in the distribution of sentiment;
* More on new highs and lows on a swing trading basis;
* Intraday new highs/lows and market turns;
* Opening range breakouts: identifying and trading them.
* Using NYSE TICK to trade short-term breakouts.
* Catching market changes with TICK.
* Using participation to qualify market moves.
* A useful trading principle.
Wednesday, May 30, 2007
Trading Patterns: Identifying Transitional Structures

 With this post I'll begin a series on trading patterns for short-term traders. I refer to today's pattern as a transitional structure; it is a common sequence that marks the shift from one trend to another.
Above (top chart) we see the five-minute ES futures for Tuesday, 5/29 and below (bottom chart) we have the corresponding chart of the NYSE TICK. This particular transitional structure is one from a declining market to a rising one. In future posts, I'll display transitions from rising markets to falling ones.
The pattern begins with a very high volume decline on very negative NYSE TICK. If you're also tracking intraday new highs/lows among a basket of stocks or ETFs, this is frequently the point at which a maximum number of issues make concurrent new short-term lows. We can see that this high volume decline occurred a little after 12:00 Noon CT. This is the momentum low for the market. Whenever you see a major elevation of volume and a selloff across a broad range of stocks, you want to consider the possibility that a momentum low is being put into place.
After the momentum low, we typically get a decent bounce on strong NYSE TICK readings. This occurred around 13:00 CT. The solid TICK readings tell us that there is widespread buying interest across a broad range of stocks. That means that traders are finding some bargains at the lower prices and are accumulating shares. If the bounce occurs on weaker TICK readings (below +500, for example), it is much more likely that the rally is mere short covering. That often suggests that the market needs to go still lower to find that bargain-hunting among traders and investors.
After this bounce, we typically get a test of the momentum lows; frequently we get new price lows as a result of this test. This test often occurs on very weak TICK readings. Note that, after 13:00, we saw a very weak NYSE TICK, but price could not make new lows. This is the inefficiency pattern I've described in previous posts. If broad selling sentiment can't push the ES lower, you want to consider the possibility that the decline is becoming exhausted.
Another characteristic of these tests of momentum lows is that they invariably occur on lower volume. Note how volume steadily dropped from the point of the momentum low to the NYSE TICK lows after 13:00. This is yet another indication of selling drying up: the big traders are no longer participating to the downside.
Once the market successfully completes its test, we typically get solid buying on strong NYSE TICK readings. Volume will typically expand on this buying--an excellent indication that buyers are taking control. By making this identification early, you can benefit from the short covering that typically follows a market turn.
These transitional structures occur over varying time frames; no two are identical. The basic dynamics of the momentum peak, the subsequent test, the inefficiency, the drying up of volume, and the subsequent increase of volume on the countertrend move are common to these structures. With practice you can see these patterns emerge and use them for excellent short-term directional trades.
RELEVANT POSTS:
The Structure of Market Reversals
Tracking the Large Trader
When Do I Get Out of a Trade?
Five Principles of Short-Term Trading
Subscribe to:
Posts (Atom)


 Posts


