A common issue I hear from traders is that, if they miss an initial move in the market or in a stock, they have trouble participating in a potential trend. Indeed, sometimes out of the frustration of missing the initial move, they will find themselves fading it and turning a missed opportunity into an actual loss. Here is one tool I use to trade potential trending (directional) moves in the market and how I use it.
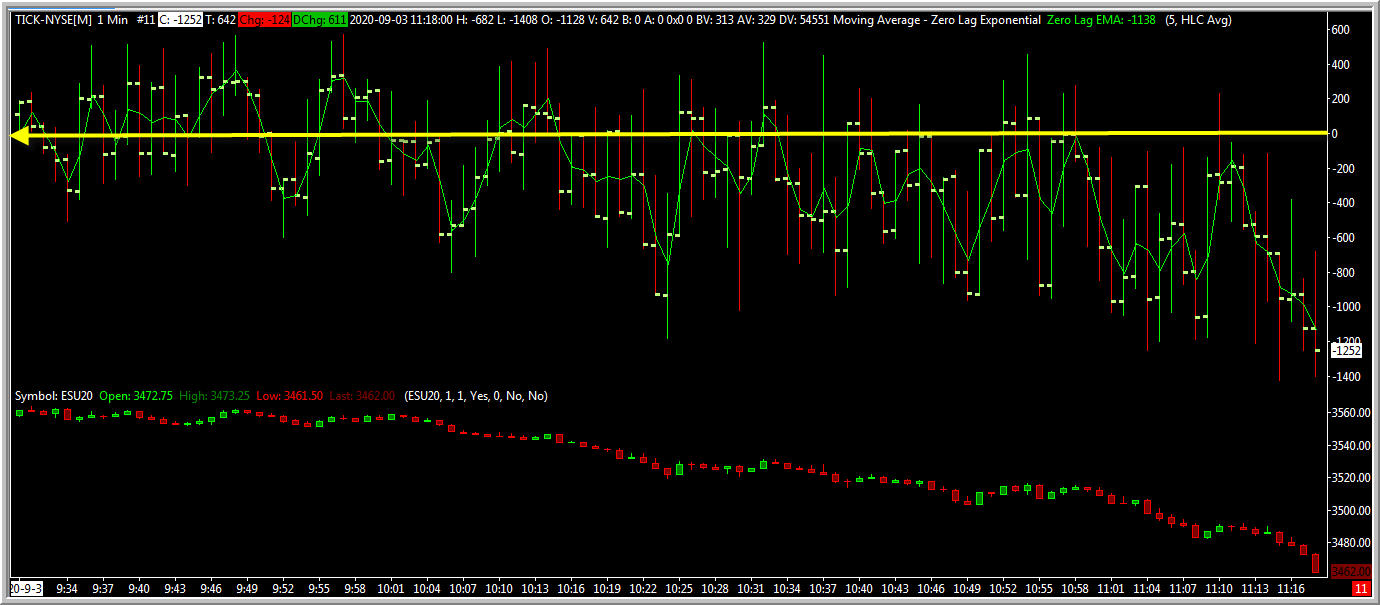
If you click on the chart above, you will see a one-minute chart of the SPX futures (ES; bottom panel) for yesterday's morning session. Plotted above is the NYSE TICK readings, with the zero line highlighted in yellow and a green line providing a five-minute zero-lag moving average. (Chart from Sierra Chart).
What we can see very early in the session is net buying interest (upticking), with the moving average of TICK above the yellow line. Notice, however, that the buying interest is modest and does not result in a higher early move in ES. Then we begin making lower lows in the TICK and lower highs, with the overall distribution of the TICK values falling mostly below the yellow zero line. As that occurs, we can see ES price moving lower. Indeed the bounces in the TICK, representing efforts at market buying, simply cannot be sustained and result in greater selling pressure and now a directional move down in ES.
The key identification is that buying pressure in stocks is waning and, when it occurs, can only move the index to lower price highs. Those modest bounces in TICK are great short-term entries to the downside, allowing us to ride the emerging trending move.
Notice how this approach fits very well with the idea of trading cycles within a trending market: when we get lower price highs with each bounce, those become opportunities to ride the direction downward. The cycles provide us with good risk/reward entries and can be used as opportunistic exits if we're trading around a core position.
Finding the right tools and conceptual frameworks for your trading will not guarantee you a great trading psychology, but it's hard to maintain a constructive mindset without those tools and understandings!
Added 9/4/2020:
For the past year, I have been studying buy and sell signals from common technical trading systems. What I find is:
1) A key is identifying technical indicators that are not highly correlated to each other;
2) A key is tabulating buy and sell signals for all stocks in a universe as your primary measure, not the technical reading for an overall index. This captures the breadth strength referenced in recent posts;
3) When calculated in this way, buy signals and sell signals for each system are not highly correlated at all. This suggests that strength and weakness are independent variables and should not be combined into composite indicators;
4) The edges associated with strength and weakness for different indicators are quite different. Modeling multiple edges without overfitting is a promising source for quant signals.
5) Ultimately our edge comes from looking at things others don't think of and doing a level of work others are not willing/able to undertake.
6) When you've done the hard research and see the edges clearly, that provides a level of confidence that cannot be derived from mere self-help techniques.
Video: Is Trading Your Path To Greatness?
.


