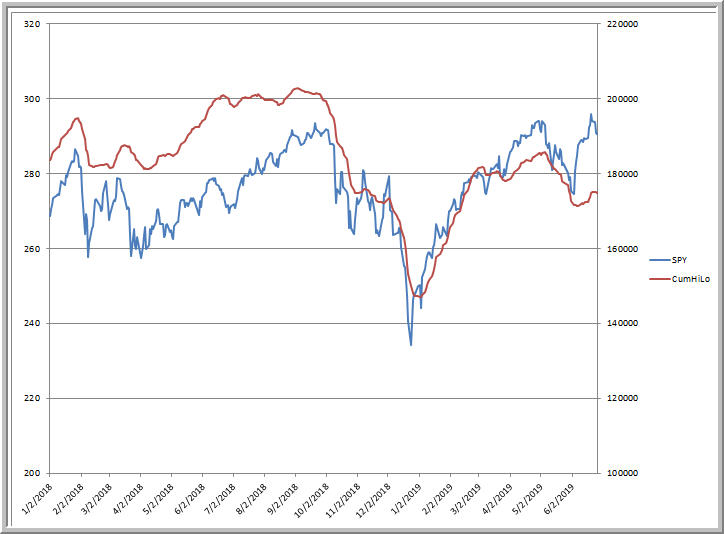
Above we can see SPY (blue line) plotted against a cumulative line of daily fresh 20-day new highs minus 20-day new lows for all exchange listed shares. (Raw data from Barchart.com). The idea here is that breadth will be expanding over time for strong markets and waning for weak ones. As markets top out, they become more selective in their strength, with certain sectors holding up well and others leading the way to the coming decline.
Note that we have made marginal new highs in SPY recently, but the cumulative line has failed to confirm. It appears we are making a lower high in that line currently, given the relative weakness of smaller-cap shares. This pattern of extended non-confirmation of the cumulative line showed up in 2007 prior to the large decline of 2008. I treat this information as a cautionary signal for the market longer term, but do not form a market opinion solely upon one such yellow flag.
Further Reading:


