Friday, April 29th
* I'll be talking with the Benzinga pre-market prep show at 8:35 AM today. We'll take a look at the psychology of the current market.
* I love this post regarding innovating and finding new trade setups from Ivanhoff.
* Stocks bounced nicely from overnight weakness yesterday but then stalled at prior peak levels and sold off sharply into the close. Breadth was not especially poor; fresh monthly new highs dropped to 915 and new lows rose a bit to 235. Technology/NASDAQ shares broke below their earlier April lows; housing stocks (XHB) also took a hit. That's not the kind of action you'd expect if the market was pricing in economic strength. Fewer than 50% of SPX shares are trading above their 3, 5, and 10-day moving averages. Let's see if that can bring in buyers, as prior short-term corrections have been able to do.
* A few things different about this most recent market drop: 1) higher volatility on the decline, with extreme selling on the NYSE TICK measure; 2) the market's inability to rally during USD weakness and commodity firmness; and 3) continued breakdown of correlations among market sectors. It's when we see shifts in volatility and correlation that we want to entertain notions of regime change.
* My intermediate-term measures are still nowhere near oversold levels. I'm quite open to toppy market action here and an intermediate-term correction within the bull cycle. I'm not expecting a sudden reversal to bear market mode. Note the sharp rise in VIX. My Pure VIX model has turned neutral; not yet in "fearful" territory.

Thursday, April 28th
* A look at the recent move to higher interest rates, which has affected the trading of higher yielding stocks and stock sectors.
* Stocks have fallen back after the Bank of Japan disappointment last night. We're now near the lower end of the recent trading range. I haven't noticed particular breadth weakness. Indeed, smaller cap indexes moved to new highs yesterday, as did a number of large cap sectors. Much of the index weakness has come from technology shares and the higher yielding sectors. New monthly highs rose to 1112; new lows rose a bit to 209. My intermediate-term cycle measures are stretched to the upside, however, so I would not be surprised to see further consolidation.

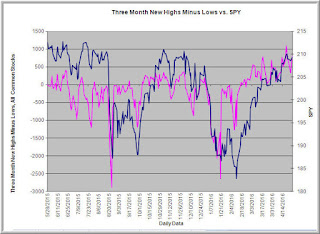
* Most of the corrective activity we've seen in stocks since the February low has consisted of sector rotation; hence no meaningful deterioration in the breadth numbers. Below we can see a chart of stocks across all US exchanges making fresh 3-month highs versus 3-month lows. It has stayed healthy throughout the recent move. One of the things I'm tracking going forward is the degree to which we see across the board weakness on pullbacks versus rotational movement.
Wednesday, April 27th
* Here's a valuable perspective on challenging hedge fund performance from the Mathematical Investor site.
* My measure of breadth volatility has reached low levels last reached in late November, 2015 before the market drop. Volume in stocks has also been lagging, which has been associated with subnormal forward returns. That being said, breadth improved yesterday, with 876 fresh monthly new highs and 189 new lows.
* Note the divergent sector performance in the past week, with higher yielding shares underperforming and commodity-related shares outperforming. (Graphic from FinViz). Rates have been rising ahead of the Fed; I'm keeping a close eye on this. Note also how technology has been lagging. Rising rates? Higher commodities? Low growth? Can't imagine a stagflation scenario would be a great one...

Tuesday, April 26th
* Excellent research links from Abnormal Returns. A great aggregation of quant research comes from Quantocracy. Lots of new ideas in these sources and lots of good blogs to follow.
* So far my trading experiment has been interesting. I've been placing far fewer trades, only trading when the market lines up on three time frames and a short-term signal is triggered. The signal comes from volatility bands drawn around event bars, so the bands reflect what I've been calling pure volatility (volatility per unit of market volume). The target is also based upon a movement in pure volatility units. The very structured nature of the risk taking has led to zero overtrading and a higher hit rate on trades. I'm placing only a tenth of the trades I was placing before, overall profitability in dollar terms has not been hurt, and of course risk-adjusted profitability has increased greatly. It is not clear to me that much of the trading we do adds value. By structuring rules around our best trades, we can create significant free time for research and life outside of markets.
* We saw increased selling pressure in yesterday's trade, but price held relatively well and has bounced a bit in overnight trade. New monthly highs dropped to 586 and monthly lows also dipped to 208. I'm still not seeing significant weakness across sectors; the central bank focus the rest of the week will dominate trade.
* We can see the market's strength in the cycle measure below. My long-term cycle research suggests that we made an important cycle low in February (the prior cycle low was October, 2014) and have been in a momentum phase of the new cycle. I ultimately expect the current cycle to take us to new highs, driven as much by dovish central banks and the need for yield as growth per se.

Monday, April 25th
* There is a psychological process that underlies self-confidence--and more specifically a cognitive process. Key is the recognition is that confidence is an expression of optimism--and optimism comes from finding structural similarities between present challenges and past ones that have been mastered. This is very relevant to the capacity to stick with one's ideas and weather drawdowns.
* I'm currently working on a project that tracks long-term cycles in the stock market. These cycles extend for months, not minutes or days. It is at this horizon that momentum effects most clearly emerge. For example, if we go back to 2006 and track the percentage of SPX shares that close above their 100-day moving averages, we find that the top half of readings (those in which there has been strongest breadth) result in an average next 50-day gain of +2.15%. The bottom half of readings average a next 50-day gain of only +.33%. The lion's share of the performance differential occurs after a 20-day holding period. Think about what that means for traders who develop longer-term ideas but have to trade them on short time frames and what that means for short-term traders. Also think about the implications for the current market.
* Stocks have pulled back in overnight trading, continuing to consolidate recent gains. None of my breadth measures suggest that we're yet at an oversold level, as can be seen below. This measure tracks SPX shares trading above their 3, 5, 10, and 20-day moving averages. (Raw data from Index Indicators).

* I'll be talking with the Benzinga pre-market prep show at 8:35 AM today. We'll take a look at the psychology of the current market.
* I love this post regarding innovating and finding new trade setups from Ivanhoff.
* Stocks bounced nicely from overnight weakness yesterday but then stalled at prior peak levels and sold off sharply into the close. Breadth was not especially poor; fresh monthly new highs dropped to 915 and new lows rose a bit to 235. Technology/NASDAQ shares broke below their earlier April lows; housing stocks (XHB) also took a hit. That's not the kind of action you'd expect if the market was pricing in economic strength. Fewer than 50% of SPX shares are trading above their 3, 5, and 10-day moving averages. Let's see if that can bring in buyers, as prior short-term corrections have been able to do.
* A few things different about this most recent market drop: 1) higher volatility on the decline, with extreme selling on the NYSE TICK measure; 2) the market's inability to rally during USD weakness and commodity firmness; and 3) continued breakdown of correlations among market sectors. It's when we see shifts in volatility and correlation that we want to entertain notions of regime change.
* My intermediate-term measures are still nowhere near oversold levels. I'm quite open to toppy market action here and an intermediate-term correction within the bull cycle. I'm not expecting a sudden reversal to bear market mode. Note the sharp rise in VIX. My Pure VIX model has turned neutral; not yet in "fearful" territory.

Thursday, April 28th
* A look at the recent move to higher interest rates, which has affected the trading of higher yielding stocks and stock sectors.
* Stocks have fallen back after the Bank of Japan disappointment last night. We're now near the lower end of the recent trading range. I haven't noticed particular breadth weakness. Indeed, smaller cap indexes moved to new highs yesterday, as did a number of large cap sectors. Much of the index weakness has come from technology shares and the higher yielding sectors. New monthly highs rose to 1112; new lows rose a bit to 209. My intermediate-term cycle measures are stretched to the upside, however, so I would not be surprised to see further consolidation.

* Most of the corrective activity we've seen in stocks since the February low has consisted of sector rotation; hence no meaningful deterioration in the breadth numbers. Below we can see a chart of stocks across all US exchanges making fresh 3-month highs versus 3-month lows. It has stayed healthy throughout the recent move. One of the things I'm tracking going forward is the degree to which we see across the board weakness on pullbacks versus rotational movement.

Wednesday, April 27th
* Here's a valuable perspective on challenging hedge fund performance from the Mathematical Investor site.
* My measure of breadth volatility has reached low levels last reached in late November, 2015 before the market drop. Volume in stocks has also been lagging, which has been associated with subnormal forward returns. That being said, breadth improved yesterday, with 876 fresh monthly new highs and 189 new lows.
* Note the divergent sector performance in the past week, with higher yielding shares underperforming and commodity-related shares outperforming. (Graphic from FinViz). Rates have been rising ahead of the Fed; I'm keeping a close eye on this. Note also how technology has been lagging. Rising rates? Higher commodities? Low growth? Can't imagine a stagflation scenario would be a great one...

Tuesday, April 26th
* Excellent research links from Abnormal Returns. A great aggregation of quant research comes from Quantocracy. Lots of new ideas in these sources and lots of good blogs to follow.
* So far my trading experiment has been interesting. I've been placing far fewer trades, only trading when the market lines up on three time frames and a short-term signal is triggered. The signal comes from volatility bands drawn around event bars, so the bands reflect what I've been calling pure volatility (volatility per unit of market volume). The target is also based upon a movement in pure volatility units. The very structured nature of the risk taking has led to zero overtrading and a higher hit rate on trades. I'm placing only a tenth of the trades I was placing before, overall profitability in dollar terms has not been hurt, and of course risk-adjusted profitability has increased greatly. It is not clear to me that much of the trading we do adds value. By structuring rules around our best trades, we can create significant free time for research and life outside of markets.
* We saw increased selling pressure in yesterday's trade, but price held relatively well and has bounced a bit in overnight trade. New monthly highs dropped to 586 and monthly lows also dipped to 208. I'm still not seeing significant weakness across sectors; the central bank focus the rest of the week will dominate trade.
* We can see the market's strength in the cycle measure below. My long-term cycle research suggests that we made an important cycle low in February (the prior cycle low was October, 2014) and have been in a momentum phase of the new cycle. I ultimately expect the current cycle to take us to new highs, driven as much by dovish central banks and the need for yield as growth per se.

Monday, April 25th
* There is a psychological process that underlies self-confidence--and more specifically a cognitive process. Key is the recognition is that confidence is an expression of optimism--and optimism comes from finding structural similarities between present challenges and past ones that have been mastered. This is very relevant to the capacity to stick with one's ideas and weather drawdowns.
* I'm currently working on a project that tracks long-term cycles in the stock market. These cycles extend for months, not minutes or days. It is at this horizon that momentum effects most clearly emerge. For example, if we go back to 2006 and track the percentage of SPX shares that close above their 100-day moving averages, we find that the top half of readings (those in which there has been strongest breadth) result in an average next 50-day gain of +2.15%. The bottom half of readings average a next 50-day gain of only +.33%. The lion's share of the performance differential occurs after a 20-day holding period. Think about what that means for traders who develop longer-term ideas but have to trade them on short time frames and what that means for short-term traders. Also think about the implications for the current market.
* Stocks have pulled back in overnight trading, continuing to consolidate recent gains. None of my breadth measures suggest that we're yet at an oversold level, as can be seen below. This measure tracks SPX shares trading above their 3, 5, 10, and 20-day moving averages. (Raw data from Index Indicators).


