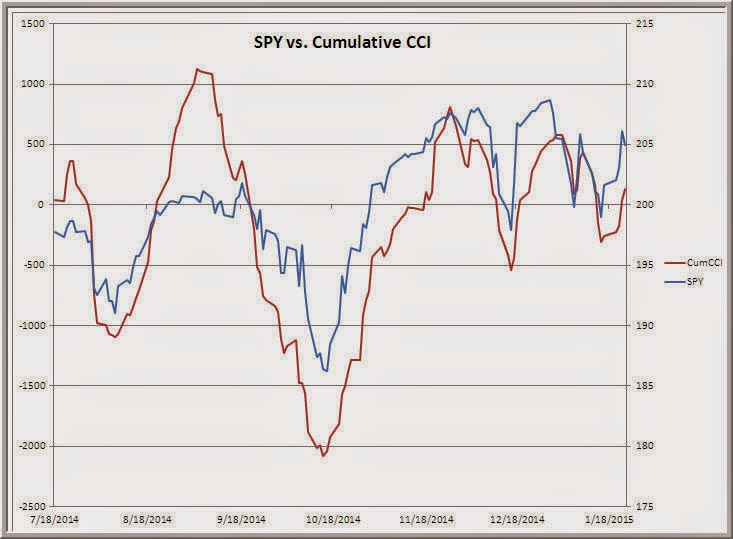


The above data track the cumulative buy vs. sell signals for every stock in the NYSE universe based upon the CCI, Parabolic SAR, and Bollinger Bands indicators (raw data and signals via the Stock Charts site). I find it interesting that the cumulative measures have largely lagged price gains since the October lows. This is what I would expect in an environment of weakening stock market breadth. In the wake of dramatic central bank actions this past week, I am watching breadth measures closely to see if the expansion of global QE breathes fresh life into stocks.
Further Reading: Tracking Strength With the Bollinger Balance
.


