9:00 AM CT - Very narrow range, with volume that started low and has gotten lighter over time. Buying and selling pressure are pretty well balanced on the Market Delta measure for ES, but we still see a positive skew to the TICK. If I had to trade this market (which thankfully I don't), I'd look for buying setups above that 1303 overnight level and play for an eventual test of yesterday's highs. But I'd need to see evidence of buyers lifting offers in ES more aggressively to pursue that idea. If we do test either end of the range mentioned earlier, make sure you see good volume pickup sustained on any breakout attempt; odds of false breakout are high, otherwise. I've got the rest of the day off; have a great trading session. Update tonight on the Weblog.
8:40 AM CT - So far, this is picking up where we left off the last couple of days. There continues to be a bid underneath this market, and we can see it in the distribution of NYSE TICK values. Those tell us that, as a whole, stocks are trading more often at their offer prices than at their bids. Buyers continue to be more aggressive than sellers overall. The TICK is not a weighted indicator, so small stocks contribute as much to its readings as large ones. That is why strength in the TICK tends to be reflected in strength in the secondary stocks, such as the Russell 2000 issues. That having been said, in the ES market volume opened predictably light and once again we see indications of a market driven by the locals. We'll get occasional sharp runs and retracements, with extended periods of back-and-forth as long as that's the case. My count of stocks making 5 min new highs vs lows has been positive all AM, based on the Trade Ideas screens. More in a bit.
8:20 AM CT - Good morning; this AM's updates will be more abbreviated than recently, as I'm taking much of the day off in birthday celebration. We've seen a narrow two-day range, and it wouldn't at all be surprising to see modest volume for the remainder of the week in anticipation of the holiday. Props to Jason Goepfert of SentimenTrader, who points out that the day before Labor Day has a bullish bias. That and the fact that we've seen a broadening of the market rally (see the Weblog for details) suggests that we should be testing recent highs in the near term. We sharply rejected the overnight lows at 1303, and should not break below that level if we're to see the upside today. Indeed, a break below 1303 would indicate fresh selling interest and would be an important short-term development. To the upside, 1308-1309 has been our barrier. Sustaining prints above that level would be an equally important short-term development. Back after the open.
Thursday, August 31, 2006
Techniques for Dealing With Emotional Disruptions of Trading
Every week I get a handful of emails from blog readers wanting advice on dealing with emotional interference with their trading. Many of these readers feel that they have solid trading methods and plans, but simply cannot follow these with consistency.
In an earlier posting, I explained that there are many reasons for problems of trading discipline. Not all of these reasons are due to primary emotional problems. Many traders suffer emotional disruptions of trading because of how they are trading.
The two main trading reasons for emotional interference are:
1) Improper risk management - Many traders are trying to make a comfortable living from an inadequate capital base. They are undercapitalized relative to their income goals, and this forces them to trade too aggressively. The drawdowns, as a result, are severe and create unnecessary frustrations. As I mentioned recently to one reader's surprise, I have yet to meet a trader who can sustain a good living from an account base of $100,000 or less. Perhaps there are people who can make 50-100% on their money year after year after year, but this is not the norm even among the world's money management elite. Taking large risks in hope of such rewards creates emotional impacts that are difficult to overcome.
2) Trading methods that don't fit a trader's skills or personality - You would not believe how common this is: traders attempt to make money in ways that don't genuinely exploit their strengths. Many times, when traders don't follow their trading plans, it's because those plans don't truly fit who they are. Daytrading might not exploit the analytical skills of a trader; many traders don't have the speed of mental processing to succeed at scalping. Similarly, traders with intuitive skills might be frustrated by trying to trade mechanical rules. Traders not only need methods that possess a reliable edge; they need those methods to fit who they are. A risk-averse person won't follow an aggressive system of scaling into trades; a highly active, distractible individual won't stick with long-term investing.
When emotional disruptions of trading *are* primarily due to emotional factors and not one's trading approach (or lack thereof), there are short-term techniques to change patterns of behavior that are quite effective. A little while ago, I helped write a training guide for helping professionals that summarizes these techniques; my upcoming book for traders has two chapters that are self-help manuals to hands-on change methods. For many people, months and months and years and years of psychotherapy are not necessary to change their patterns of thinking, feeling, and behaving. There are short-term change approaches that have been extensively studied in controlled research and validated for their effectiveness.
Unfortunately, most coaches and mentors of traders have not been trained in these brief methods. They try to help traders by repeating simplistic strategies that can be found in the self-help section of any bookstore. Not surprisingly, these strategies don't dent emotional patterns that seem to have a will of their own.
For 19 years at a medical school in Upstate New York, I not only applied brief therapy methods to medical students, physicians, and other professionals; I also taught these methods to the helpers training to be psychologists and psychiatrists. So it's natural that I try to teach some of these psychological skills to professional traders.
Here are some free resources from my personal site that might help you better understand the common emotional disruptions of trading:
Behavioral Patterns That Sabotage Traders - Part One
Behavioral Patterns That Sabotage Traders - Part Two
Changing How We Cope
Expose Yourself
Finding Solutions: How Traders Can Become Their Own Therapists
Remapping the Mind: Cognitive Therapy for Traders
Turning Your Trading Around - Part One
Turning Your Trading Around - Part Two
Turning Your Trading Around - Part Three
After you read those, feel free to email me with any questions about application. (My email address is included in the "About Me" section to the right). I'll post questions and responses to this blog over the holiday weekend. As I so often say to traders I work with, my goal isn't to become your psychologist. My goal is to enable you to be your own shrink.
Wednesday, August 30, 2006
Market Psychology Update for 8/30/06
11 AM CT - Just a quick note to point out that we did indeed get that negative distribution shift in the TICK, and that preceded our retracement to the bottom of the AM range in ES. As before, however, it's the ability to sustain expanding volume at the edges of the range that will prove decisive re: any potential breakout. If we continue to see the negative shift in the TICK, we could get a nice break below the AM lows. Volume, however, is quite low, so I'm not in the mode of chasing either weakness or strength. Have a great day.
10:07 AM CT - And yet more of the same, with a net positive TICK and difficulty sustaining market retracements. Volume still modest and locals still dominant. I'm watching for a possible downward shift in the distribution of the TICK, but if that doesn't materialize, I do think we'll continue to establish value at these higher levels. Have a great remainder of the trading day; update tonight on the Weblog.
9:35 AM CT - More of the same. Volume has continued moderate, and that made it difficult to sustain new highs. But we're not really seeing aggressive selling either. The result is a whippy market, typical of that dominated by locals. The Cumulative TICK is quite positive, which makes it difficult to sustain selling when stocks are trading at offer rather than bid. That will need to change to sustain a downside breakout.
9:15 AM CT - Selling volume dried up before we could pierce the lower end of the overnight range, setting that up as an important level. The NYSE TICK has remained positive through most of the session, reflected in strength in the Russell, and volume has remained moderate. That's contributed to what I mentioned in the previous update: a range bound trade so far. We have the upper end of the range at 1308 and the lower end at 1304 (short term) and we'll need some expansion of volume at those extremes, with large traders lifting offers or hitting bids, to get a breakout.
8:55 AM CT - That "tell" at 1307.75-1308 proved pretty good so far. Volume early on typical of a local driven market; no signs of institutions coming in to push for new highs despite bond strength. What volume we've had has been skewed toward hitting bids, leading us to retrace the pre-opening range. If volume continues low, I'd expect a range bound day; right now I'm looking for signs of expanding vs weakening volume as we print lower.
8:20 AM CT - A couple of large traders tried to push a breakout move at 1307.75 and quickly were rewarded with a few ticks in their face; they most puked out at halves. But what that does is tell us that demand wasn't there at 1308 even. Now if we see demand materialize at that level, we know it's new buying interest. This is an important way of viewing markets and levels.
8:05 AM CT - It's tough to argue with the macro picture here: Since mid-July, we've seen oil prices take a dive, bond yields retreat, and stocks rise. When the Fed offered a pessimistic tone in yesterday's minutes, the market rallied. The anticipation of interest rate restraint exceeded the fear of economic slowdown. That thinking may prove short-sighted in the long run, but it's part of the market's current psychology for the time being.
We're at the top of a multi-day range in the S&P 500 Index, with continued indications of buying interest and strength among stocks, as detailed on the Weblog. Under these conditions, the odds of taking out the prior day's highs are quite good. As always, however, we want to see how volume looks if we can print new highs. If we see signs of enhanced institutional activity lifting offers, that's when a meaningful breakout move can occur. Failure to print or sustain new highs would have us looking for a retreat toward the midpoint of the several day range. As I mentioned in my last post, the key is identifying what is happening as markets consolidate, not predicting. I'm happy to keep an open mind, even as I anticipate some carryover of recent strength.
Anatomy of a Market Breakout

One of the themes I've been trying to emphasize in my market updates is that reading the market means more than looking for chart patterns and oscillator readings. It means continually updating the strength and weakness of the market is as direct a manner as possible and then watching for patterns to emerge. We saw one such pattern unfold during Tuesday's trading: a consolidation, followed by an upside breakout.
Above is the chart I linked on today's Trading Psychology Weblog. We're looking at the market action following a sharp rise in the wake of the release of the Fed minutes. The market then consolidated between 1:25 and 2:15 PM CT before once again taking off to the upside. I was with a very successful Chicago trader--in his office as he was trading--while this move unfolded. He caught it beautifully, making a solid five figures in a matter of minutes. I'll have more to say about that master trader in my upcoming book. The important thing for this post is that the trader never once relied on chart patterns, traditional indicator readings, waves, angles, or any of the trading techniques that make up the bulk of the popular literature. He was seeing how large traders were trading and going with the players who ultimately move markets.
The chart, from the Market Delta program, shows repeated bouts of buying and selling from the 1:40 bar to the 2:10 PM bar. The shaded numbers at the bottom X-axis represent the cumulative number of contracts transacted at the offer price minus those transacted at the bid for each five-minute bar. Notice that we never see a lopsided dominance of volume at the bid during the market's consolidation. When the market attempts new lows at 1301.75 at the 2:10 and 2:15 PM bars, volume dries up--the lower levels do not attract further sellers. That is crucial information that someone looking at price alone would likely have missed.
Look, however, at the large numbers in black at the bottom of each bar. These represent the number of stocks in a basket I constructed that made fresh five-minute highs minus five-minute lows during each five-minute segment of the market. I obtained this information in real time from the Trade Ideas program. The basket of stocks was constructed to represent four major sectors of the S&P 500 Index: consumer, cyclical, technology, and financial. Each stock is actively traded and correlates well with the overall index and with its particular sector.
Notice that, as the consolidation proceeds, we are getting fewer net new lows vs. new highs among the stocks in the basket. The 2:15 PM bar was an especially interesting period, as we had 16 new lows over that time, but 19 new highs. What happened was that, even as some stocks made five minute lows, others were racing to new highs. It was a clear indication that many sectors were not participating in the weakness. This was a great early signal that the market's consolidation was coming to an end.
You can see from the chart that, once a number of stocks did not participate in the weakness and volume at the bid dried up at 1301.75, buyers entered the market aggressively, lifting offers. That was accompanied by an explosion of stocks making new five-minute highs. Notice that you could have waited for the confirmation of expanded upside volume and new highs and still entered the market profitably. As a rule, the longer the consolidation period, the more extended the breakout move when it does occur.
You don't have to predict breakouts; you can identify them as they unfold. My hope is that this blog, along with the updates, help you become better at those identifications.
Tuesday, August 29, 2006
Market Psychology Update for 8/29/06
10:00 AM CT/updated 10:38 AM - Sorry Blogger has been down for a while. Here's a useful market application. I track a basket of stocks representing the major sectors in the market. The program Trade Ideas alerts me every time one of those stocks makes a five minute new high or five minute new low. The market was selling off at 9:54 AM CT, but only a few of the stocks in my basket were participating with new lows. By 9:55 AM, we started to get a spate of five-minute highs. This was a great clue that the selling at that moment had dried up. I'll be in Chicago working with traders the remainder of the day; have a great trading session. Market wrapup on the Weblog tonite.
9:25 AM CT - The downward shift of the NYSE TICK and the expansion of volume at bid vs. offer continued after the release of the number, pushing the market below its overnight range. As long as we see this shift continue, we can expect a lid to the upside. Volume has picked up, and the large traders are hitting bids. Note the move back into the prior trading range of the past several days, setting up a probable test of the midpoint of that range around 1297-8.
9:01 AM CT - We had below average volume going into the consumer confidence number and, as a result, a range bound trade typical of that dominated by locals. Note the return to yesterday's average price. We've been seeing positive NYSE TICK, but somewhat more ES volume at bid than offer. Note the shift down in the TICK as a result of the number. Let's see if that continues and if we get a fundamental shift in the dollar and bonds as a result. Those moves tend to be most significant.
8:30 AM CT - My morning post took a look at mean reversion trading and how often we trade back to average prices for a given time frame. The odds in general are around 70%--much higher under certain market conditions of reduced volume, volatility, and momentum. This odds-based approach to hitting certain levels in the market can be tested for any price level, not just the average price. For instance, given yesterday's pattern of trend and momentum, among other things, the odds of our exceeding yesterday's price highs are somewhere around 67% or two-thirds. These are a couple of levels I'm looking at in the early AM trade.
Trading By Mean Reversion
A number of good trade ideas can be generated from the concept of the market's average trading price. Rather than trend following, this can be considered trading by mean reversion.
Let's start with the average trading price from the previous day's trade. The volume-weighted average price is posted daily to the Trading Psychology Weblog. A simple alternative is the pivot point defined by the average of the day's high, low, and close price.
Since September, 2002 (N = 998 trading days), 70% of all trading sessions in SPY have revisited their prior day's average trading price (defined by the high/low/close mean). This 70% figure has remained constant since 2004.
It makes sense that an index such as the S&P 500 would retrace many of its moves. It is subject to considerable arbitrage and, as I pointed out in a prior post, has shown poor trending properties. Think of it this way: The Spooz have averaged a daily gain of around .03% for the past several years. The daily range of the index, however, has been around a full percent during this time. Clearly there must be considerable backing and filling: much noise surrounding the market trend.
Since September, 2002, 88% of all trading days have traded above their prior day's close, but only 54% have actually closed higher. 85% of market days trade below their previous day's close, but less than half have closed lower.
Trading by mean reversion becomes a powerful strategy when we realize that the 70% probability of mean reversion expands significantly when markets are losing volume (volatility) and when they are losing momentum. This is one important reason I track such indicators as the NYSE TICK and the volume at the bid/offer in my market updates. When we see buying or selling pressure wane after a market move toward a range extreme, the odds are greatly enhanced of a reversion to the mean of that range.
Note that this is a trading concept that is scalable by time. During 2006, for example, the odds of the afternoon ES market trading back to the average trading price of the morning are about 75%. Once again, when we see waning volume and buying/selling pressure in the morning, those odds go way up. Tracking order flow during short term price ranges can assist the trader in finding mean reversion scalps.
Traders who utilize the Market Profile framework should be quite familiar with the mean reversion trade. When we test edges of the value range and cannot facilitate trade at higher or lower levels, a move back toward the point of control is a high probability trade.
I daresay a disciplined trader could make a living simply trading this pattern.
Monday, August 28, 2006
Market Psychology Update for 8/28/06
10:30 AM CT - Buying indications--the volume lifting offers and the TICK--have stayed positive all morning, but are slowing down. I want to see ES stay above its Friday highs--and for the buying pressure to continue--to sustain the day's uptrend. Note that if we move back into Friday's range--especially on a pickup of downside volume--we go back to targeting that average price (1298). Notice also that the NASDAQ is not yet above its Friday highs and is looking a little tired here. I wouldn't be surprised to see the market slow down into the noon hour. Hope you have a great rest of the day; update tonight on the Weblog.
9:33 AM CT - Hopefully you were able to see the persistent positive distribution of the TICK even on pullbacks and continuing dominance of volume at the offer vs. bid. A market that has negative historical expectations and persists in acting strong is sending a message, and it's important to be flexible enough to follow that message. That's why I like to say that I try to identify what the market is doing; not simply predict. In any event, we're getting continued buying--and an increase of volume with the buying--as we are at Friday's highs. That needs to be respected.
9:00 AM CT - Volume has been moderate, but what volume has been there has definitely been skewed so far toward lifting offers. The NYSE TICK has barely gone negative all morning. As mentioned earlier, tape action has to confirm any historical bias to move aggressively on the short side. The key to the day's trade will be to see if volume picks up and large numbers of stocks participate in any tests of the recent range extremes, or whether we stall out with low volume and remain range bound.
8:20 AM CT - Several analyses posted to the Trading Psychology Weblog over the weekend suggest a historical bearish bias over the next several days, so that's my initial leaning. We're approaching month's end and, seasonally, that tends to be bullish. The last week of August, however, has been down 6 of the past 10 years (but up the last 3 years). Of course, any bearish leaning has to be confirmed by the actual selling vs. buying activities of the market's largest participants. If large locals and paper are lifting offers and keeping ES above its average trading price from Friday (1298), market history won't amount to a hill of beans. What I'll be looking for in early market action is whether or not we get active participation in the index futures markets. We've been range bound for several days, and that's most likely to continue if volume remains light. The average trading volume for the first 15 minutes of ES trade this past week has been about 45,000 contracts. The second 15 minute segment of the day has averaged a bit over 30,000 contracts. As long as volume does not expand meaningfully from these parameters, I'll be hesitant to chase rising or falling markets near the range extremes.
How Would You Like to Own This Stock?
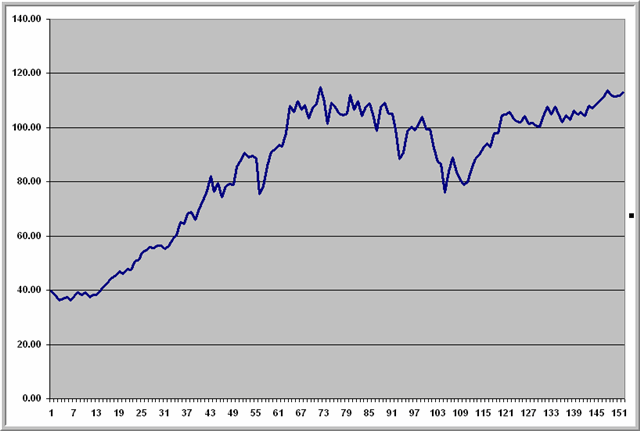
How would you like to own this stock? It pretty much tripled in price, retraced a portion of those gains, and now is knocking at the door of breakout--and alltime--highs.
What's more, there's quite a bit of bearish sentiment on the shares, as the stock has climbed a wall of worry regarding the firm's domestic and overseas operations. It has reported setbacks in its recent Middle East results and is losing money at home. A recent poll compiled by Mark Young showed 26% bulls, 42% bears on the issue. Indeed, traders have been bearish on the stock each week for the past 15 weeks, with this last week a lone exception by only the slightest of margins.
Clearly, someone is seeing value in this firm, even amidst the bearish news and sentiment. What is this resilient issue?
Multiply the stock price by 100 and recognize that each data point is a monthly close, and you have the U.S. equity market: the Dow Jones Industrial Average from 1994 through the present.
After all the bad news we've had, that's what the U.S. stock market looks like.
That's after the bond decline of 1994, after the Asia crisis of 1997, after the Long Term Capital Management bust in 1998, after the dot-com blowup from 2000-2002, after 9/11 and ongoing concerns over terrorism, after record deficits, after a troubled war in Iraq, after devastating hurricanes, after soaring oil prices, after rising interest rates from the Fed, after falling Presidential popularity, and after a weakening housing market.
I'm not sure what kind of bad news will tank this market, but I suspect it's going to have to be worse than the above. And if the news turns better? Perhaps those traders holding up U.S. shares are anticipating just such a possibility.
Sunday, August 27, 2006
Where We Can Find Directional Edges in the Market - Part Two
The last post found that sharp one-day changes in the number of stocks that rise above the envelope surrounding their 20-day moving averages have bullish implications in the near term. Similarly, sharp reductions in the number of stocks trading above their envelopes yield bullish price change expectations. It's when momentum is low that we see no directional edge 1-5 days out.
How about when stocks trade beyond their *lower* envelopes? Do sharp one-day movements at the bottom envelope also bring a directional edge to short-term trading?
When we've had an increase of 300 or more stocks trading below their lower envelopes (N = 84), the next three days in SPY have averaged a gain of .27% (53 up, 31 down). That is stronger than the average three-day gain of .12% (521 up, 394 down) for the entire sample. Interestingly, that edge is not present the next day, but emerges over the following days.
On the other hand, when we've had a large increase of 300 or more stocks *return* to their envelopes after having traded below the lower envelope (N = 86), the next three days in SPY average a gain of .29% (50 up, 36 down). Again, this is stronger than the average market performance.
Once again we can see that a movement of many stocks either well above their moving averages or back toward those averages has bullish outcomes several days later. When the change in number of stocks trading below their 20-day MA envelope is between +100 and -100 (N = 350), the next three days in SPY average a gain of .10% (193 up, 157 down)--no edge whatsoever.
The conclusion is that much of the market's edge--particularly to the upside--is the result of either strong positive momentum or strong negative momentum. When stocks are hugging their moving averages and showing little momentum, that's when we see mean reversion and little directional edge to trading over a several day period.
Once again, I will track these momentum measures on the Trading Psychology Weblog. As I write, we're seeing little short-term momentum over the past week.
Where We Can Find Directional Edges in the Market
In my last post, we found that whether the S&P 500 Index was above or below its 50-day moving average had little predictive value in itself over a period of many years. Rather, it seemed as though *momentum*--the amount that the index was above its average--contained useful information. When we were much above or much below the MA, returns tended to be more favorable than when we were closer to the average.
In this exploration, we'll apply moving average information a different way. Specifically, we'll look at thrust periods in which large numbers of stocks move either above or below a moving average benchmark. The benchmark is a two standard deviation envelope surrounding the 20-day moving average. What we're looking at are large changes from day one to day two in the number of stocks trading above or below those envelopes.
Since 2003 (N = 915 trading days), we've had 45 occasions in which the change in number of stocks (NYSE, NASDAQ, ASE) trading above their envelopes has been 400 or greater. Three days later, SPY has been up by an average of .42% (30 up, 15 down). That is much stronger than the average three-day change of .12% (521 up, 394 down) for the entire sample. When we've had strong upthrusts since 2005 (N = 23), the next three days in SPY have averaged a gain of .29% (14 up, 9 down), also above average. These findings are similar to yesterday's: a strong upthrust tends to continue in the short term.
How about if we consider the reverse situation? What happens when a large number of stocks that *had been* trading above their 20-day MA envelopes now move back into their envelopes? Since 2003, that has occurred 41 times. Three days later, SPY has been up by an average of .43% (29 up, 12 down)--also much stronger than average. Since 2005 (N = 22), a large one-day drop in the number of stocks trading above their envelopes has led to an average three-day change in SPY of .35% (15 up, 7 down). These findings are also similar to yesterday's: a strong downthrust tends to reverse in the short-term.
Finally, consider what happens when we have very little change from one day to the next in the number of stocks trading above their envelopes. That has been the case in the recent market. Since 2003, there have been 172 occasions in which the change in number of stocks trading above their envelopes has been within a range of +50 to -50. We find no edge at all--bullish or bearish--going forward three days. The average change in SPY is .12% (94 up, 78 down). It does seem as though short-term directional edges are present at momentum extremes, not when markets are little changed.
My next post will follow up by looking at thrusts above and below the lower envelope of the 20-day moving average. I will begin formally tracking these thrusts daily in the Trading Psychology Weblog.
Saturday, August 26, 2006
Do Moving Averages Matter?
You generally don't have to go very far in the trading world before hearing some guru expound upon the fact that a stock or index is trading above or below a moving average, crossing a moving average, or seeing its short-term average cross its long-term average. Do moving averages really make a difference?
I decided to take a preliminary look. I went back to 1950 in the S&P 500 Index (N = 14,290 trading days) and examined all days in which the $SPX was either above or below its 50-day moving average. This seemed like an appropriate time-frame for an intermediate-term trader.
Over that time, we had 9044 occasions in which the S&P was above its moving average and 5246 occasions in which we traded below the moving average. When the $SPX was above the moving average, the next 50 days in $SPX averaged a gain of 1.65% (5745 up, 3299 down). When $SPX was below the moving average, the next 50 days in $SPX averaged a gain of 1.85% (3328 up, 1918 down). The moving average did not appear to have a significant impact on future price change.
What *is* evident is the obvious: In bull markets, such as from 1995-1999, it paid to be bullish when the market was above its 50-day moving average. In bear markets, such as from 2000-2002, that was a losing strategy for bulls. Since 2003, buying dips below the 50-day MA has been quite profitable. In 2001-2002, that strategy was suicidal.
During most of 2006, buying above the 50 day MA has been a losing strategy; buying dips below the 50 day MA has, on balance, made money.
One way of summarizing all of this is that the behavior of $SPX around its moving average is more descriptive than predictive. It gives us a broad sense of the rules that the market is following at the time--which is not at all a worthless piece of information. At present, we are trading over 2% above our 50-day MA. If we assume that the market's recent rules will carry forward into the near future--a critical assumption, and one that is not always correct--this should not be a time to be adding to positions.
One other observation: If we focus on the percentage that we are above or below the moving average, some interesting findings emerge. At the upper group of outliers--instances in which $SPX has traded more than 10% above its MA--we see dates such as 1975, 1982, 1991, and 1998 well represented. In almost every single case (N = 59), the S&P was up 50 days later. Thrusts *much* above a moving average appear to have different expectations than normal rises above the benchmark. When $SPX is more than 5% above its 50-day MA (N = 1394), the next 50 days are up by an average 2.46% (985 up, 409 down). That starts to look more like a meaningful bullish edge.
Conversely, when we see $SPX more than 10% below its 50-day MA (N = 160), we see such dates as 1962, 1970, 1974, 1981, 1990, and 2002. Those represented important cyclical bottom regions in the market. Fifty days later, the market was up on average by nearly 5%, with winners outnumbering losers well over 3:1. Indeed, returns are superior on average when the market has been more than 5% below its 50-day moving average.
What that means is that returns are bullish when we've been 5% or more above the 50-day MA and when we've been 5% or more below the 50-day MA. Strong upthrusts have tended to continue into the next time period, and strong downthrusts have tended to reverse.
And when $SPX has been hugging its MA, within 2% above or below its 50-day line (N = 6035)? We see no bullish edge over the broad sample, with an average 50-day gain of 1.38% (3773 up, 2262 down). That is slightly below the average 50-day price change of 1.72% for the entire sample.
Just knowing if we're above or below a moving average or whether we're crossing a MA appears to be less important than the *degree* to which we're above or below that average. The bullish edge appears to occur at the extremes of market trajectory. I suspect that this principle might hold true over multiple time frames, creating possible edges for short-term traders as well as investors. More on that tomorrow, drawing upon indicators from the Trading Psychology Weblog.
Friday, August 25, 2006
Market Psychology Update for 8/25/06
9:30 AM CT - I'll be out for the rest of the day; have a great day. I'll be posting here and to the Weblog during the weekend. Notice how the 9:15 AM high in ES was *not* confirmed by either NASDAQ 100 or Russell futures, and notice how it occurred on lower volume, lower NYSE TICK, lower buying at offer, etc. Sure enough, that brought sellers in, creating one of those nasty reversals mentioned earlier. Hope this is helpful to you in terms of reading markets. Remember, a breakout from a range that comes back into its range has a high probability of touching the midpoint of that range. Yesterday's midpoint was 1297.25. Keep an eye on volume; if it dries up (as I think it will as we proceed toward afternoon) opportunity will likely be diminished.
9:05 AM CT - Blogger has been down this AM. I had an earlier post that didn't go through, but included it below nonetheless. The model reported in the Weblog so far has anticipated some buying strength, with a positively biased TICK leading the way. Volume has expanded to the upside, with large traders so far leaning that way. This puts us on track to test yesterday's highs; we'll want to see if volume--especially at the offer--expands on any such test. Remember, low volume is a local dominated market and that can lead to sharp reversals of moves.
8:55 AM CT - I'll be breaking early from trading today for a long weekend, but will update during the early AM. Volume is well below average, as might be expected for a late summer Friday. That immediately alerts us that the odds of getting large trending moves are reduced. It's also important to set profit targets more reasonably, given the anticipated lower volatility. In terms of volume at bid vs. offer for ES, it's pretty even, but there is some strength in the NYSE TICK, which has aided the Russell in very early going. The model reported in the Weblog entry for today showed a bullish leaning, but I'll need to see some decent setups to jump aggressively into this market.
Rydex Funds: A Different Measure of Market Psychology
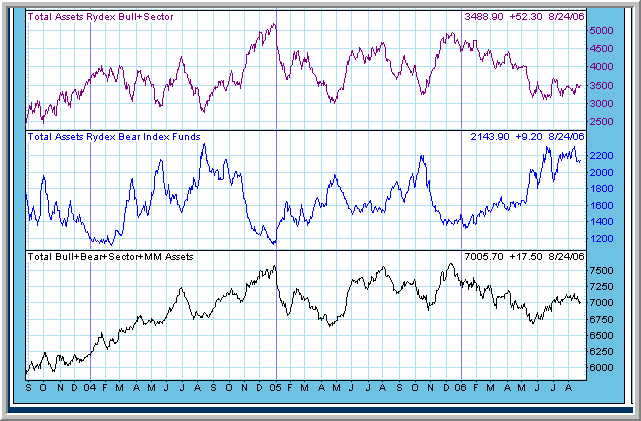
In my recent post, I emphasized that markets--like individual traders--have their own psychology. That psychology, captured in the put/call ratio and the amount of funds being devoted to options, turned out to be important to near-term returns.
The excellent Decision Point site tracks the cash flow in and out of the various Rydex funds. It turns out that this provides a very worthwhile intermediate-term picture of the market. The chart above, from the site, looks at funds in the bull and sector funds (top panel), bear funds (middle panel), and total bull, bear, and money market funds (bottom panel).
Several patterns to notice:
Bear market funds tend to expand and peak around intermediate-term market bottoms. That occurred in May and August of 2004 and in April and October of 2005. Most recently, we've seen a spike in bear market funds in June, 2006, with the market's decline.
Observe how, even with the recent market rise, bear market funds remain elevated at present. Rydex traders are treating the current market more like a market bottom than top--an indication of market psychology that is worth keeping in mind.
A second pattern that shows up in the data is that bull and sector funds tend to peak ahead of the S&P 500 Index. They peaked in late December, 2004; late July, 2005; and December, 2005. The bull funds also tend to be at relative low points when the bear funds peak, suggesting that traders are pulling money from bull funds to short the market--and are tending to do that at market bottoms.
Notice how the current market is at a relatively low level of bull funds. Once again, Rydex traders are treating the current period quite bearishly.
Finally, notice total Rydex fund assets. We grew those into late 2004, but since 2005 we have not seen an addition to those assets as the market has moved higher. Because bull funds dominate the Rydex assets, we see that total assets also tend to lead relative market peaks. So far, funds have remained well below recent peaks.
During the market's most recent rise, we've seen an expansion of bull assets and a decline in bear assets--as would be expected. Interestingly, total Rydex assets have dropped during this period, as traders have pulled holdings from money market funds. Rydex traders have been pretty good contrary indicators of market psychology over the past two years and, right now, they're hardly acting bullish.
Thursday, August 24, 2006
Market Psychology Update for 8/24/06
8:45 CT: Once burned, twice shy: the S&P 500 Index futures (ES) are trading slow volume in opening minutes ahead of the new home sales data at 9 AM CT. As my modeling noted on the Trading Psychology Weblog, I have no strong directional biases going into the day's trade. So I look for the kinds of setups described in the most recent Weblog entry. To this point, we're seeing a slight leaning toward contracts transacting at the bid rather than the offer, but the NYSE TICK is modestly positive and we have more advancing stocks than decliners. My slight leaning is to the long side, esp. if we can stay above the lows established after the economic report (1297.50), but I'm not in a rush to actively trade a slow market. More to come...
9:30 CT - Very much a local-dominated market, with slow patches interspersed with runs, and the runs generally reversing the previous runs. That leaves us with what, so far, is an inside day. Volume at bid continues to lead that at the offer, and as I'm writing, we're seeing some deterioration in the NYSE TICK. So the bears have the slightest of edges, but this is not a market that will follow through on trending as long as volume is low and institutions are out of the trade. There's a time to be concerned about the return on your capital and a time to be concerned with the return *of* your capital. Slow days, for me, represent the latter. I'll post again if there are new, important AM developments; otherwise, have a great day.
12:10 PM CT - Just quickly wanted to return and point out that volume is really slowing down here. It wasn't long after I posted at 9:30 that volume picked up to the downside, and that's been the way we've had it so far today: more volume at the bid than the offer, but overall light volume. Low volume days tend to not be trend days and, so far on ES, we remain inside Thursday's range. With volume slowing and the sellers not hitting bids as aggressively in the last hour, I'd be careful about chasing the downside. Have a great rest of the day; update on the Weblog tonite.
Dynamic Thinking and Trading Success

A while back, I wrote about the defining features of market pros. There are many factors that contribute to trader performance, of course, and many ways to succeed in the markets. One factor, however, particularly stands out in my experience: successful traders think dynamically. They are not locked into static trading ideas.
Yesterday morning's market action is a case in point. The above chart shows the ES market (red candles) on a 3-minute basis, with the bottom yellow bars representing volume. The overlaid blue lines are the NYSE TICK. As the morning update noted, the ES market changed character after the 10 AM ET housing data were released. Up to that point, we barely had a negative reading in the TICK: more stocks were trading at their offer price than their bid. Volume was quite moderate, with considerably fewer than 20,000 contracts trading on a rolling five-minute basis.
With the release of the data, volume expanded, and the vast majority of that volume was hitting the bid price in the ES futures. The NYSE TICK went solidly negative and then continued to register negative readings each 3-minute period. Even on a very short-term basis, volume tended to expand on declines and contract on rises, as large traders lined up on the side of the sellers.
The trader who went into the day with a fixed, bullish view got hurt. Other days, a fixed bearish perspective will put a trader under water. The successful trader doesn't so much predict the market as identify what it is doing. That means keeping an open mind to market action and being ready to switch from the long side to the short side (or to exit altogether) as conditions dictate.
Static thinking can be appealing. It is alluring to think that there is a single, unchanging order to the marketplace and that we--aided by our gurus--can achieve a privileged view of that order. It doesn't matter whether than fixed order is expressed as chart patterns, market waves, cycles, or some other contrivance. Static traders want rules they can count upon to make money, now and forever.
But there's a wonderful quote from George Soros in the book "Inside the House of Money" by Steven Drobny. Soros said, "I don't play the game by a particular set of rules; I look for changes in the rules of the game."
This is the essence of dynamic thinking in trading. Markets change their rules with regularity, based upon shifts in interest rates, currencies, economic conditions, commodity prices, sentiment, and institutional participation. Catching moves in markets, as with yesterday morning, requires that we see--in real time--the rules shift as they are turning. Which, by definition, means that we cannot be locked into any single set of rules.
Wednesday, August 23, 2006
Market Psychology AM Update for 8/23/06
10 AM CT - Hopefully you caught the market's change of character, as volume continued to pick up, including volume at the bid, taking us to new day's lows as the distribution of the TICK went quite negative. Catching those shifts in market character is essential to short-term trading success. My comments from 9:30 still hold, but note here that we're at the low end of the market's recent range and need to see downside volume continue to dominate if this is going to yield a breakout move to the downside. Have a great day; update on the day's action tonite on the Weblog.
9:30 AM CT - The housing data really knocked the wind out of the stocks, and it was across the board. Volume picked up, and it picked up at the bid, hitting small caps particularly. The distribution of the TICK also went southward. We remain rangebound, but we'll need to see some sustained willingness of large traders to lift offers if this market is going to surmount its early AM highs. My leaning is to sell strength as long as volume at offer cannot match volume at bid and as long as the Adjusted TICK runs negative.
9:10 AM CT - We continue to see modest volume and the sudden runs and reversals typical of ES markets dominated by locals. So far, we're inside the previous day and we're seeing a modest dominance of volume at offer vs. bid and a positively sloped Adjusted TICK line. I'm continuing to treat this as a rangebound market, needing the market to show me expanding numbers of stocks making new highs and expanding volume at the offer or bid before I'll assume any breakout move. As I write, weakness is showing up in the TICK and in the small caps; worth keeping an eye on.
Market Psychology: Why It Is Important
We are accustomed to thinking about the psychology of the individual trader, but the marketplace has its own psychology that makes a significant difference in its price behavior over the short-term. The best measures of market psychology are not polls of trader sentiment, as what traders say and what they do can be quite discrepant. Rather, we want to track what traders are *actually* doing in the marketplace.
Readers of this blog know that I track several measures of market psychology, including the NYSE TICK (number of stocks trading at their offer price minus those trading at their bids), the volume of ES futures trading at the offer vs. bid, and the put-call ratio. I have dealt with the TICK and the volume of futures at offer/bid in recent blog entries; let's look at the put/call ratio for an example of why market psychology is important.
In general, I've found that the put/call ratio does make a difference in modeling future results. I use the equity put/call ratio to eliminate the bias of hedge trading among index options. The past two days in the S&P 500 Index (SPY) have been flat from the open of day one to the close of the second day. The two-day equity put/call ratio, however, has been quite high at .92. (Thanks to Jason Goepfert of the Sentimentrader site for pointing out high put buying in the current market). In fact, of the 66 flat two-day periods in SPY that we've had since 2004 (periods that have neither risen nor fallen more than .10%), the present one has the highest equity put/call ratio of all.
In general, since 2004, flat two day periods have tended to resolve to the upside. This fits with my Micropsychology Modeler results posted to today's Trading Psychology Weblog, which found that periods of low trending among stocks have also had favorable short-term results going forward. Specifically, SPY has been up three days later by an average of .21% (41 up, 25 down), notably stronger than the average three-day gain of .075 for the entire sample (N = 660 trading days).
If we break the sample of flat two-day periods roughly in half, however, based on equity put/call readings, we see a significant pattern. When the put/call ratio has been above .70 during a flat two day period, the market has been up two days later by an average of .37% (20 up, 12 down). When the put/call ratio has been below .70 during a flat two-day period, the market has been up two days later by an average of only .01% (16 up, 18 down).
Indeed, when the put/call ratio during a flat two-day period has been above .80 (N = 8), the market has been up the next day and two days after on seven of those occasions.
What that tells us is that market psychology matters. When traders are bearish (buying a high proportion of puts to calls) and cannot push the market lower, it's telling us something important about the market's latent strength. Think of a flat market as a dead-even tug-of-war and the put-call ratio as an indication of who is putting all their resources into the rope-pulling. If you put all your effort into pulling a rope and can only get a standstill, it's only a matter of time before fatigue sets in and you're the one getting tugged.
=========
Additional analysis posted 7:00 AM CT: Tempering the above finding is the finding that two-day flat periods in which total equity option volume is below the 40-day average perform worse in the near term than two-day flat periods in which total equity option volume is relatively high. Specifically, when we've had a two-day flat period and low total option volume (N = 36), the next day in SPY has averaged a loss of -.08% (13 up, 23 down). When we've had a flat two-day period and high relative option volume (N = 30), SPY has averaged a gain the next day of .19% (19 up, 11 down). While the ratio of put volume to call volume tells us something about sentiment, the total option volume tells us about the speculative interest of options traders. Low speculative interest during a flat period, such as we've seen in the past two days, has been associated with subnormal returns in the short run.
The natural question to ask is, "What has happened when the put/call ratio is high in an environment of low speculative interest?" This has happened during 23 two-day periods since 2004, and returns have been subnormal the next day (average change -.03%; 9 up, 14 down), but better over two days (average change .15%; 13 up, 10 down). Five of the six very high put/call ratio two-day periods (over .80) were up two days later.
Bottom line: Bullish indication two days out, not necessarily for today. In terms of market psychology, sentiment is important, but so is the willingness of traders to speculate. Total option volume is as important as its distribution between calls and puts.
Tuesday, August 22, 2006
Market Psychology AM Update for 8/22/06
8:45 AM CT: Just a quick historical note. Monday was an inside day, and in general there are subnormal expectations in the next 1-2 days following an inside day. Since 2005, we've had 18 inside days in which the prior five days were up by more than 1%. The day after the inside day we were up 7 times, down 11 for an average loss of -.06%--weaker than the average one-day change. In general, inside days since 2005 (N = 61) have had weaker than normal expectations going out 1-3 days.
In the preopen, the market was living up to this expectation, following the European averages lower on the heels of a weaker than expected ZEW report on investor confidence in Germany. But the volume at the bid progressively lightened from 5:30 AM CT forward, and we rallied solidly out of the open. As my previous post noted, early AM volume should provide us with a good reading on whether we're likely to get a breakout from yesterday's range from this action. Thus far, 15 minutes into the trading session, we have pretty average volume but over 11,000 more contracts trading at the offer than the bid, with barely a negative NYSE TICK reading. Despite the above historical tendency, I am reluctant to short this market as long as large traders are dominantly lifting offers and pushing prices higher. More to come...
9:25 AM CT - Despite backing and filling and a slowing of buyers lifting offers, we continue to see more contracts trading offer than bid and an upside breakout in the NYSE TICK. As mentioned before, it's tough to short such a market for anything more than a scalp. So far, we're inside an inside day, but volume has been picking up to the upside.
9:50 AM CT - It's pretty discouraging for the bulls that the buying we've had thus far hasn't gotten the job done and lifted us above yesterday's highs. Volume has really tailed off since the move to day session highs. I'm looking for sell setups, but no rush to get in.
10:25 AM CT - Volume has tailed off, and we continue with an inside day within an inside day. The key from here is to see on moves up or down if large traders participate and volume significantly expands. We've seen little of that follow-through so far, but what we have seen has been more with the buyers than the sellers. We need to see much more aggressiveness among sellers if any downside is to be sustained today. That would show up as a downward shift in the distribution of NYSE TICK values. So far, however, the TICK is relatively strong. Have a great rest of the day. Wrapup on the Trading Psychology Weblog tonite.
What You Can Learn From the Opening Minutes of the Day's Trade
One of the things we can learn from the market's opening minutes is opportunity during the trading session ahead.
Much of my homework before the market open appears in my Trading Psychology Weblog. That's where I establish the market's short-term trend, whether the majority of stocks are gaining or losing momentum, and whether we're seeing more or fewer new highs or lows among stocks. The Weblog also includes modeling with these variables to see if there is a historical edge going into the next day's trade.
All this is well and good, but information gathered during the opening minutes of the day session can greatly modify the perspective from the market homework. As I note in this article, there are many clues in the early session regarding the likely volatility of the day to come, including whether volume is above or below average, the level of the VIX, and the size of the previous day's range. Such information was helpful yesterday in determining early on that the day was unlikely to offer a high level of trending opportunity. Sure enough, as the day wore on, it became clear that we were seeing an inside day in the S&P 500 Index.
There is a great deal we can learn from tracking volume patterns through the day. Most crucially, tracking levels of volume on a five-minute by five-minute basis allows the short-term trader see if the market is losing or gaining volatility--and whether the market is gaining participation from institutional traders. Because locals are in the market relatively continuously, the average market volume for a particular time of day can be thought of as the average level of participation from those locals (floor traders, proprietary traders making markets, etc.). When we see volume elevate significantly, it is a very good sign that traders with a longer timeframe are participating in the marketplace. Their participation is needed to sustain trending action in the markets.
In many ways, I think this post was one of the most important I have offered on the blog. It showed how the 3% of the largest trades in the ES futures account for 40% of the market's total volume--and how 40% of the market's smallest trades account for only 3% of the market's volume. When institutions enter the market, they don't make up a large proportion of the market's total trades, but they account for a good part of its volume. They leave their footprint in the market when we see five-minute volume figures elevate well above their average for that time of day.
Markets with above average volume--solid institutional participation--tend to break out of ranges. They will first break out of the overnight range, and then they will break out of the previous day's range. Many fine trade ideas can be predicated on just such breakouts, as we monitor directional tendency (whether volume is hitting bids vs. offers) and total volume. Whether those market moves are sustained will be a function of whether the breakouts attract additional participation, which is another way of saying: whether large locals and institutions jump on board. Markets with below average volume tend to stay rangebound and will offer many false breakouts.
Are we likely to see a trending market? Are we likely to break out of a range? Am I likely to take a little bit or a lot out of my trade idea? All of this is determined by volume information relatively early in the market day. My morning updates will include readings of relative volume to help traders assess the degree of opportunity in the day's trade. Knowing if today's market is dominated by locals or by "paper" makes a world of difference in terms of trading strategy.
Monday, August 21, 2006
Market Psychology AM Update for 8/21/06
9:15 AM CT: We came into Monday's market with a bearish edge from the historical models (see posting to the Trading Psychology Weblog for today and my earlier blog post here). The market traded weaker overnight and, from the open, we saw little buying pressure. The Adjusted TICK values were below zero, indicating that a majority of stocks were trading at the bid price, not the offer, indicating greater aggressiveness among sellers. Similarly, in the ES contract, the first half hour saw over 7700 more contracts trade at the bid than the offer. The problem is that *no one* was being truly aggressive this AM, with below average volume after the first five minutes of trade. Because volume corresponds to volatility so well on an intraday basis, it means we haven't had a lot of movement since the open. This occurs when it is a market dominated by locals, with relatively little institutional participation. Those days tend to not be trend days. Unless we see a pronounced pickup in volume this AM, we could see a pretty narrow day in a low VIX market. I pull in my horns in such market environments and, when I do trade, am quick to take what the market gives me. I'll add another update to this post if something more exciting materializes.
9:49 AM CT - So far, the sellers aren't getting it done, but neither are buyers. Here are the net number of contracts transacting at bid vs. offer on a fifteen-minute basis so far (negative numbers mean more contracts at bid than offer, and vice versa): -4444, -3267, +551, -1436, +2096 (as I'm writing). Quite simply, so far, we're not seeing ES traders hitting bids like they were in the first half hour. Volume, meanwhile, continues subnormal. ES 1303.50 - 1304 represents the immediate pre-opening highs. If we can test that area, I'd look to see if volume picks up, especially at the market offer. If not, I'd look at the overnight range as our current trading range and be very cautious playing for breakouts unless I saw expanded volume confirm moves to range highs or lows. It's one of those days where I've made exactly one trade, putting me up a whopping 3 ticks, and I'm pretty much done for the day unless something fresh materializes. "Take what the market gives you," is one of my favorite mantras, and if you can stay afloat in the rangebound, choppy markets, you'll be well-positioned to ride the larger moves when they do materialize. I'll post more if something meaningful comes up; otherwise, have a great rest of your day. Thanks for your support of the blog. The emails and comments have been most gratifying, and they're deeply appreciated.
1:55 PM CT: Tonight in the Trading Psychology Weblog, I'll post a chart which shows ES price vs. the cumulative line of number of contracts transacted at offer vs. bid. When the cumulative line is falling, we know that more volume is being done at the bid, meaning that sellers are more aggressive. As of my writing this, you can see the steady selling pressure through the day with the weak cumulative line. Volume also continues weak, however, which is contributing to what, so far, is an inside day in ES. We could get some volume pickup if we're able to take out Friday's low, but otherwise the day is shaping up pretty much as the 9:15 AM report suggested. Have a good evening.
A Framework for Thinking About Short-Term Market Behavior
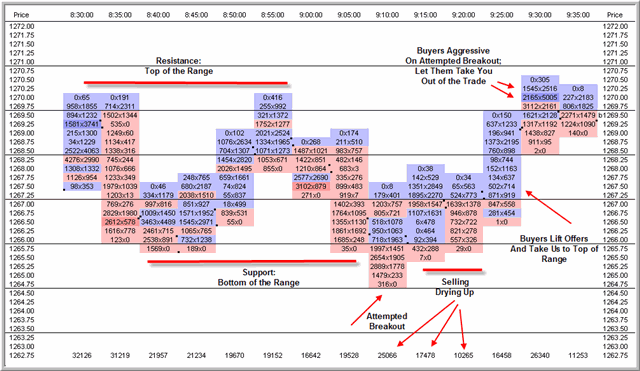
In this post, I would like to focus on the importance on having a framework for assessing short-term market action. The mid-morning market updates on TraderFeed, which will begin this AM, will draw upon this framework. The goal is to provide a useful model for thinking about market action as it is occurring.
Having a way to think about real-time supply and demand is crucial, because that tells us if the historical edge that we may have found in the marketplace is indeed playing itself out. The really good trades occur when we see a solid edge on a historical basis (here and as posted on the Trading Psychology Weblog's new modeling section) and then when we see supply and demand in real time lining up in favor of that edge.
Of the many posts to TraderFeed, the one on what short-term traders need to know has generated the most reader interest. Not only did it bring significant hits; it also led to many reader comments on and off the blog. It became clear to me that there is a tremendous latent interest in the trading world to learn more about how professional traders assess supply and demand in real time. Intuitively, I believe, traders recognize that chart patterns, indicator readings, and various calculated market levels are but dim reflections of actual auction activity occurring on the screen and in the pits. A more direct reading of trader sentiment and behavior can be found in the actual moment-to-moment buying and selling activity of traders and the location of trades within the bid-offer matrix. What we need as traders is a way of conceptualizing this activity: a coherent framework for thinking about markets.
Above is a chart of actual buying and selling activity for 8/10/06, as it appeared in a recent Trading Markets article. (Click chart for better view). Props to Market Delta for making these data available in real time.
First off, a bit of orientation. You'll notice price on the Y-axis of the chart and time at the top X-axis. Each bar represents a five-minute period in the ES futures. The bottom X-axis provides the total volume for the five-minute bar. Thus we can see volume expand and contract from bar to bar as markets move up and down. This provides a rough idea of supply and demand. Note, for instance, that volume expanded on the move to new lows during the 9:10 CT bar, but then contracted over the next ten minutes. As the market then rose in the 9:25 CT bar, expanded volume told us that buyers were taking control, helping us jump aboard that move.
Notice that within the bars, at each time and price, there are two numbers that are written as "first number X second number". For example, in the 9:10 AM CT bar, we can see at 1264.75 the entry "316 X 0". That tells us that 316 contracts traded at 1264.75 when that price was the market bid and 0 contracts traded at that price when it represented the market offer. When the number of contracts traded at bid exceeds those at the offer, the line in the bar is coded red. When contracts traded at the offer exceed those at the bid, the line is blue. The relative amount of blue and red within each bar provides us with a general sense for whether buyers or sellers are being more aggressive. Note, for instance, that sellers were quite aggressive during the 8:35 AM CT bar, but much less so during the next ten minutes. Buyers recognized this and bid up the market during the 8:50 and 8:55 AM ET bars. Was this an impressive rally? No, we can see that total volume (bottom X-axis) did not expand on the rise. Sellers no doubt saw that and helped push the market lower over the next 15 minutes.
Markets begin to make sense when you view them this way.
If we look at the numbers within the bars vertically (top to bottom/bottom to top), we can see if volume (and proportion of volume at the bid vs offer) is expanding as the market is falling or rising. Look, for example, at that market drop during the 9:10 AM bar. Was volume expanding as we made new lows? Absolutely not. Were we seeing expanded trade on the bid? No way. Sure enough, that turned out to be a false breakout to the downside. No big traders came in to hit the bids, a major, major clue that we were not going lower.
Now let's look at vertical volume during the rise at the 9:25 AM CT bar. Notice what happened at the 1268 price: Volume suddenly jumped. A closer market analysis on a one-minute Market Delta bar chart revealed that this jump occurred because large traders (ones trading over 100 contracts at a clip) were lifting offers at that price, responding to the market's jump above the prior bar's high. With volume expanding--and more volume occurring at the market offer--price moved steadily higher. No false breakout there!
I like to look at the bars horizontally, as well. Notice how selling dried up at the 9:15 and 9:20 AM CT bars. Not only do we see a drop in total volume; as we move from left to right, we see less volume occurring at the market bid. Sellers are becoming less aggressive over time. The volume action at 1265.75 going from left to right is a beautiful example of that. Conversely, note the shift of volume at 1267.75 and 1268 from the 9:15 to the 9:25 AM CT bars. More total volume and more volume at the offer told us that buyers were becoming more aggressive over time.
My purpose is not to sell you on this particular way of viewing markets or on Market Delta as a program. I have no commercial ties to Market Delta, but I do utilize it in my own trading and find it useful. What's most useful, however, is having a framework for conceptualizing the auction process in the marketplace: the dynamic shifting of interest among buyers and sellers. That framework helps me understand what is happening from moment-to-moment in the market and make decisions accordingly. It keeps me out of bad trades and alerts me to occasions when the market is following expectations from my market research.
It is not important that you share my framework, but it is important to have a framework. If you are looking at simple barcharts and reading oscillator patterns, you are looking at shadows on the market wall, not the raw data of what is actually occurring in the market itself. Your framework for those raw data may be Market Profile, depth of market displays, Market Delta, or something else. The important thing is to have a way to think about supply and demand that aids you with decision support in real time. That's what professional traders have, and they're only too happy to take the other sides of our trades when we focus on price alone and they detect shifting supply/demand.
Sunday, August 20, 2006
What Trend Research Suggests for the Coming Week's Trade
In a recent post, I raised anew the concern that trading strategies in the S&P 500 Index that are based on trend following (buying strength, selling weakness) have been notably unsuccessful. I attributed this, in part, to the expanded arbitrage trade between the futures and cash, between different futures products, and between futures and ETFs.
Let's see if this phenomenon affects S&P 500 Index ($SPX) expectations for the coming week.
The past five trading sessions have certainly constituted an upward trend, as we've closed higher each day. So let's go back to January, 1990 (N = 4190 trading days) and see what has happened after $SPX has made a five-day high in the previous session and made a five-day low five days prior (N = 729).
Four days later, the market was down by an average -.01% (371 up, 358 down). That is appreciably weaker than the average two-day gain of .14% (2314 up, 1876 down). If we limit the data to 2003-present (N = 153), the results are almost identical, with an average four-day change of -.01% and 76 occasions up, 77 down. I also note that, since 2003, when we've had an upward five-day trend, the returns over the next two sessions have been particularly subnormal, with an average loss of -.08% (72 up, 81 down). That is quite a bit weaker than the average two-day gain of .07% (2239 up, 1951 down) for the entire sample.
Think about what that means: Since 1990 (and during the recent bull market), traders have lost money on average when they have bought the market after a five-day period of upward trending.
Let's add a couple of limiting conditions, however.
First we'll look at five-day bullish trending periods that have also terminated on 20 day price highs (N = 489). That's what we have as of Friday's close. Now we see that the next four days in $SPX average a loss of -.07% (239 up, 250 down)--truly weaker than the average four-day change noted above. Another way of looking at this is that a five-day uptrend within a 20-day uptrend yields even weaker returns than five-day uptrends that do not terminate in 20-day highs (N = 240; average price change .13%; 132 up, 108 down). The more pronounced the market uptrend, the worse the returns going forward.
Finally, consider the VIX and what happens when our five-day uptrend occurs with a VIX below 15 (N = 269). Here again we see the pattern of subnormal returns four days out, with the average change -.01% (140 up, 129 down).
And when we have a five-day uptrend with a low VIX *and* a 20-day high (N = 188; as we saw on Friday)? Four days out, $SPX averages an abysmal -.11% (88 up, 100 down). Since 2003, that four-day return under those conditions (N = 61) has been -.27% (26 up, 35 down)!
Buying strength has lost traders money. Buying persistent strength has lost traders more money. Buying persistent strength since 2003 has lost still more money. I will not act upon this information this week in a mechanical fashion, but you can be sure that I'll be looking for sell setups where buyers lifting offers cannot move the market higher. As noted in my most recent post, I will be posting those intraday observations here during the new mid-morning updates. Also make sure you take a look at the Micropsychology Modeler results to be posted this evening on the Trading Psychology Weblog.
Saturday, August 19, 2006
Important Announcement to TraderFeed Readers
Starting this coming week, I will be posting modeling results to the Trading Psychology Weblog based upon the most promising Weblog measures. I call this the Micropsychology Modeler (see August 13 posting to the Trader Performance page of my personal site), because it tracks variables directly related to the psychology of the market itself, including volatility, sentiment, and momentum. The purpose of these postings will be to establish whether or not there is a significant bullish or bearish edge to the market over a 1-5 day time horizon. The target market will be the S&P 500 Index. Given that many individual equities (and other equity indices) correlate quite well with the S&P, this information should be relevant to a variety of short-term traders.
With the publication of the Model results, the material offered in the Trading Psychology Weblog and in TraderFeed will be tightly integrated in an effort to help traders improve their performance. Here is how I suggest you utilize the information that will be provided in the two sites:
1) Trading Psychology Weblog - This will provide the big picture for short-term traders. There will be links to valuable information sources, an assessment of intermarket forces, and an ongoing evaluation of strength and weakness in the market based on the aggregated trading patterns of thousands of stocks. Many of the market metrics summarized in the Weblog are available nowhere else, to my knowledge. The Weblog will continue to offer an assessment of the market's short- and intermediate-term trending, and it will conclude with an overarching trading plan for the coming day. In the section that has been labeled "Market Context" will appear the Micropsychology Modeling results for that day. At a glance, readers will be able to determine whether the models are bullish, bearish, or neutral at defined time frames. The Weblog will generally be posted by 10 PM CT, summarizing the past day for traders and orienting them to the coming day.
2) TraderFeed - This will continue as a blog site for original historical market research, with occasional articles relevant to an understanding of trading and markets. Most of the posted studies will focus on market variables widely available to the trading public (unlike the Trading Psychology Weblog, which is modeling with proprietary measures developed over many years) and will have some relevance to the upcoming trade. For instance, TraderFeed may look at what happens when we're at a particular level of price change and VIX level and compare those historical expectations to what was discovered in the recent Micropsychology modeling. The TraderFeed posting will generally be on the site before 7:30 AM CT. The new feature of TraderFeed will be a second, mid-morning posting that tracks how the market is actually trading that day. A particular focus will be a tracking of large traders and how they are leaning. I find that this information is most often missing in traders' awareness and is of greatest assistance to their performance. Knowing how large traders are trading will keep you out of bad trades and help you assess whether or not the historical modeling findings are likely to pan out in the day session.
As a result, traders can expect three pieces of communication to help them with their trading:
1) An evening market summary from the Trading Psychology Weblog providing the big picture;
2) Premarket research from TraderFeed offering an additional assessment of historical edge;
3) Midmorning update from TraderFeed providing the immediate, intraday trading picture for very short-term traders.
If you think this information would be of interest to you, I suggest that you add TraderFeed to your feed list, so that updates will come to you automatically. You can subscribe to Bloglines and add TraderFeed to your list that way, or you can simply click on the RSS feed link on the TraderFeed site and add the blog via FeedBurner. Of course, subscription is free and does not expose you to spam or other commercial solicitation. Both sites are now and forever more non-commercial.
You might also want to bookmark the Trading Psychology Weblog.
To the best of my knowledge, the integration of the Weblog and TraderFeed will provide the first real time, quantitatively driven trading guidance widely available to traders. The information on how large traders are trading and the Micropsychology modeling results will be data that, IMO, have the potential, to supplement your existing trading/analytic methods.
I encourage you to take a look at the information and not be too much in a rush to act upon it. See what makes sense to you, and see what might fit with your existing trading strengths and methods. Then provide me with feedback about what you like and don't like; what's useful and what's not. That will no doubt help me fine tune the offerings over time.
The idea is to improve trader performance, and my hope is that these trading tools will aid in that goal. Consider the sites as sources of decision support: data to be considered, but not blindly relied upon. I'd like to augment what you already do well, not turn you into a Dr. Brett clone!
Thanks for your continued support of the two sites. I look forward to hearing from you.
Brett
The Trend Is Your End Until You Bend, My Friend
In my recent Trading Markets article, I draw upon the excellent research of the Barchart site and track the performance of 12 technical trading systems in the S&P 500 (SPY) market. What I found was that, for the past two years, 11 of the 12 have been unprofitable--many of these unusually so. The system that buys upward readings in the 40-day Commodity Channel Index (and sells downward readings) was unprofitable 84% of the time, losing the equivalent of almost 260 S&P futures points during a bull market!
Trading a shorter time frame, with a system that tracks crossovers of dual channels around moving averages (8 and 10-day; buying moves above the upper channels; selling moves below the lower channels) results in more trades over the two-year period (101), with 28 winners and 73 losers. That particular effort resulted in the equivalent of over 200 lost S&P futures points since August, 2004.
Driving the point home, Barchart assembles all the systems into a single Trend Spotter system(recognizing that the various systems are buying strength and selling weakness). That system yielded 22 trades since 2004, with 6 winners and 16 losers. It also managed to lose the equivalent of over 200 ES points in a bull market. And that's a trend following methodology!
Now before the harpies of trend-following hell decide to descend upon my unworthy head, let me emphasize that I'm *not* saying that trend-following is a worthless methodology. Michael Covel and Ed Seykota, among many others, have written eloquently on the virtues of trend following. Rather, what I'm pointing out is that trend following has been disastrous in the S&P equity index market over the past two years. I attribute this, in part, to the rise of program trading/arbitrage which now accounts for over 50% of market volume, according to the excellent H.L Camp service. When an institution buys the S&P 500 Index futures, it doesn't at all necessarily mean that the institution is bullish. It could be simultaneously selling baskets of S&P stocks, or selling the ETF. Selling the futures when they're out of line with cash and the ETF helps restrain market trending at even the shortest time frames.
This article from my personal site illustrates how we have systematically lost trendiness in the S&P 500 index market over a period of many years. By no means is this a phenomenon limited to the past two years. Many, many formerly successful daytraders in Chicago failed to adapt to this major sea change.
So what's a momentum trader or trend follower to do?
Let's go back to Barchart and check out their Trend Spotter system for the emerging markets ETF (EEM). Lo and behold, we find that, since September, 2004, we've had 15 trend following trades, with 7 profitable. Over the two-year period the same system that lost over 200 ES points gained 14.50 EEM points or about 25%. Yes, that's below the return from buy and hold, but notice the difference with the SPY results.
Gold? If we track the GLD ETF, we find 8 of those 12 Barchart technical trading systems yielded profits.
Clearly, if you're going to buy strength and sell weakness, *what* you trade makes a world of difference. An informal rule that I've found useful: Look at the depth of the market order book for whatever you're trading. The deeper the trading instrument's book, the less likely it is to trend. We see very deep books in the fixed income futures markets and in the ES; less so in the Russell 2000 futures; less so still in the emerging markets.
Inexorably, however, hedge funds and other quantitative trading institutions are picking off the lower-hanging market fruit. With the vast expansion of ETFs, comes the opportunity for continued expansion of arbitrage and expanded liquidity of global markets (as exemplified by deeper order books). Already it is difficult to find any equity futures index/ETF that outperforms buy and hold on Barchart's systems. Which itself may point to a source of possible edge for traders able to fade the normal human tendency to extrapolate the recent past into the near-term future.
Friday, August 18, 2006
Alexa as a Research Tool
Most readers are familiar with Amazon's Alexa website. It tracks Web traffic at various sites and offers rankings as to the popularity of those sites. Thus, a site that has a ranking of 100,000 is the 100,000th most visited site on the Web. The Alexa toolbar can be downloaded so that you see all the rankings of sites you visit (as well as user reviews; Alexa rates Websites like Amazon rates books). It also enables your visits to register with the Alexa rankings.
A little while back, Random Roger passed along a post regarding Alexa as a research tool. The idea struck me as interesting. Alexa, to be sure, is not a perfect methodology, as James Altucher recently noted with respect to the Alexaholic site. One site owner passed on to me some strategies for manipulating the rankings by bombing target sites with visits; I also know from the relative rankings of my two sites that the ratings imperfectly correlate with actual logged visits. Still, the growth in visits in my sites has correlated with rises in the Alexa rankings, leading me to believe that the methodology has some merit.
Above, for example, we see the long-term Alexa rankings for the Realtor.com site. There is a cyclical pattern to visits, but not a significant downtrend as one might expect, given the weak residential real estate market. Visits definitely tend to wane in the last quarter of the year, perhaps reflecting the hesitance of families to move after the school year has started and winter is under way. Mid 2003-early 2004 represented a high water mark for visits; late 2005 through 2006 has been relatively weak. One possibility: it's a glut of supply and not a significant waning of demand that is weighing on the housing market.
Dell's site shows a different cyclical pattern on Alexa, with visits spiking toward the end of the year. This, presumably, is attributable to holiday season gift buying. There is an overall positive trend to the visits from 2002-2006, with big spikes at year's end in 2004 and 2005. Thus far, 2006 visits have dipped below the levels seen in 2005. One research application: monitor Alexa carefully as we approach holiday season to see if the expected spike materializes.
Still yet another application: Not only has there been an exponential growth of trading blogs, but the Alexa traffic to those blogs has expanded significantly. Go to Alexa and check out, for instance, the traffic to the Seeking Alpha site. Like many established sites, it went through a parabolic rise into early 2006 before settling back a bit. This may in part be a function of the Alexa methodology, which presumably (like Amazon) weights recent visits more highly than past ones in generating rankings. Nonetheless, the growth across multiple blogs is impressive: this is becoming a major form of publication in the financial world.
Take a look at the list of market blogs included in Ticker Sense's poll. I'm in the process of assembling a composite Alexa index that includes many of these sites, so that we can track overall traffic to the trading blogosphere. Will traffic vary with market conditions? Will jumps and declines in traffic correspond to increased/decreased public participation in the markets? These are a few of the issues that we might investigate with Alexa, as well as with blog search engines such as Technorati.
Thursday, August 17, 2006
Why It's So Easy to Lose Money in the Markets
A reader recently emailed me a deceptively simple question: "Why is it so much easier to lose money in the markets than to make money?"
Well, let's look at a few reasons:
1) The stocks and indices most familiar to traders have provided the worst returns.
2) The time frame most comfortable for short-term traders (daytrading) has provided the worst returns.
3) The growth of stock index and ETFs has created automated arbitrage strategies that have greatly diminished market trending.
4) Markets tend to confound human nature by refusing to do in the next time period what they have done in the previous one.
5) Because of the above, following normal human sentiment makes people lose money in the markets, almost as if the game is rigged.
6) Because markets change their trending and volatility over time, we'll always tend to be most confident just as things are turning--and overconfidence is deadly.
7) There's no minor league for trading: once you place your order, you're up against the pros, who have a lot of tools at their disposal.
I've learned many things from traders, but this perhaps is most important: The most successful traders and trading organizations I've had the pleasure of getting to know are constantly adapting to changing market conditions. They don't rely on a single trading model; they are always modeling. They do not scalp the midday hours the same as they approach the early morning. They know the difference between a market with active institutional participation and one dominated by locals--and trade accordingly.
People are comfortable with the known, and that keeps them static. It is so easy to lose money in the markets, because markets are dynamic.
Wednesday, August 16, 2006
Opening Gaps in the S&P 500 Index - Part Two

Note: To make it easier to automatically get updates from this blog, I've followed the suggestion of a couple of readers and added a FeedBurner link on the right side of the page. Click on that and you can add TraderFeed to your favorite browser or aggregator. This is an anonymous process and will not subject you to spam/solicitations. Eventually, TraderFeed will get to the point of offering intraday market postings and having automatic updating will be helpful during the trading day.
In the previous post, we saw that gaps between yesterday's close and today's open vary in size with the volatility of the market. In this post, we'll look at what I call the "relative gap". This is computed by taking the price change of the opening gap and expressing it as a proportion of the daily high-low range averaged over the past 40 days. All computations use SPY data.
Going back to March, 1996 (N = 2608 trading days), we find 197 occasions in which the opening range is .50% or more of the average daily trading range. That day's average price change from open to close is .09% (106 up, 91 down), stronger than the average daily open to close change of -.02% (1303 up, 1305 down). This strength tended to persist to the close of the following session, with an average price change of .14% (111 up, 86 down). That is stronger than the average price change from open to following day's close of .01% (1352 up, 1256 down).
During the period since March, 1996, we had 123 occasions in which there was a downside gap in excess of .50% of the average daily trading range. From the open to the day's close, the average price change in SPY was .43% (73 up, 50 down), very much stronger than the average daily open to close change as noted above. That strength also persisted into the close of the following day, with an average change of .66% (70 up, 53 down).
Interestingly, large opening gaps are associated with larger daily trading ranges. When the relative gap was .50% or greater, the day's average trading range was .92%. That is wider than the average trading range of .77% for the sample overall. When the relative gap was -.50% or weaker, the average trading range was a large 1.22%. It thus appears that large relative gaps have bullish implications--especially when they're to the downside--and that large relative gaps tend to be associated with more volatile action during the day trading session.
Tuesday, August 15, 2006
Opening Gaps in the S&P 500 Index: Part One
The technical analysis literature on opening gaps in the market is filled with generalizations that may or may not be valid. Rarely do we see a hard statistical look at opening gaps. (A notable exception is the fine work of Jason Goepfert at the Sentimentrader site). So I thought I'd use Monday's example of a filled opening gap to explore the whole topic.
First off, let's establish what an opening gap means. I'm using SPY daily data and examining the disparity between where the index closed the previous day and where it opens today. We can attribute these gaps to news events overnight and the influence of overseas markets. The gap is also influenced by economic data that are reported prior to the New York open. Regardless of the cause, a large gap is an indication that market participants have shifted their valuation of stocks. When a gap is filled, it means that the initial revaluation was probably an overreaction. An unfilled gap suggests that the overnight events may have been of fundamental importance, driving a shift in investor perceptions regarding equities.
Going back to March, 1997 (N = 2375 trading days), the median opening gap--up or down--has been .29%. We have had 98 upside gaps of +1% or more; 83 downside gaps of -1% or more. The gap has been relatively small (less than .20% and greater than -.20%) on 854 occasions, or more than a third of the time. Of all days, 1760 (about three quarters of occasions) eventually touch the prior day's closing price during the day session, which means that any opening gap was filled.
The average size of an opening gap is highly sensitive to the market's overall volatility. When the VIX has been 20 or greater (N = 1382), the median size of the opening gap has been .39%. When the VIX has been under 20 (N = 993), the median gap has been .20%. Interestingly, the same proportion of gaps is filled under volatile and non-volatile conditions. That very strongly suggests to me that the odds of filling a gap of, say, .40% very much depend upon overall market volatility. The odds would be pretty good in a volatile market; much more remote in non-volatile markets. It might make sense, when analyzing gaps, to evaluate them as a proportion of recent daily range, rather than as an absolute price change.
We've had 452 days in which the VIX has been below 15. The median opening gap on those occasions has been .17%, with 341 filled gaps--that same 3/4 proportion. During those days, we've only had 28 occasions of an upside gap greater than .40%; 13 of these were filled. There were only 12 occasions of downside gaps less than -.40%; 8 of those were filled in the day session. It thus hasn't paid in low volatility markets to sell the open when we've had large gaps down, but it also hasn't been common that we've had large downside gaps in low volatility markets.
And when we've filled large upside gaps in low volatility markets (N = 13)? The following day in SPY has been up 10 times and down only 3. A filled upside gap has not necessarily been a bearish short-term indication for the market, contrary to common impression. More on this interesting topic to come, both here and on the Trading Psychology Weblog.
Added note (8:00 AM CT): Of the 28 occasions we've had large opening gaps (.40% or greater)in a low volatility market, the market was up from open to close 16 times, down 12 times, for an average SPY change of .08%--better than average. If, however, we look to the close of the following day, the market was up 18 times, down 10 for an above average gain of .20%. The average gain for the sample overall is only .01%.
Subscribe to:
Posts (Atom)


